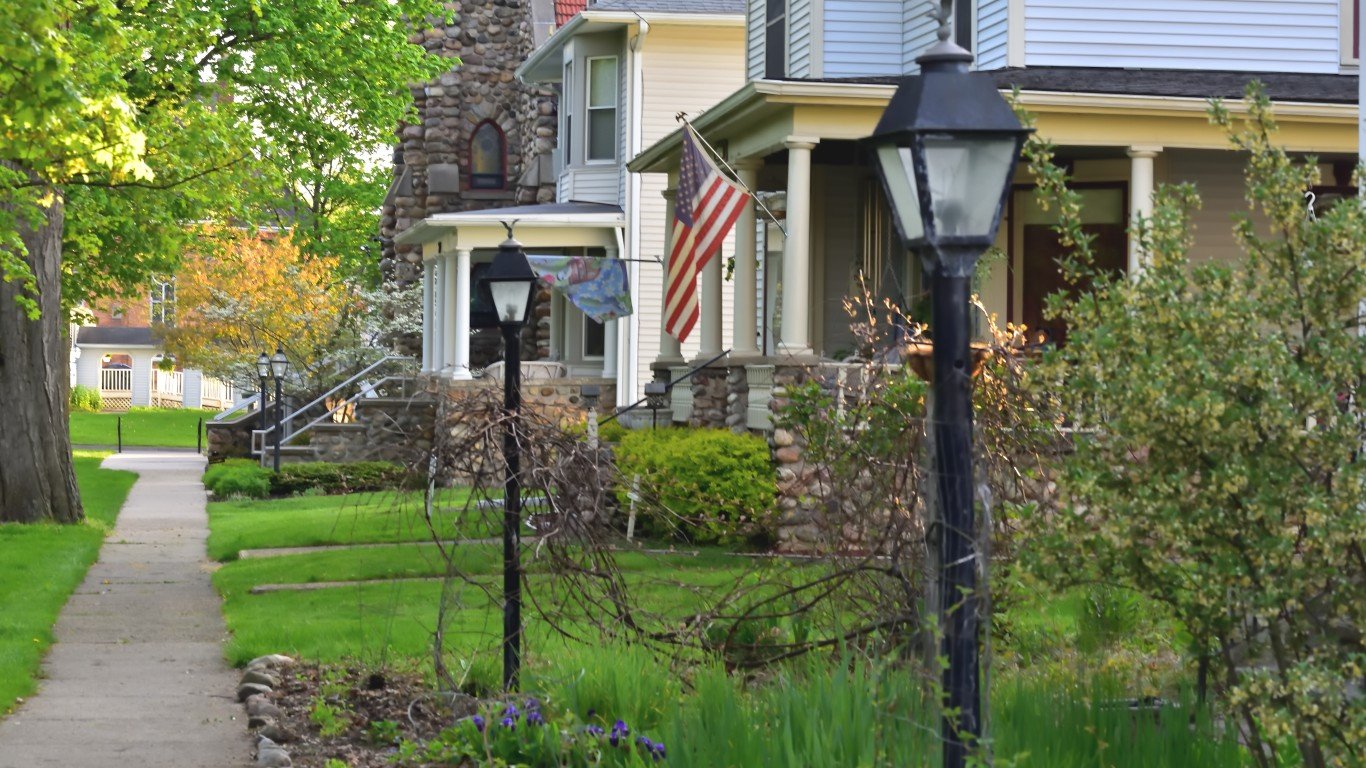
Every year in the United States, tens of millions of Americans move to a new home. According to the U.S. Census Bureau, the bulk of these moves are motivated by personal circumstances, often relating to housing, family, or employment. But when it comes to deciding on a place to live, it can also be helpful to weigh other, less subjective factors.
As a means of gauging and comparing degrees of development between countries — beyond standard measures like gross domestic product and economic growth — the United Nations created the Human Development Index. By accounting for factors related to health and well-being, educational attainment, and standards of living, the HDI offers an assessment of overall quality of life at the individual level within a given geography.
When applied to communities within the United States, the core principles of the HDI reveal that some parts of the country are far better places to live than others.
Using an index inspired by the HDI, 24/7 Wall St. identified the best counties in Michigan to live in. Counties are ranked on a combination of three measures – average life expectancy at birth, the share of adults with a bachelor’s degree or higher, and the poverty rate. Of the 83 counties in Michigan, we ranked the 30 with the highest HDI score.
Across all of Michigan, average life expectancy at birth is 77.5 years. Additionally, 13.1% of the population live below the poverty line and 31.1% of adults have a bachelor’s degree or higher. Of the 30 counties on this list, 13 compare favorably to the state as a whole in each of these metrics.
Among these 30 Michigan counties, average life expectancy at birth ranges from 76.9 years to 82.3 years. Meanwhile, poverty rates vary between 4.9% and 17.3%, and bachelor’s degree attainment rates range from about 21% to over 50%.
Data used to calculate rankings are from the U.S. Census Bureau’s 2022 American Community Survey and County Health Rankings & Roadmaps, a joint program of the Robert Wood Johnson Foundation and the University of Wisconsin Population Health Institute. All ACS data are five-year averages.
Why It Matters

Many of the most commonly cited economic indicators — including unemployment, GDP, and industrial output — are useful gauges of prosperity and productive capacity in a given area. But when it comes to measuring overall quality of life, any single metric inevitably falls short. To address these shortcomings, the HDI combines three key social and economic measures into a single index score, allowing for objective comparisons between communities across the United States.
30. Mason County

- Avg. life expectancy at birth: 77.9 years
- Poverty rate: 13.7%
- Adults with a bachelor’s degree: 24.2%
- Median household income: $60,744
- Population: 29,178
29. Manistee County

- Avg. life expectancy at birth: 76.9 years
- Poverty rate: 11.3%
- Adults with a bachelor’s degree: 22.5%
- Median household income: $59,467
- Population: 25,058
28. Monroe County
- Avg. life expectancy at birth: 77.4 years
- Poverty rate: 10.9%
- Adults with a bachelor’s degree: 22.6%
- Median household income: $72,573
- Population: 154,823
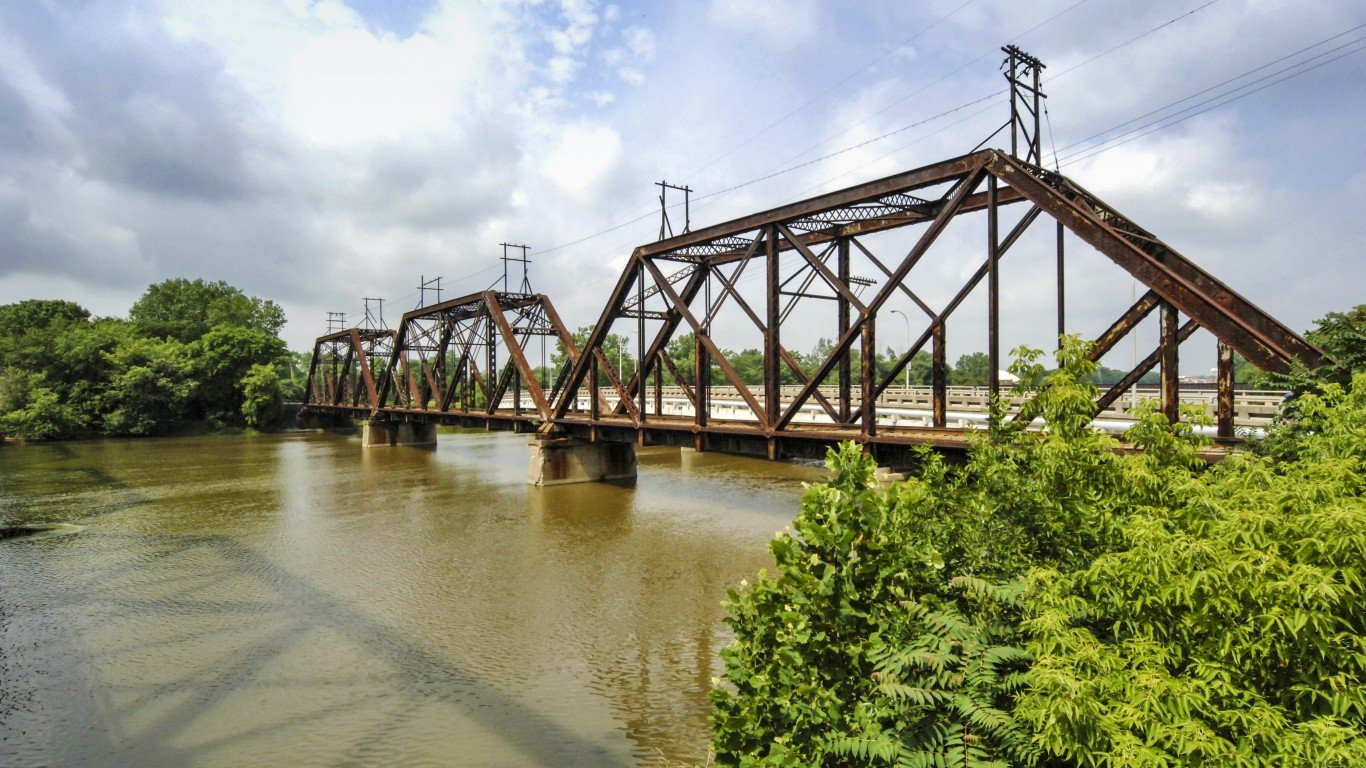
27. Lenawee County

- Avg. life expectancy at birth: 77.7 years
- Poverty rate: 11.1%
- Adults with a bachelor’s degree: 22.5%
- Median household income: $65,484
- Population: 99,263
26. Berrien County

- Avg. life expectancy at birth: 77.5 years
- Poverty rate: 15.7%
- Adults with a bachelor’s degree: 30.1%
- Median household income: $60,379
- Population: 153,938
25. Alger County

- Avg. life expectancy at birth: 80.1 years
- Poverty rate: 10.3%
- Adults with a bachelor’s degree: 20.7%
- Median household income: $55,528
- Population: 8,866
24. Dickinson County

- Avg. life expectancy at birth: 77.7 years
- Poverty rate: 9.7%
- Adults with a bachelor’s degree: 23.9%
- Median household income: $59,651
- Population: 25,937
23. Otsego County

- Avg. life expectancy at birth: 77.2 years
- Poverty rate: 10.7%
- Adults with a bachelor’s degree: 26.3%
- Median household income: $62,865
- Population: 25,221
22. Allegan County

- Avg. life expectancy at birth: 78.2 years
- Poverty rate: 9.5%
- Adults with a bachelor’s degree: 24.1%
- Median household income: $75,543
- Population: 120,189
21. Macomb County

- Avg. life expectancy at birth: 77.4 years
- Poverty rate: 9.8%
- Adults with a bachelor’s degree: 26.8%
- Median household income: $73,876
- Population: 878,453
20. Houghton County

- Avg. life expectancy at birth: 78.4 years
- Poverty rate: 17.3%
- Adults with a bachelor’s degree: 35.8%
- Median household income: $52,736
- Population: 37,414
19. Barry County

- Avg. life expectancy at birth: 79.2 years
- Poverty rate: 8.3%
- Adults with a bachelor’s degree: 23.6%
- Median household income: $75,182
- Population: 62,581
18. Marquette County

- Avg. life expectancy at birth: 78.7 years
- Poverty rate: 13.6%
- Adults with a bachelor’s degree: 34.7%
- Median household income: $63,115
- Population: 66,376
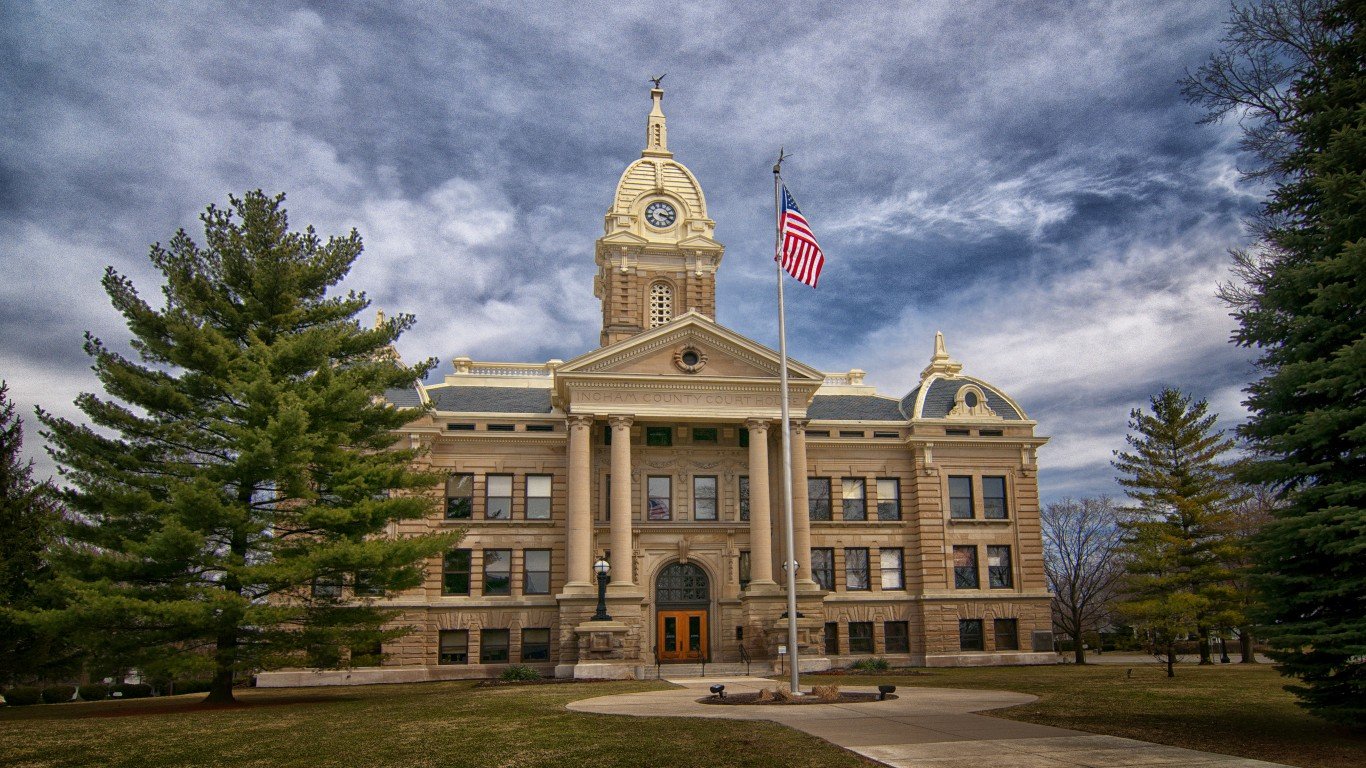
17. Ingham County
- Avg. life expectancy at birth: 77.6 years
- Poverty rate: 16.5%
- Adults with a bachelor’s degree: 40.6%
- Median household income: $62,548
- Population: 282,540
16. Benzie County

- Avg. life expectancy at birth: 78.2 years
- Poverty rate: 10.4%
- Adults with a bachelor’s degree: 32.4%
- Median household income: $71,327
- Population: 18,058
15. Eaton County

- Avg. life expectancy at birth: 78.5 years
- Poverty rate: 7.6%
- Adults with a bachelor’s degree: 30.3%
- Median household income: $77,158
- Population: 109,072
14. Antrim County

- Avg. life expectancy at birth: 80.4 years
- Poverty rate: 9.4%
- Adults with a bachelor’s degree: 32.5%
- Median household income: $68,850
- Population: 23,662
13. Kalamazoo County

- Avg. life expectancy at birth: 78.6 years
- Poverty rate: 13.4%
- Adults with a bachelor’s degree: 40.5%
- Median household income: $67,905
- Population: 261,426
12. Charlevoix County

- Avg. life expectancy at birth: 79.6 years
- Poverty rate: 8.6%
- Adults with a bachelor’s degree: 33.0%
- Median household income: $69,764
- Population: 26,174
11. Clinton County

- Avg. life expectancy at birth: 81.1 years
- Poverty rate: 9.6%
- Adults with a bachelor’s degree: 32.2%
- Median household income: $82,594
- Population: 79,249
10. Midland County

- Avg. life expectancy at birth: 80.4 years
- Poverty rate: 10.1%
- Adults with a bachelor’s degree: 35.6%
- Median household income: $73,643
- Population: 83,503
9. Kent County

- Avg. life expectancy at birth: 79.4 years
- Poverty rate: 10.7%
- Adults with a bachelor’s degree: 38.6%
- Median household income: $76,247
- Population: 657,321
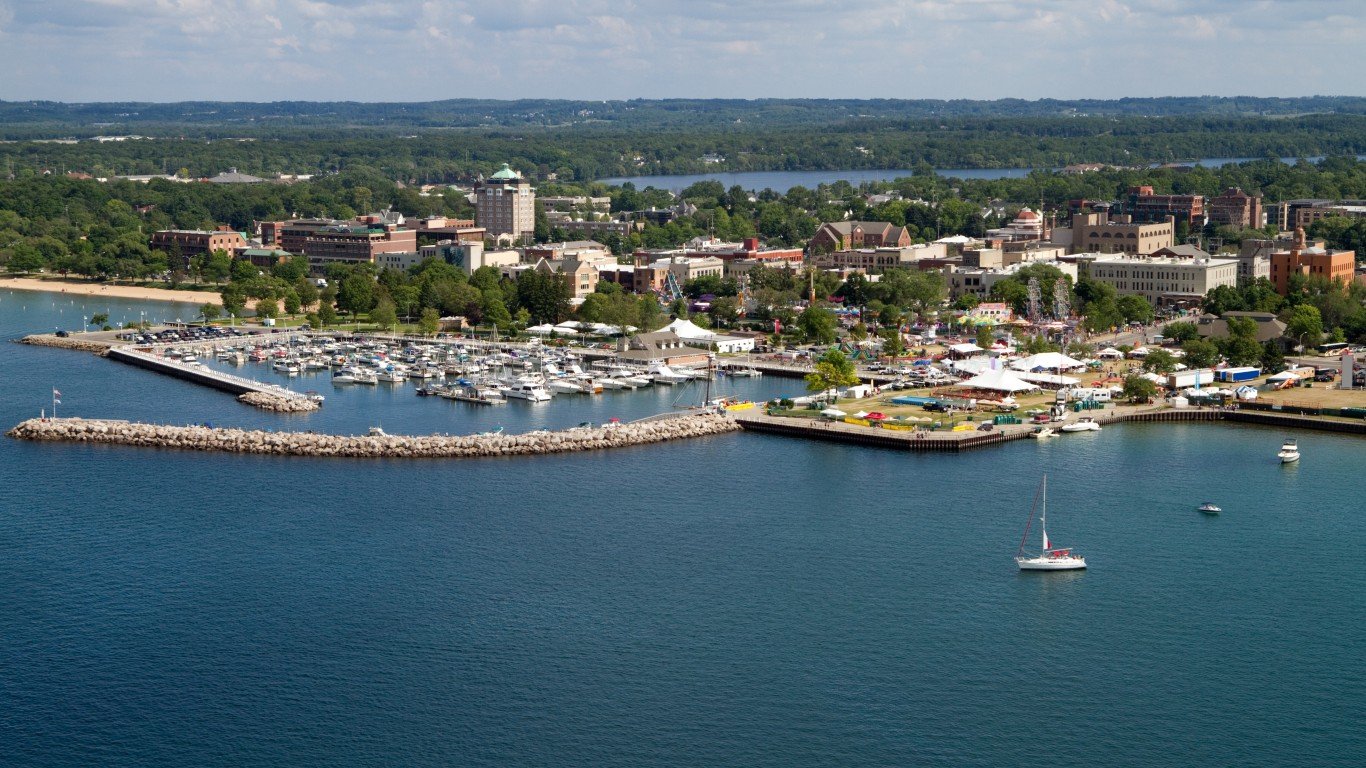
8. Grand Traverse County
- Avg. life expectancy at birth: 79.8 years
- Poverty rate: 10.4%
- Adults with a bachelor’s degree: 38.7%
- Median household income: $75,553
- Population: 95,315
7. Emmet County
- Avg. life expectancy at birth: 79.3 years
- Poverty rate: 8.4%
- Adults with a bachelor’s degree: 37.9%
- Median household income: $69,690
- Population: 34,072
6. Keweenaw County

- Avg. life expectancy at birth: 79.3 years
- Poverty rate: 7.8%
- Adults with a bachelor’s degree: 38.3%
- Median household income: $55,560
- Population: 2,088
5. Ottawa County

- Avg. life expectancy at birth: 81.3 years
- Poverty rate: 7.6%
- Adults with a bachelor’s degree: 36.5%
- Median household income: $83,932
- Population: 296,183
4. Livingston County
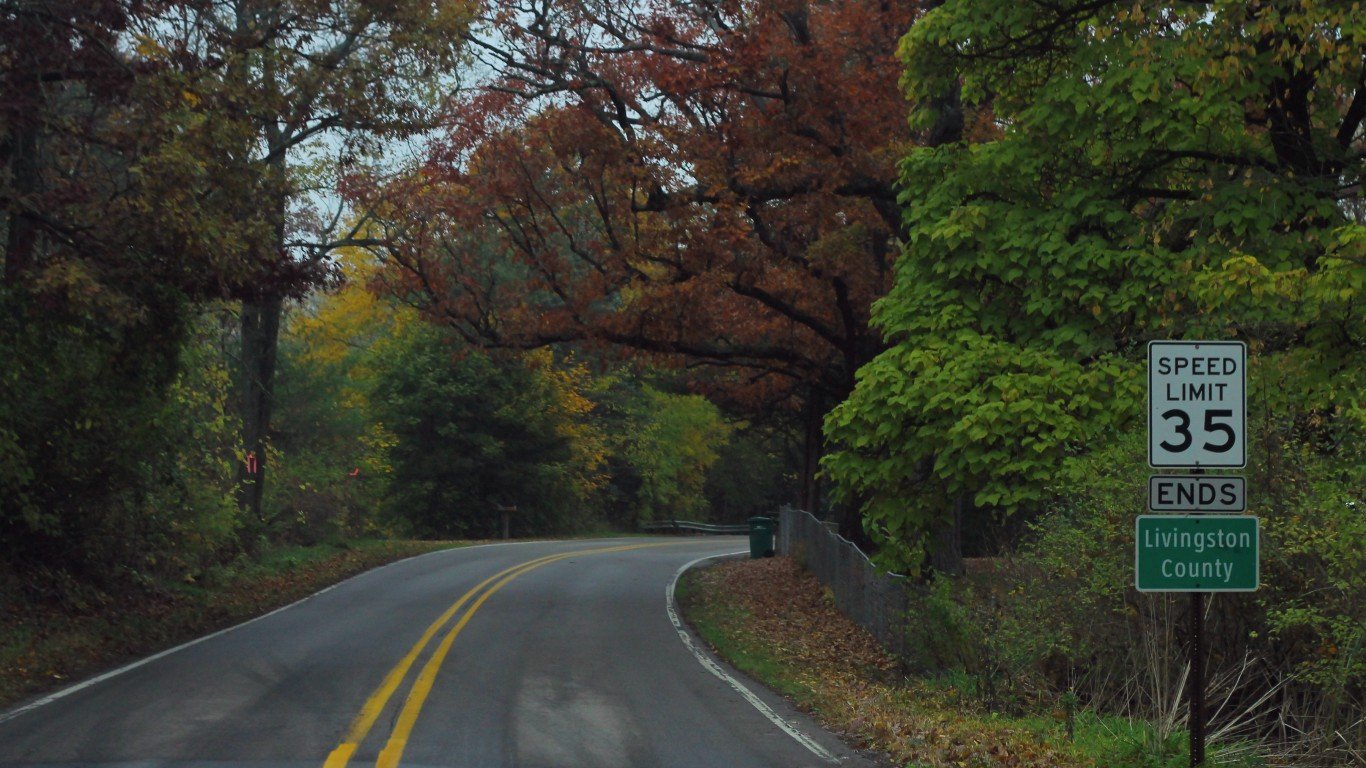
- Avg. life expectancy at birth: 80.8 years
- Poverty rate: 4.9%
- Adults with a bachelor’s degree: 38.1%
- Median household income: $96,135
- Population: 194,302
3. Oakland County

- Avg. life expectancy at birth: 79.9 years
- Poverty rate: 7.7%
- Adults with a bachelor’s degree: 49.5%
- Median household income: $92,620
- Population: 1,272,264
2. Washtenaw County
- Avg. life expectancy at birth: 80.9 years
- Poverty rate: 13.8%
- Adults with a bachelor’s degree: 57.4%
- Median household income: $84,245
- Population: 370,231
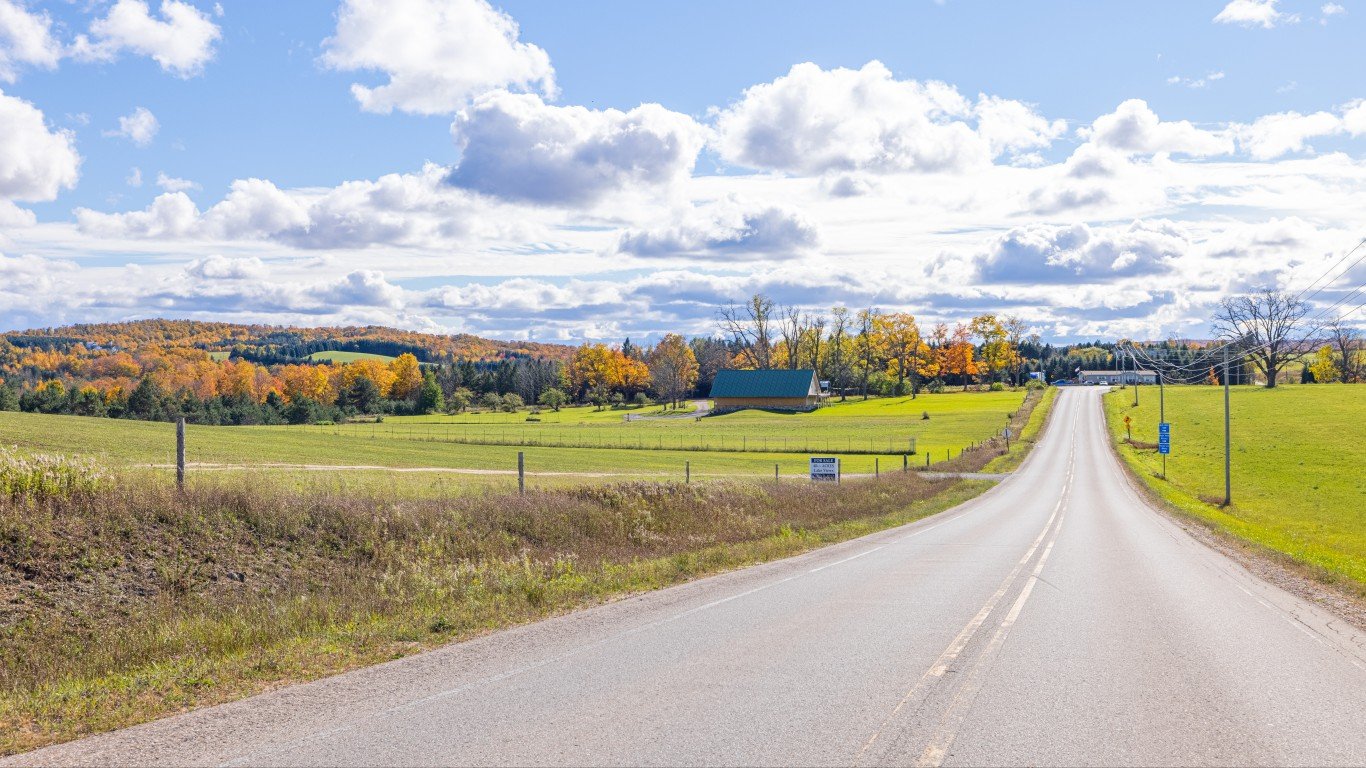
1. Leelanau County
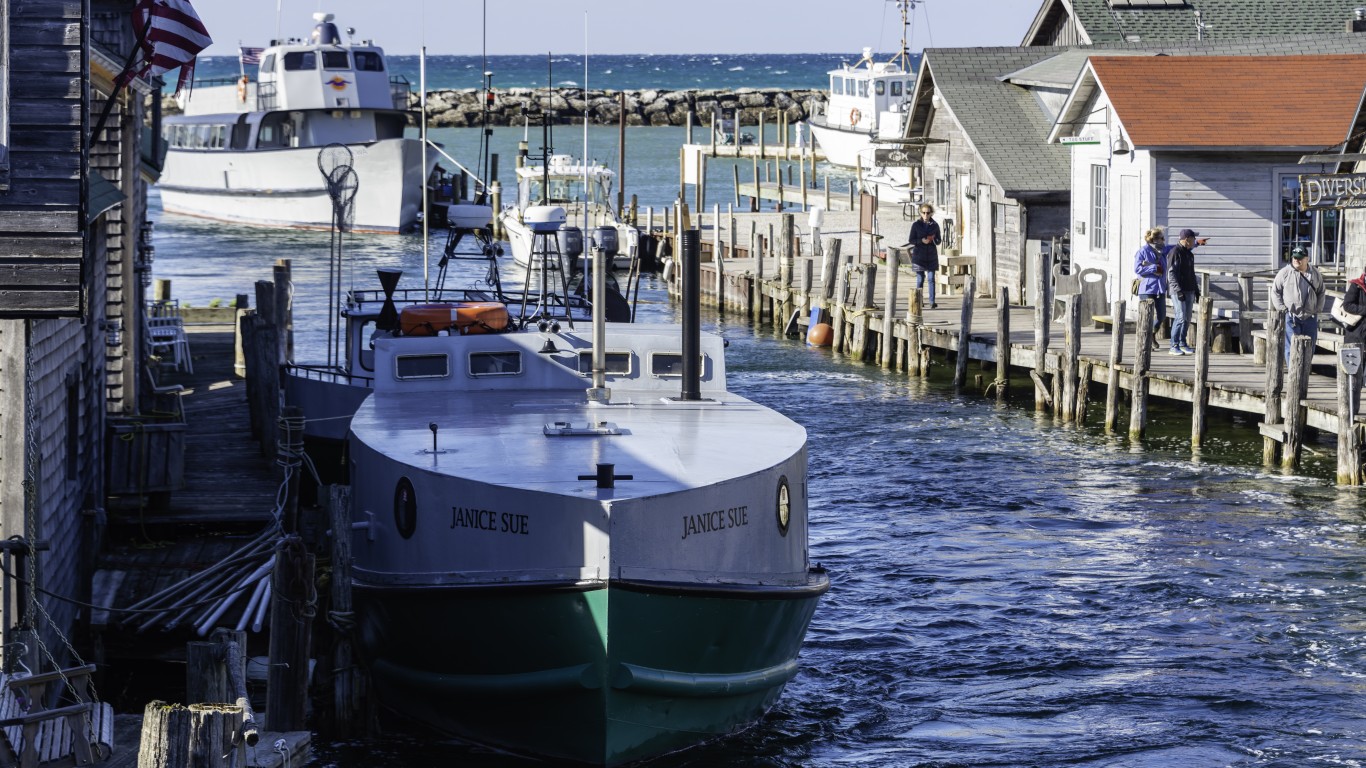
- Avg. life expectancy at birth: 82.3 years
- Poverty rate: 6.7%
- Adults with a bachelor’s degree: 48.6%
- Median household income: $82,345
- Population: 22,426
| Rank | County | Avg. life expectancy at birth (yrs.) | Adults with a bachelor’s degree (%) | Poverty rate (%) | Population |
|---|---|---|---|---|---|
| 1 | Leelanau, Michigan | 82.3 | 48.6 | 6.7 | 22,426 |
| 2 | Washtenaw, Michigan | 80.9 | 57.4 | 13.8 | 370,231 |
| 3 | Oakland, Michigan | 79.9 | 49.5 | 7.7 | 1,272,264 |
| 4 | Livingston, Michigan | 80.8 | 38.1 | 4.9 | 194,302 |
| 5 | Ottawa, Michigan | 81.3 | 36.5 | 7.6 | 296,183 |
| 6 | Keweenaw, Michigan | 79.3 | 38.3 | 7.8 | 2,088 |
| 7 | Emmet, Michigan | 79.3 | 37.9 | 8.4 | 34,072 |
| 8 | Grand Traverse, Michigan | 79.8 | 38.7 | 10.4 | 95,315 |
| 9 | Kent, Michigan | 79.4 | 38.6 | 10.7 | 657,321 |
| 10 | Midland, Michigan | 80.4 | 35.6 | 10.1 | 83,503 |
| 11 | Clinton, Michigan | 81.1 | 32.2 | 9.6 | 79,249 |
| 12 | Charlevoix, Michigan | 79.6 | 33.0 | 8.6 | 26,174 |
| 13 | Kalamazoo, Michigan | 78.6 | 40.5 | 13.4 | 261,426 |
| 14 | Antrim, Michigan | 80.4 | 32.5 | 9.4 | 23,662 |
| 15 | Eaton, Michigan | 78.5 | 30.3 | 7.6 | 109,072 |
| 16 | Benzie, Michigan | 78.2 | 32.4 | 10.4 | 18,058 |
| 17 | Ingham, Michigan | 77.6 | 40.6 | 16.5 | 282,540 |
| 18 | Marquette, Michigan | 78.7 | 34.7 | 13.6 | 66,376 |
| 19 | Barry, Michigan | 79.2 | 23.6 | 8.3 | 62,581 |
| 20 | Houghton, Michigan | 78.4 | 35.8 | 17.3 | 37,414 |
| 21 | Macomb, Michigan | 77.4 | 26.8 | 9.8 | 878,453 |
| 22 | Allegan, Michigan | 78.2 | 24.1 | 9.5 | 120,189 |
| 23 | Otsego, Michigan | 77.2 | 26.3 | 10.7 | 25,221 |
| 24 | Dickinson, Michigan | 77.7 | 23.9 | 9.7 | 25,937 |
| 25 | Alger, Michigan | 80.1 | 20.7 | 10.3 | 8,866 |
| 26 | Berrien, Michigan | 77.5 | 30.1 | 15.7 | 153,938 |
| 27 | Lenawee, Michigan | 77.7 | 22.5 | 11.1 | 99,263 |
| 28 | Monroe, Michigan | 77.4 | 22.6 | 10.9 | 154,823 |
| 29 | Manistee, Michigan | 76.9 | 22.5 | 11.3 | 25,058 |
| 30 | Mason, Michigan | 77.9 | 24.2 | 13.7 | 29,178 |
Buffett Missed These Two…
Warren Buffett loves dividend stocks, and has stuffed Berkshire with some of his favorites.
But he overlooked two dividend legends that continue to print checks on a new level, they’re nowhere in his portfolio.
Unlock the two dividend legends Buffett missed in this new free report.
The post Michigan’s Best Counties to Live In appeared first on 24/7 Wall St..