The U.S. economy is not only the largest in the world, but also among the most resilient. Of all countries in the Group of Seven — a forum of seven industrialized democracies that includes France, Germany, Japan, the U.K. and the United States — the U.S. reported the fastest post-pandemic reduction in core inflation and was the first G7 member to restore real GDP growth to pre-pandemic levels. Looking forward, American GDP growth is projected to outpace that of every other large, advanced economy in 2024, according to the International Monetary Fund.
Despite some strong fundamental economic indicators, a more holistic analysis reveals some deeply entrenched weaknesses in the United States. The United Nations Development Programme’s Human Development Index is a single measure made up of three components: life expectancy at birth, educational attainment, and financial stability. Designed to capture overall development potential, the HDI shows the U.S. ranking well behind many of its peers on the global stage.
According to the latest HDI report, the United States ranks 20th in the world, trailing Canada, Germany, South Korea, and several other European and Asian countries. When applied to geographies within the U.S., the HDI shows that development potential is especially low in many parts of the country.
Using an index inspired by the HDI, 24/7 Wall St. identified the 40 worst U.S. counties to live in. Counties and county equivalents are ranked on a combination of three measures – average life expectancy at birth, the share of adults with a bachelor’s degree or higher, and the poverty rate. Data used to calculate rankings are from the U.S. Census Bureau’s 2022 American Community Survey and County Health Rankings & Roadmaps, a joint program of the Robert Wood Johnson Foundation and the University of Wisconsin Population Health Institute. All ACS data are five-year averages. Counties with incomplete data were excluded from analysis.
Over half of the 40 counties and county equivalents on this list are in the South. Another 10 are in the Midwest, including eight South Dakota alone, the most of any state. Only four are in the West and none are in the Northeast. (Here is a look at America’s best counties to live in.)
Average life expectancy at birth is below the 78.5 year national average in every county on this list — in some cases, by more than 10 years. In most of these places, the poverty rate exceeds the 12.5% U.S. poverty rate by over 20 percentage points, and, among these same counties, the share of adults with a bachelor’s degree ranges from 20% to less than 5%. Meanwhile, over 34% of adults nationwide have a four-year college degree.
Explanations for widespread hardship in these places vary. Notably, many counties on this list — particularly those in South Dakota — are home to Native American reservations, places which, for a variety of historical and contemporary reasons, have long suffered from limited economic opportunity. Other counties on this list are concentrated in Appalachia, a region that has historically relied largely on coal extraction. In these places, long-term economic decline is closely linked to America’s dying coal industry. (Here is a look at 10 American cities destroyed by outsourcing jobs.)
Why It Matters

With a $27.4 trillion economy, the United States is by far the wealthiest country in the world. Even adjusting for population, U.S. GDP per capita is over $76,300, higher than in all but nine other countries, according to the World Bank. Still, not all parts of the country benefit from America’s relative prosperity. Across the U.S., there are communities largely defined by widespread financial hardship, lack of economic opportunity, and health outcomes that are well below average.
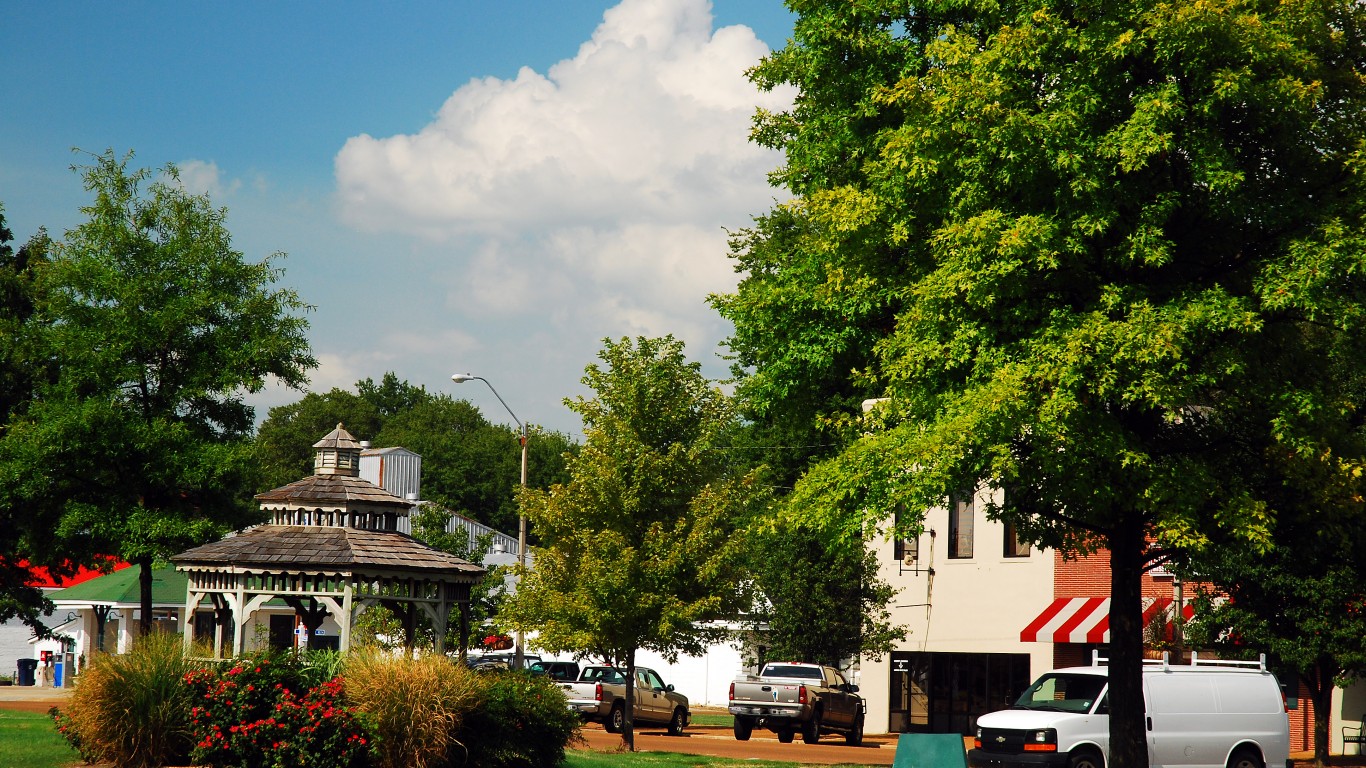
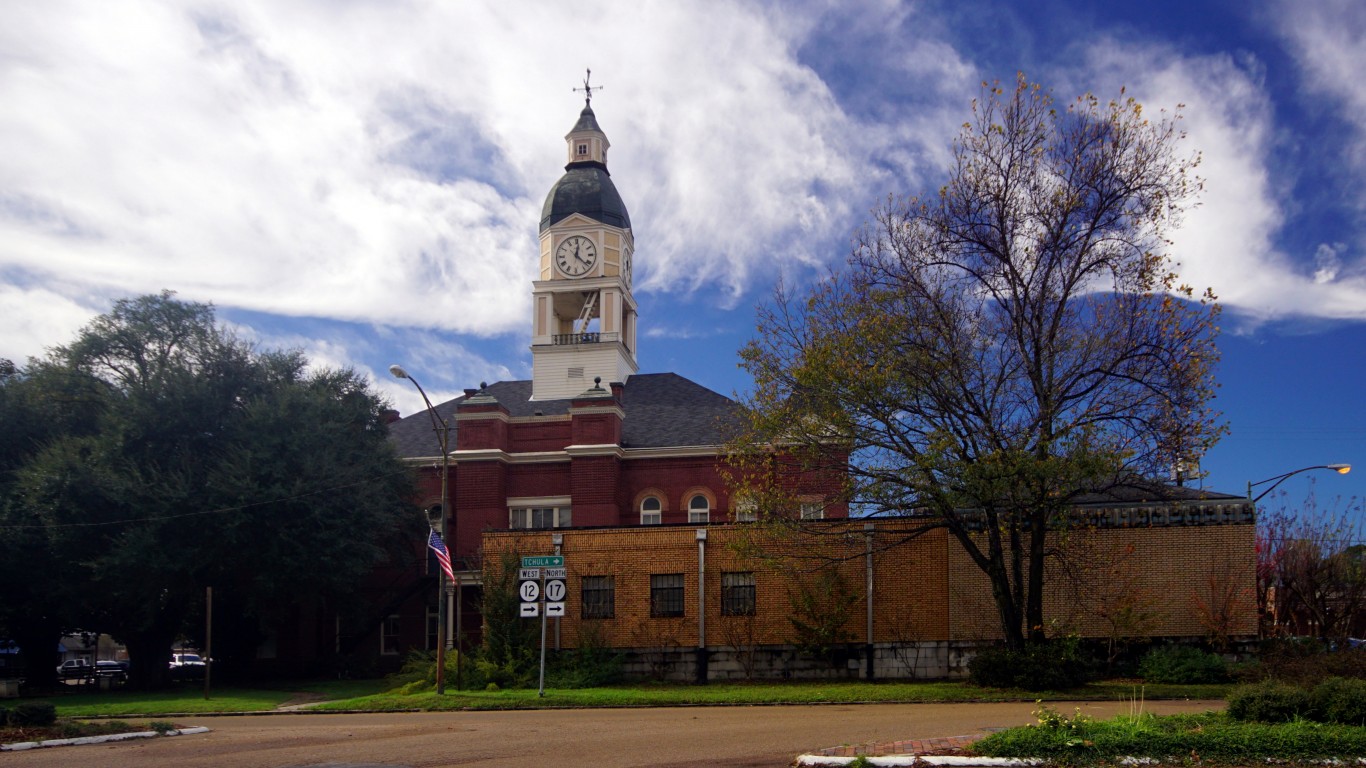
40. Quitman County, Mississippi

- Avg. life expectancy at birth: 69.5 years (9.0 years below U.S. avg.)
- Poverty rate: 30.2% (17.7 ppt. above U.S. avg.)
- Adults with a bachelor’s degree: 14.4% (19.9 ppt. below U.S. avg.)
- Median household income: $31,192 ($43,957 less than U.S. median)
- Population: 6,113
- County seat: Marks
39. Marlboro County, South Carolina

- Avg. life expectancy at birth: 71.4 years (7.1 years below U.S. avg.)
- Poverty rate: 27.8% (15.3 ppt. above U.S. avg.)
- Adults with a bachelor’s degree: 8.3% (26.0 ppt. below U.S. avg.)
- Median household income: $34,275 ($40,874 less than U.S. median)
- Population: 26,585
- County seat: Bennettsville
38. Lee County, Arkansas

- Avg. life expectancy at birth: 71.6 years (6.9 years below U.S. avg.)
- Poverty rate: 27.6% (15.1 ppt. above U.S. avg.)
- Adults with a bachelor’s degree: 7.7% (26.6 ppt. below U.S. avg.)
- Median household income: $33,801 ($41,348 less than U.S. median)
- Population: 8,666
- County seat: Marianna
37. Calhoun County, West Virginia
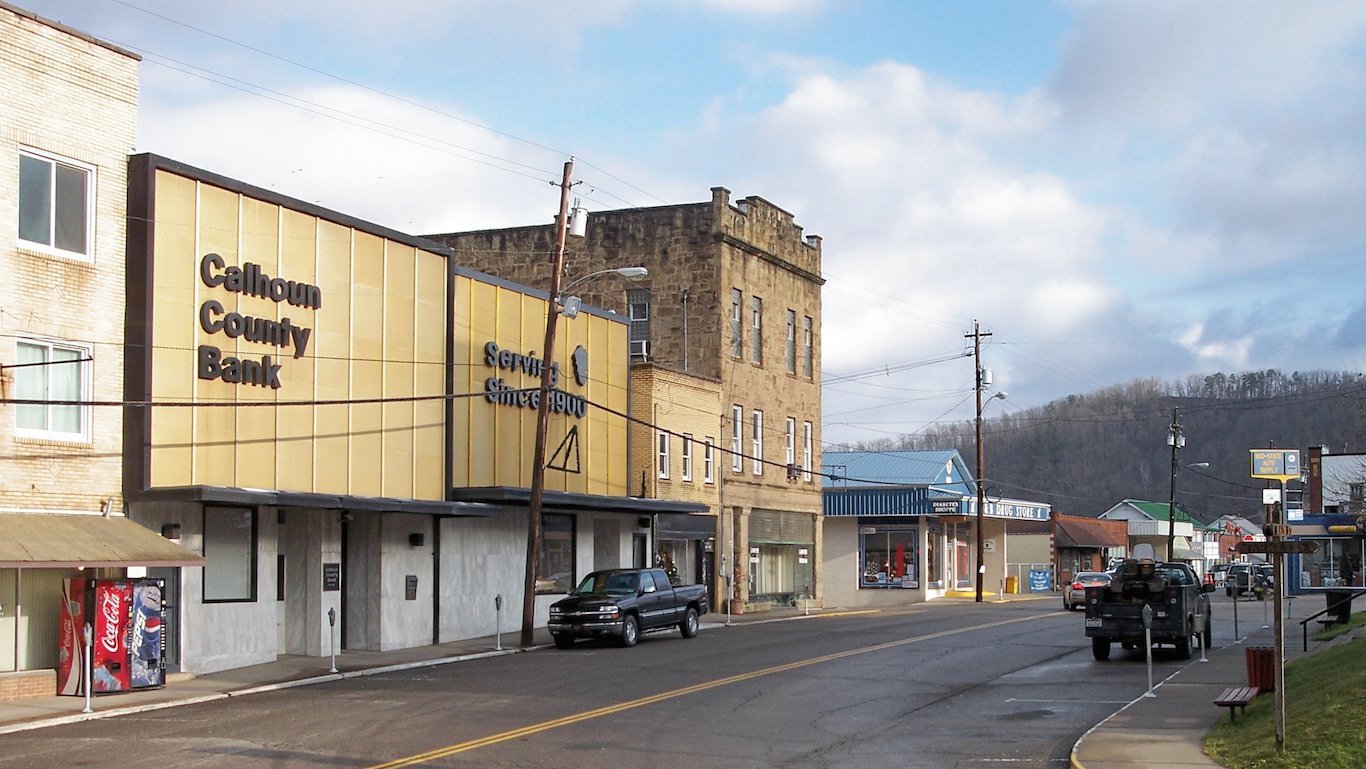
- Avg. life expectancy at birth: 76.6 years (2.0 years below U.S. avg.)
- Poverty rate: 33.7% (21.1 ppt. above U.S. avg.)
- Adults with a bachelor’s degree: 8.3% (26.0 ppt. below U.S. avg.)
- Median household income: $39,031 ($36,118 less than U.S. median)
- Population: 6,279
- County seat: Grantsville
36. Zapata County, Texas
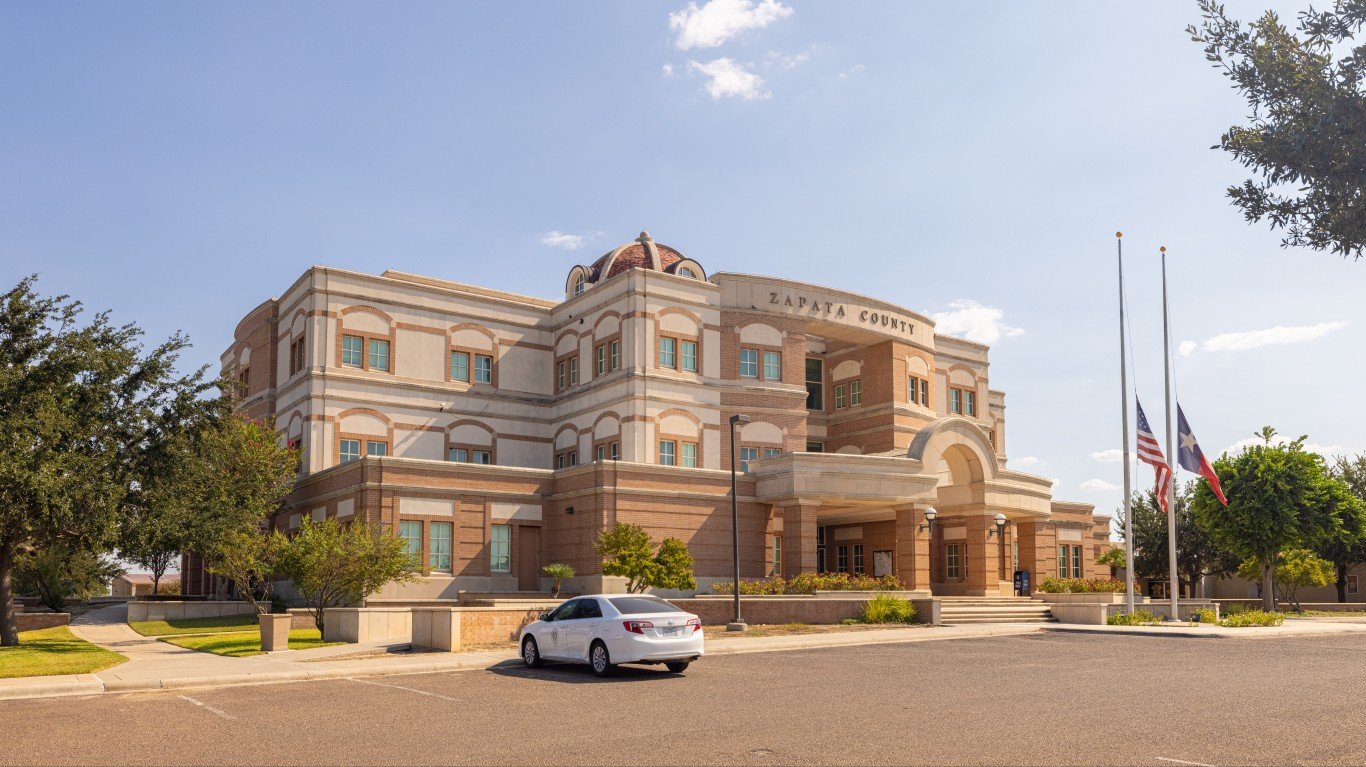
- Avg. life expectancy at birth: 77.8 years (0.7 years below U.S. avg.)
- Poverty rate: 37.2% (24.7 ppt. above U.S. avg.)
- Adults with a bachelor’s degree: 11.3% (23.0 ppt. below U.S. avg.)
- Median household income: $35,061 ($40,088 less than U.S. median)
- Population: 13,896
- County seat: Zapata
35. Perry County, Alabama
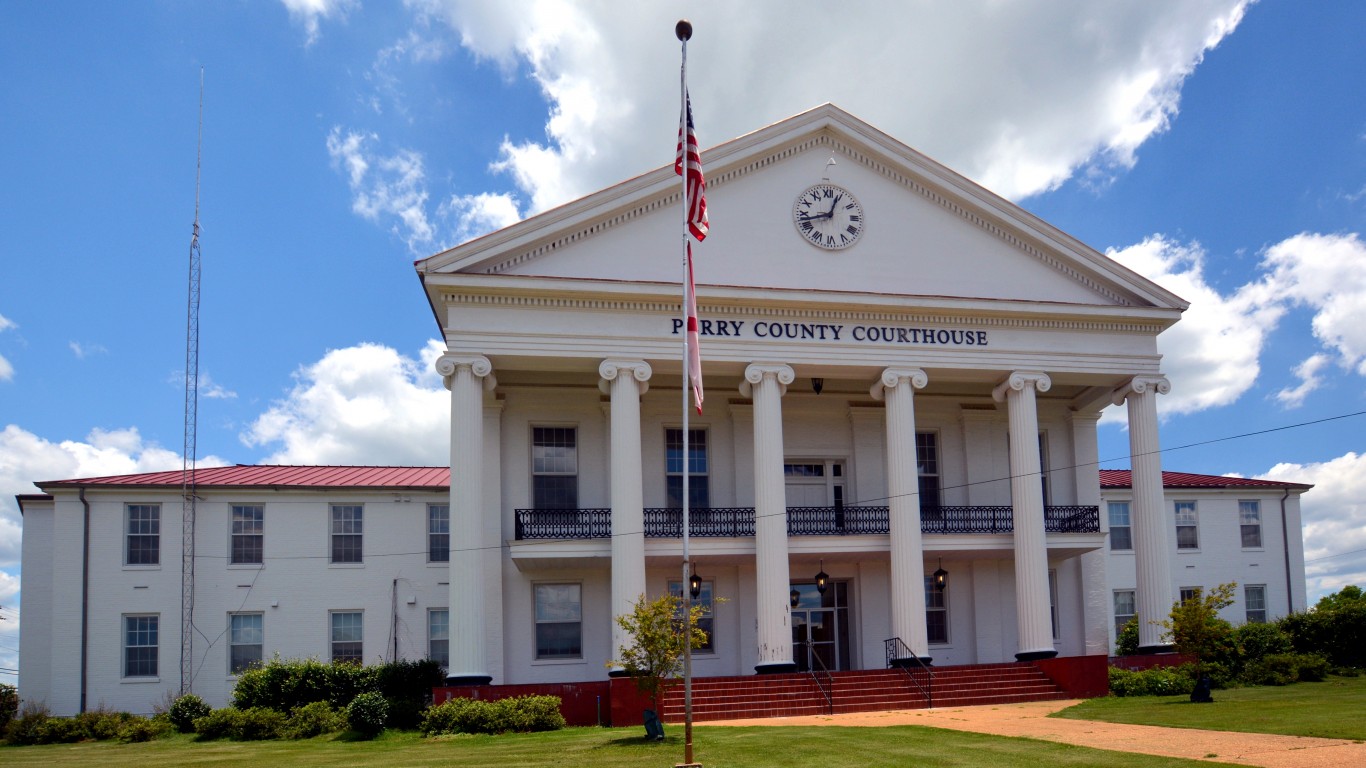
- Avg. life expectancy at birth: 70.8 years (7.7 years below U.S. avg.)
- Poverty rate: 32.8% (20.3 ppt. above U.S. avg.)
- Adults with a bachelor’s degree: 15.2% (19.1 ppt. below U.S. avg.)
- Median household income: $32,332 ($42,817 less than U.S. median)
- Population: 8,479
- County seat: Marion
34. Bienville Parish, Louisiana
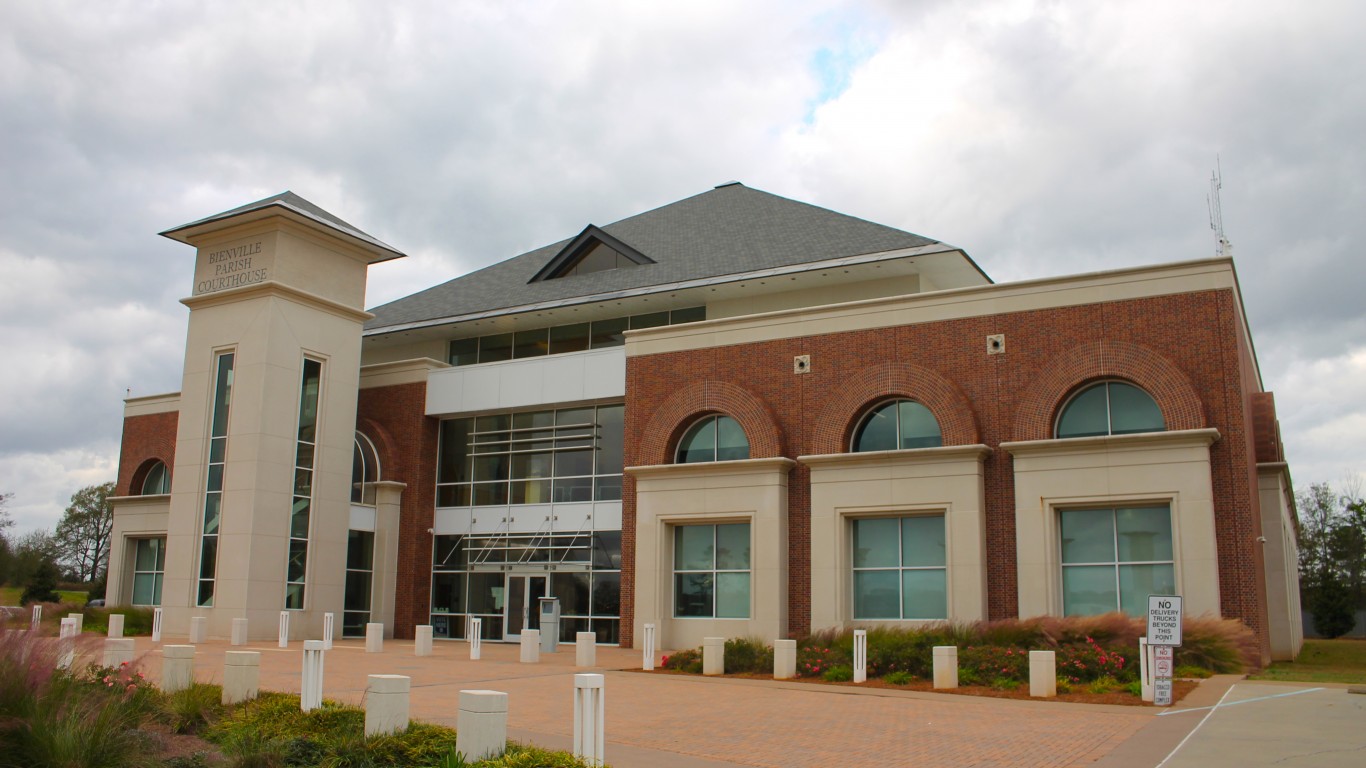
- Avg. life expectancy at birth: 70.9 years (7.6 years below U.S. avg.)
- Poverty rate: 31.1% (18.5 ppt. above U.S. avg.)
- Adults with a bachelor’s degree: 12.4% (21.9 ppt. below U.S. avg.)
- Median household income: $34,268 ($40,881 less than U.S. median)
- Population: 12,958
- County seat: Arcadia
33. Tunica County, Mississippi
- Avg. life expectancy at birth: 68.0 years (10.5 years below U.S. avg.)
- Poverty rate: 31.4% (18.8 ppt. above U.S. avg.)
- Adults with a bachelor’s degree: 16.9% (17.4 ppt. below U.S. avg.)
- Median household income: $41,676 ($33,473 less than U.S. median)
- Population: 9,787
- County seat: Tunica
32. Magoffin County, Kentucky

- Avg. life expectancy at birth: 71.2 years (7.4 years below U.S. avg.)
- Poverty rate: 30.4% (17.9 ppt. above U.S. avg.)
- Adults with a bachelor’s degree: 10.9% (23.4 ppt. below U.S. avg.)
- Median household income: $31,927 ($43,222 less than U.S. median)
- Population: 11,647
- County seat: Salyersville
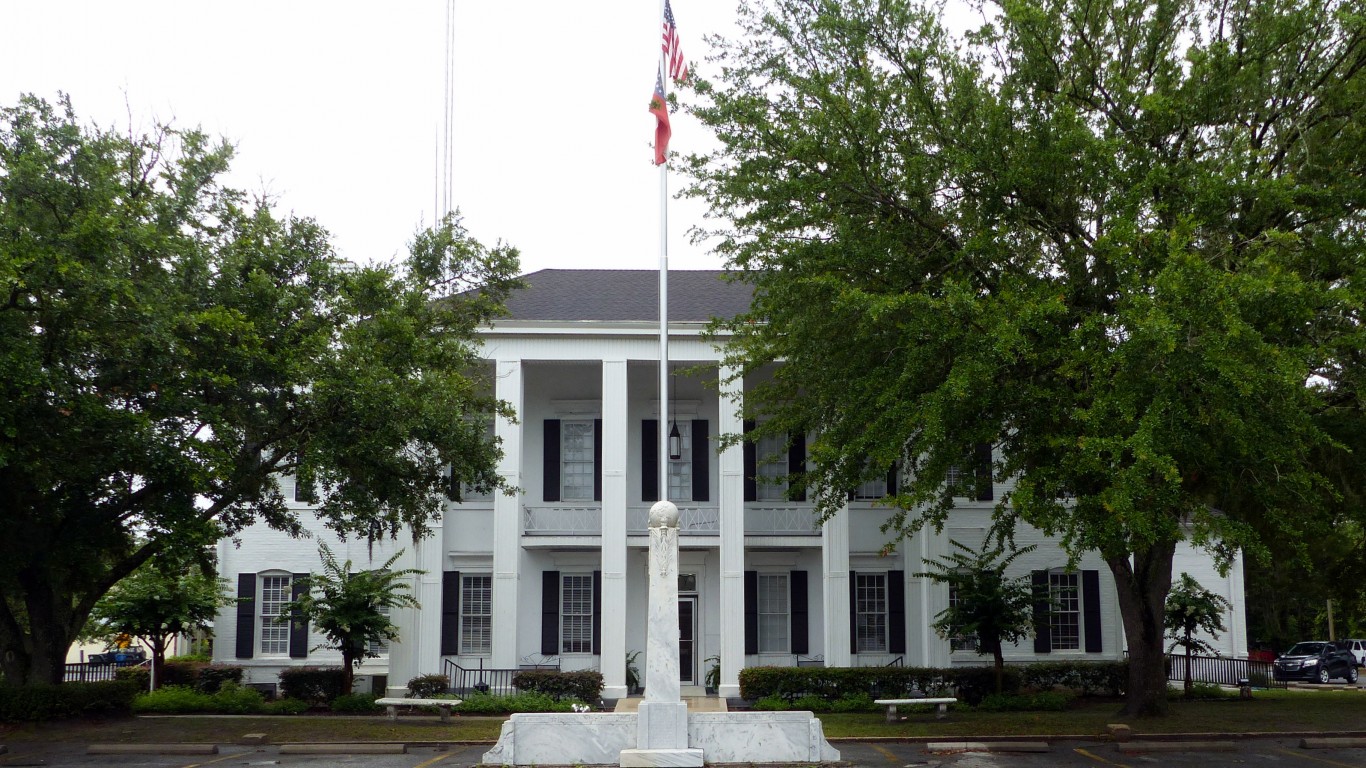
31. Clinch County, Georgia
- Avg. life expectancy at birth: 71.6 years (7.0 years below U.S. avg.)
- Poverty rate: 32.5% (19.9 ppt. above U.S. avg.)
- Adults with a bachelor’s degree: 12.9% (21.4 ppt. below U.S. avg.)
- Median household income: $53,350 ($21,799 less than U.S. median)
- Population: 6,713
- County seat: Homerville
30. Tensas Parish, Louisiana

- Avg. life expectancy at birth: 73.1 years (5.4 years below U.S. avg.)
- Poverty rate: 35.1% (22.5 ppt. above U.S. avg.)
- Adults with a bachelor’s degree: 14.2% (20.1 ppt. below U.S. avg.)
- Median household income: $35,653 ($39,496 less than U.S. median)
- Population: 4,127
- County seat: St. Joseph
29. Mingo County, West Virginia

- Avg. life expectancy at birth: 70.1 years (8.5 years below U.S. avg.)
- Poverty rate: 28.6% (16.1 ppt. above U.S. avg.)
- Adults with a bachelor’s degree: 9.6% (24.8 ppt. below U.S. avg.)
- Median household income: $38,305 ($36,844 less than U.S. median)
- Population: 23,466
- County seat: Williamson
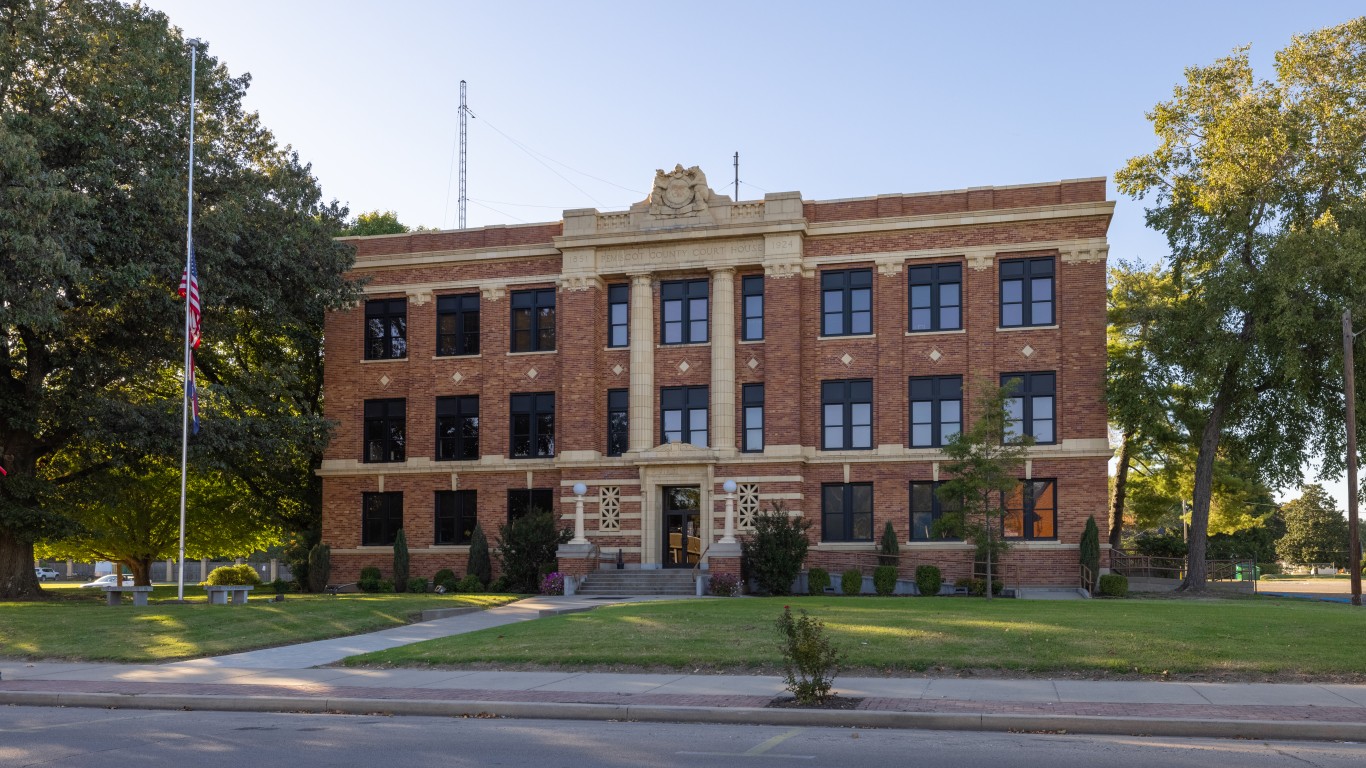
28. Pemiscot County, Missouri
- Avg. life expectancy at birth: 69.1 years (9.4 years below U.S. avg.)
- Poverty rate: 29.3% (16.7 ppt. above U.S. avg.)
- Adults with a bachelor’s degree: 11.6% (22.7 ppt. below U.S. avg.)
- Median household income: $37,426 ($37,723 less than U.S. median)
- Population: 15,555
- County seat: Caruthersville
27. Jackson County, South Dakota

- Avg. life expectancy at birth: 75.1 years (3.5 years below U.S. avg.)
- Poverty rate: 38.4% (25.9 ppt. above U.S. avg.)
- Adults with a bachelor’s degree: 15.6% (18.7 ppt. below U.S. avg.)
- Median household income: $26,078 ($49,071 less than U.S. median)
- Population: 2,838
- County seat: Kadoka
26. Apache County, Arizona

- Avg. life expectancy at birth: 70.1 years (8.4 years below U.S. avg.)
- Poverty rate: 32.5% (20.0 ppt. above U.S. avg.)
- Adults with a bachelor’s degree: 13.8% (20.5 ppt. below U.S. avg.)
- Median household income: $37,483 ($37,666 less than U.S. median)
- Population: 66,054
- County seat: St. Johns
25. Dillon County, South Carolina

- Avg. life expectancy at birth: 70.6 years (8.0 years below U.S. avg.)
- Poverty rate: 31.6% (19.1 ppt. above U.S. avg.)
- Adults with a bachelor’s degree: 11.9% (22.4 ppt. below U.S. avg.)
- Median household income: $42,454 ($32,695 less than U.S. median)
- Population: 28,255
- County seat: Dillon
24. Dewey County, South Dakota

- Avg. life expectancy at birth: 65.3 years (13.3 years below U.S. avg.)
- Poverty rate: 30.9% (18.4 ppt. above U.S. avg.)
- Adults with a bachelor’s degree: 17.9% (16.4 ppt. below U.S. avg.)
- Median household income: $55,077 ($20,072 less than U.S. median)
- Population: 5,275
- County seat: Timber Lake
23. Roosevelt County, Montana

- Avg. life expectancy at birth: 64.5 years (14.1 years below U.S. avg.)
- Poverty rate: 31.5% (19.0 ppt. above U.S. avg.)
- Adults with a bachelor’s degree: 19.8% (14.5 ppt. below U.S. avg.)
- Median household income: $51,038 ($24,111 less than U.S. median)
- Population: 10,799
- County seat: Wolf Point
22. Hancock County, Tennessee

- Avg. life expectancy at birth: 71.8 years (6.7 years below U.S. avg.)
- Poverty rate: 32.3% (19.8 ppt. above U.S. avg.)
- Adults with a bachelor’s degree: 9.9% (24.4 ppt. below U.S. avg.)
- Median household income: $31,809 ($43,340 less than U.S. median)
- Population: 6,726
- County seat: Sneedville
21. Ziebach County, South Dakota

- Avg. life expectancy at birth: 76.9 years (1.7 years below U.S. avg.)
- Poverty rate: 41.3% (28.8 ppt. above U.S. avg.)
- Adults with a bachelor’s degree: 14.9% (19.4 ppt. below U.S. avg.)
- Median household income: $46,023 ($29,126 less than U.S. median)
- Population: 2,455
- County seat: Dupree
20. Harlan County, Kentucky

- Avg. life expectancy at birth: 69.1 years (9.5 years below U.S. avg.)
- Poverty rate: 30.0% (17.5 ppt. above U.S. avg.)
- Adults with a bachelor’s degree: 10.5% (23.8 ppt. below U.S. avg.)
- Median household income: $35,128 ($40,021 less than U.S. median)
- Population: 26,589
- County seat: Harlan
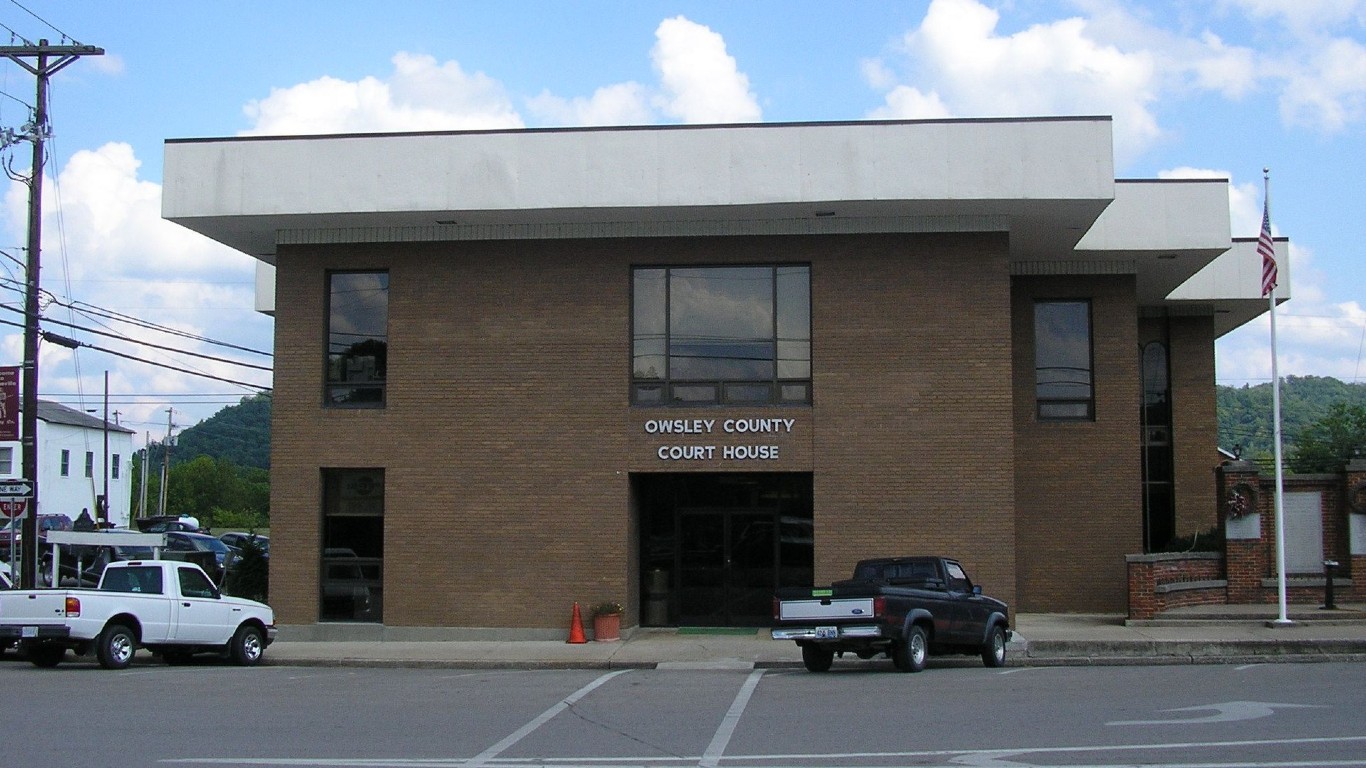
19. Owsley County, Kentucky
- Avg. life expectancy at birth: 67.4 years (11.2 years below U.S. avg.)
- Poverty rate: 28.8% (16.3 ppt. above U.S. avg.)
- Adults with a bachelor’s degree: 11.1% (23.2 ppt. below U.S. avg.)
- Median household income: $32,844 ($42,305 less than U.S. median)
- Population: 4,054
- County seat: Booneville
18. Coahoma County, Mississippi

- Avg. life expectancy at birth: 68.6 years (10.0 years below U.S. avg.)
- Poverty rate: 37.0% (24.4 ppt. above U.S. avg.)
- Adults with a bachelor’s degree: 20.0% (14.3 ppt. below U.S. avg.)
- Median household income: $36,075 ($39,074 less than U.S. median)
- Population: 21,264
- County seat: Clarksdale
17. Leslie County, Kentucky

- Avg. life expectancy at birth: 70.3 years (8.2 years below U.S. avg.)
- Poverty rate: 33.6% (21.1 ppt. above U.S. avg.)
- Adults with a bachelor’s degree: 11.6% (22.8 ppt. below U.S. avg.)
- Median household income: $37,019 ($38,130 less than U.S. median)
- Population: 10,468
- County seat: Hyden
16. Holmes County, Mississippi
- Avg. life expectancy at birth: 69.0 years (9.5 years below U.S. avg.)
- Poverty rate: 35.0% (22.4 ppt. above U.S. avg.)
- Adults with a bachelor’s degree: 14.7% (19.6 ppt. below U.S. avg.)
- Median household income: $28,818 ($46,331 less than U.S. median)
- Population: 16,848
- County seat: Lexington
15. Madison Parish, Louisiana

- Avg. life expectancy at birth: 72.0 years (6.6 years below U.S. avg.)
- Poverty rate: 38.1% (25.6 ppt. above U.S. avg.)
- Adults with a bachelor’s degree: 14.0% (20.3 ppt. below U.S. avg.)
- Median household income: $34,508 ($40,641 less than U.S. median)
- Population: 10,028
- County seat: Tallulah
14. Dimmit County, Texas

- Avg. life expectancy at birth: 76.6 years (1.9 years below U.S. avg.)
- Poverty rate: 43.6% (31.0 ppt. above U.S. avg.)
- Adults with a bachelor’s degree: 14.6% (19.7 ppt. below U.S. avg.)
- Median household income: $27,374 ($47,775 less than U.S. median)
- Population: 8,672
- County seat: Carrizo Springs
13. McCreary County, Kentucky
- Avg. life expectancy at birth: 71.9 years (6.6 years below U.S. avg.)
- Poverty rate: 33.7% (21.1 ppt. above U.S. avg.)
- Adults with a bachelor’s degree: 6.8% (27.5 ppt. below U.S. avg.)
- Median household income: $35,000 ($40,149 less than U.S. median)
- Population: 16,892
- County seat: Whitley City
12. McKinley County, New Mexico

- Avg. life expectancy at birth: 67.9 years (10.6 years below U.S. avg.)
- Poverty rate: 33.6% (21.0 ppt. above U.S. avg.)
- Adults with a bachelor’s degree: 12.4% (21.9 ppt. below U.S. avg.)
- Median household income: $44,029 ($31,120 less than U.S. median)
- Population: 72,073
- County seat: Gallup
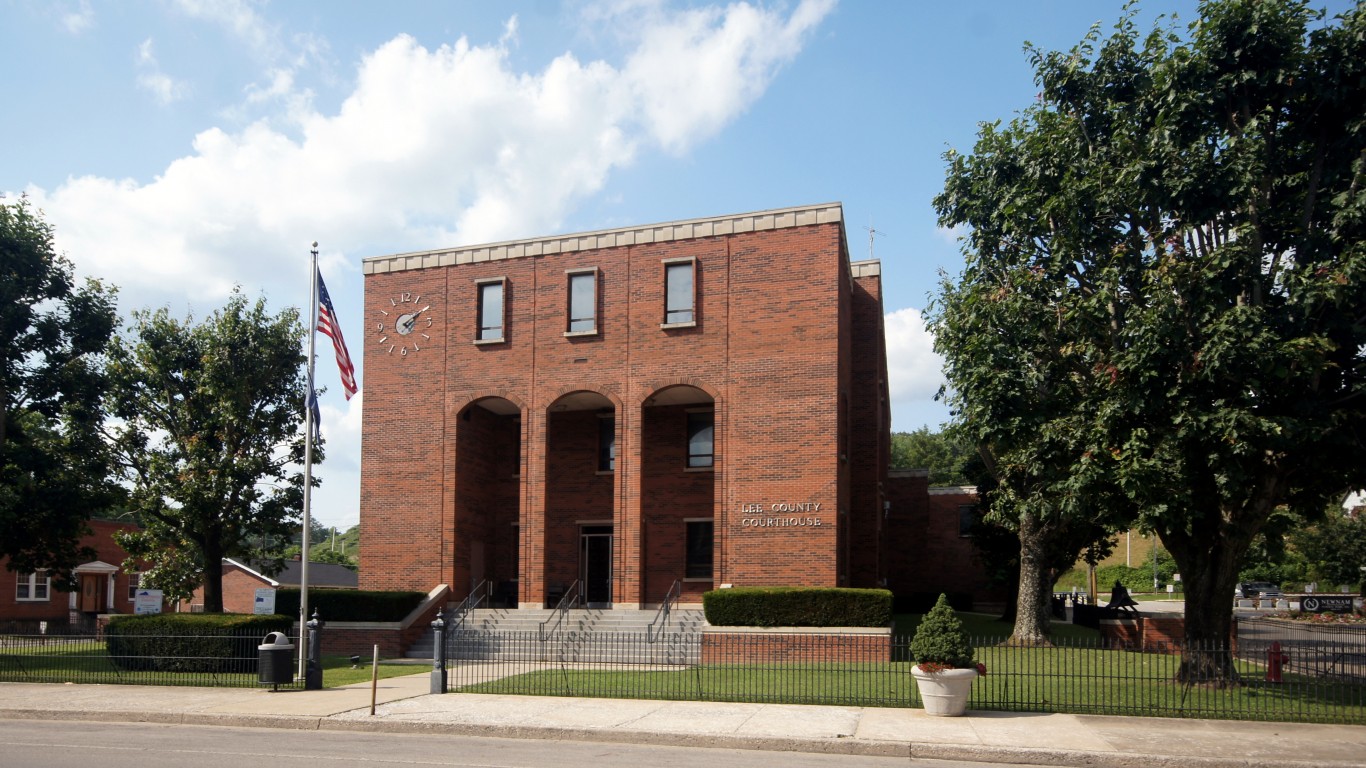
11. Lee County, Kentucky
- Avg. life expectancy at birth: 69.2 years (9.4 years below U.S. avg.)
- Poverty rate: 31.4% (18.8 ppt. above U.S. avg.)
- Adults with a bachelor’s degree: 7.3% (27.0 ppt. below U.S. avg.)
- Median household income: $31,682 ($43,467 less than U.S. median)
- Population: 7,338
- County seat: Beattyville
10. East Carroll Parish, Louisiana

- Avg. life expectancy at birth: 71.3 years (7.3 years below U.S. avg.)
- Poverty rate: 40.3% (27.7 ppt. above U.S. avg.)
- Adults with a bachelor’s degree: 11.8% (22.5 ppt. below U.S. avg.)
- Median household income: $30,856 ($44,293 less than U.S. median)
- Population: 7,371
- County seat: Lake Providence
9. McDowell County, West Virginia

- Avg. life expectancy at birth: 67.7 years (10.9 years below U.S. avg.)
- Poverty rate: 33.3% (20.7 ppt. above U.S. avg.)
- Adults with a bachelor’s degree: 6.6% (27.7 ppt. below U.S. avg.)
- Median household income: $28,235 ($46,914 less than U.S. median)
- Population: 18,911
- County seat: Welch
8. Kusilvak Census Area, Alaska

- Avg. life expectancy at birth: 67.7 years (10.8 years below U.S. avg.)
- Poverty rate: 34.3% (21.7 ppt. above U.S. avg.)
- Adults with a bachelor’s degree: 4.6% (29.7 ppt. below U.S. avg.)
- Median household income: $42,663 ($32,486 less than U.S. median)
- Population: 8,372
- County seat: N/A
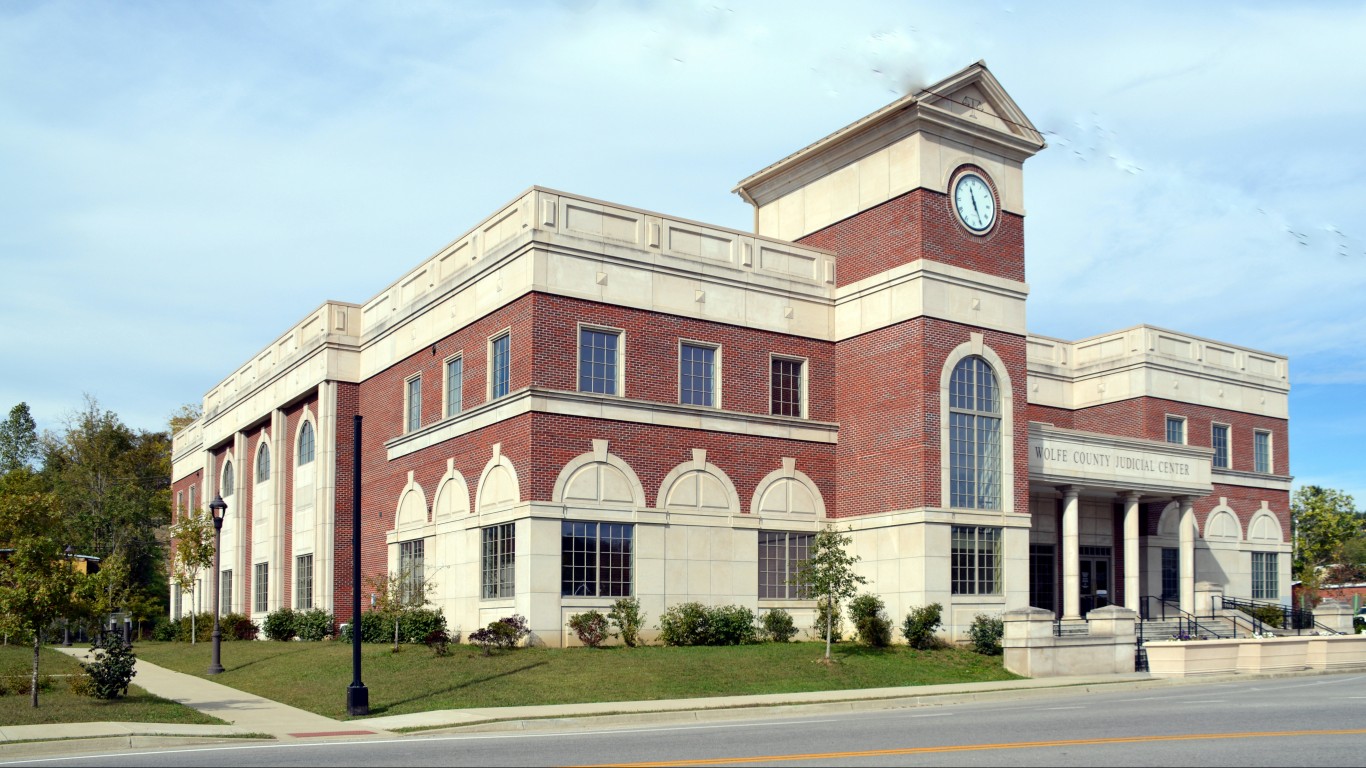
7. Wolfe County, Kentucky
- Avg. life expectancy at birth: 68.0 years (10.6 years below U.S. avg.)
- Poverty rate: 36.8% (24.2 ppt. above U.S. avg.)
- Adults with a bachelor’s degree: 7.0% (27.3 ppt. below U.S. avg.)
- Median household income: $28,666 ($46,483 less than U.S. median)
- Population: 6,573
- County seat: Campton
6. Sioux County, North Dakota
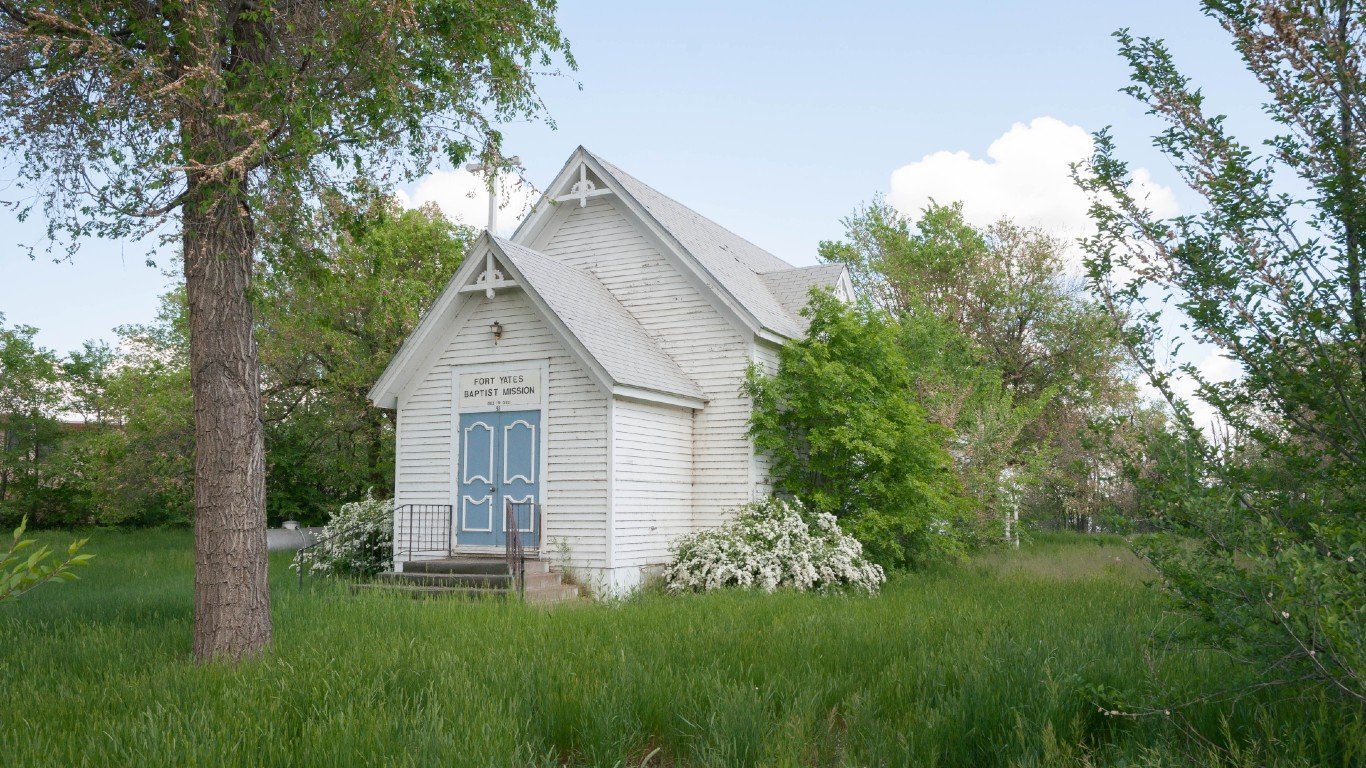
- Avg. life expectancy at birth: 65.2 years (13.3 years below U.S. avg.)
- Poverty rate: 39.7% (27.2 ppt. above U.S. avg.)
- Adults with a bachelor’s degree: 11.5% (22.8 ppt. below U.S. avg.)
- Median household income: $41,201 ($33,948 less than U.S. median)
- Population: 3,896
- County seat: Fort Yates
5. Corson County, South Dakota

- Avg. life expectancy at birth: 64.1 years (14.4 years below U.S. avg.)
- Poverty rate: 43.4% (30.9 ppt. above U.S. avg.)
- Adults with a bachelor’s degree: 17.2% (17.2 ppt. below U.S. avg.)
- Median household income: $48,125 ($27,024 less than U.S. median)
- Population: 3,906
- County seat: McIntosh
4. Buffalo County, South Dakota

- Avg. life expectancy at birth: 61.1 years (17.5 years below U.S. avg.)
- Poverty rate: 36.5% (24.0 ppt. above U.S. avg.)
- Adults with a bachelor’s degree: 6.8% (27.5 ppt. below U.S. avg.)
- Median household income: $42,917 ($32,232 less than U.S. median)
- Population: 1,859
- County seat: Gann Valley
3. Mellette County, South Dakota

- Avg. life expectancy at birth: 68.3 years (10.2 years below U.S. avg.)
- Poverty rate: 49.1% (36.6 ppt. above U.S. avg.)
- Adults with a bachelor’s degree: 11.9% (22.4 ppt. below U.S. avg.)
- Median household income: $41,397 ($33,752 less than U.S. median)
- Population: 1,989
- County seat: White River
2. Todd County, South Dakota

- Avg. life expectancy at birth: 64.6 years (13.9 years below U.S. avg.)
- Poverty rate: 52.2% (39.7 ppt. above U.S. avg.)
- Adults with a bachelor’s degree: 14.7% (19.6 ppt. below U.S. avg.)
- Median household income: $33,792 ($41,357 less than U.S. median)
- Population: 9,353
- County seat: N/A
1. Oglala Lakota County, South Dakota
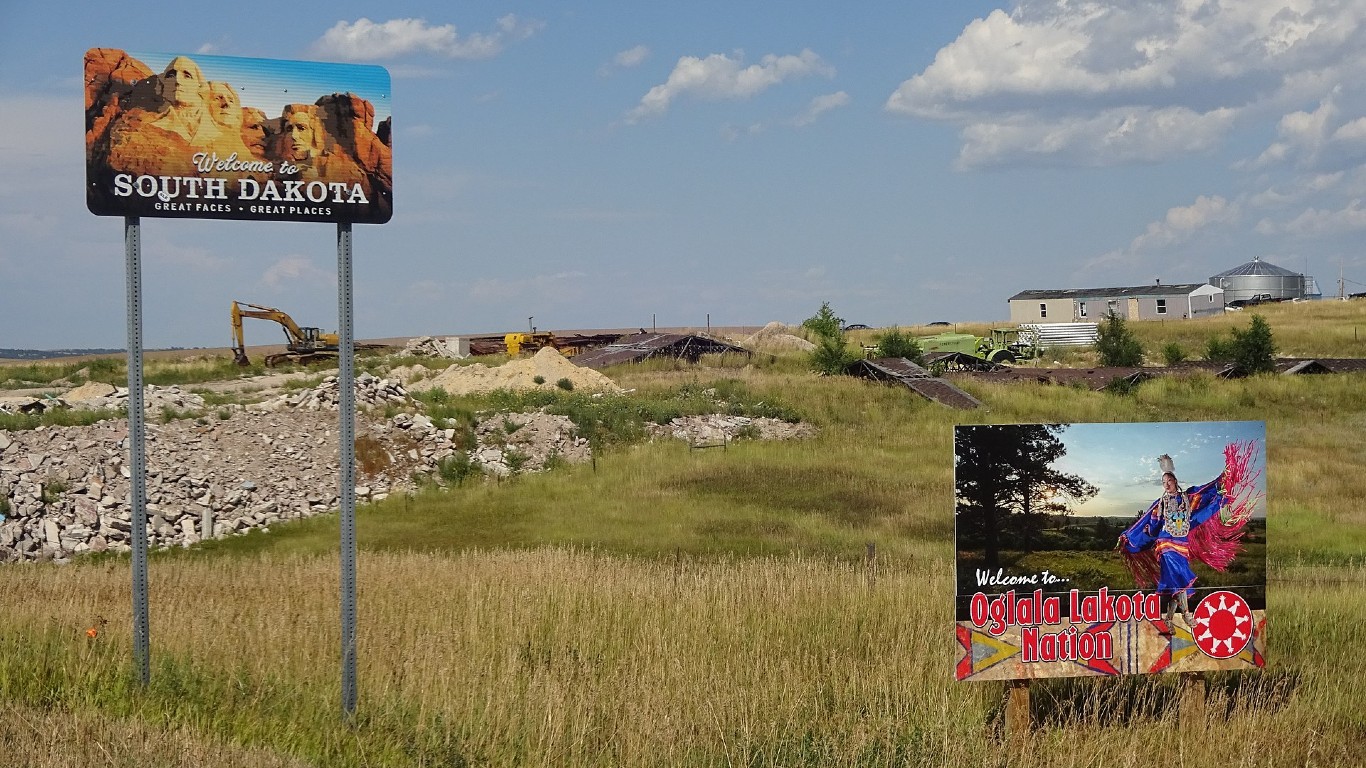
- Avg. life expectancy at birth: 62.8 years (15.7 years below U.S. avg.)
- Poverty rate: 55.8% (43.2 ppt. above U.S. avg.)
- Adults with a bachelor’s degree: 8.1% (26.2 ppt. below U.S. avg.)
- Median household income: $32,279 ($42,870 less than U.S. median)
- Population: 13,695
- County seat: N/A
Buffett Missed These Two…
Warren Buffett loves dividend stocks, and has stuffed Berkshire with some of his favorites.
But he overlooked two dividend legends that continue to print checks on a new level, they’re nowhere in his portfolio.
Unlock the two dividend legends Buffett missed in this new free report.
The post America’s Worst Counties to Live In appeared first on 24/7 Wall St..