The United States faces a significant wealth gap between upper-income households and the majority of Americans. Additionally, racial inequality continues to affect Black Americans due to many years of unfair laws and policies, such as Jim Crow laws and housing discrimination. Despite the Fair Housing Act of 1968, which banned discrimination in the sale, rental, and financing of houses, longstanding practices have resulted in inequality that endures today. Unsurprisingly, some states in the U.S. have higher gaps in racial disparity than other locations.
The problem of economic inequality for Black Americans is rooted in more than just differences in income and higher rates of poverty. Other contributing factors include disparities in employment, housing, education, rates of incarceration, and many more.
24/7 Wall St. took a deep dive into the data to assess race-based gaps in eight measures: poverty rate, median household income, rate of homeownership, incarceration rate by race, age-adjusted mortality rate by race, adult high school and bachelor’s degree attainment rates, unemployment rate, poverty rate, and median household income. The index examines the gaps between Black Americans and white state residents regarding these measures.
Nationwide, Black households earn $50,901 annually, or just 63.6% of the $80,042 income white households earn a year. Similarly, Black Americans are more than twice as likely to live below the poverty line (21.5% vs. 10.1%) or be unemployed (9.2% vs. 4.6%) as white Americans and are nearly five times as likely to be incarcerated (1,020.4 per 100,000 Black Americans vs 217.7 per 100,000 white Americans).
In 18 states, Black households earn even less than 63.6% of white households, including in all 10 worst states for Black Americans. In Wisconsin, the Black median household income is just 51.1% of the white median household income — the largest income disparity of any state. And while the poverty rate for white Americans is lower than 10% in 23 states, this is true for Black Americans in only one state, Hawaii.
Many of the lowest ranking states on the list are in the Midwest, where millions of Black Americans moved during the Great Migration of the early 20th century. But redlining — a discriminatory practice of designating neighborhoods as high risk because of race, thus denying residents loans — created segregated neighborhoods, enforcing racial disparity. To this day, the gap in homeownership rates in the worst states for Black Americans is significantly higher than the 28 points gap nationwide (71.7% white homeownership rate vs 43.1% for Blacks). In Minnesota, for example, the gap is 48.4 points. (Also see: America’s Most Diverse Neighborhoods.)
Full Methodology
To determine the worst states for Black Americans, 24/7 Wall St. created an index consisting of eight measures to assess race-based gaps in socioeconomic outcomes. Six of the measures – median household income, poverty, adult high school and bachelor’s degree attainment, homeownership, and unemployment rates – are based on five-year estimates from the U.S. Census Bureau’s 2022 American Community. The seventh measure, prisoners under the jurisdiction of state or federal correctional authorities by race per 100,000 residents, is based on Bureau of Justice Statistics data for 2021. The eighth measure, age-adjusted mortality rate by race, is based on data from 2018 to 2020 from the Centers for Disease Control and Prevention.
For each measure, we constructed an index from the gaps between Black and white Americans. The index was standardized using min-max normalization. Data on population by race came from the ACS.
Why This Matters

New policies continue to address the issues of racial inequality and disparity in the United States. However, years of unfair treatment have created pervasive problems that are difficult to undo. By increasing awareness of the issues by looking at facts and figures, individuals and decision-makers can understand the need for change.
50. Hawaii

Hawaii tops the list with the least amount of racial disparity. The median household income is $80,207 for Black residents compared to white residents at $93,896. Homeownership values are 28.2% (Black) versus 57.7% (white), with the unemployment rate at 12.2% for Black Americans and 5.6% for white residents. Finally, the Black population is 26,664 (1.8% of total).
49. New Mexico

In New Mexico, the median household income is $48,987 for Black residents compared to $63,910 for white residents. Homeownership values are 37.8% (Black) versus 70.3% (white), with the unemployment rate at 9.0% for Black Americans and 6.0% for white residents. Finally, the Black population is 37,996 (1.8% of the total).
48. Texas

In Texas, the median household income is $55,459 for Black residents compared to $80,134 for white residents. Homeownership values are 41.3% (Black) versus 67.7% (white), with the unemployment rate at 8.4% for Black Americans and 4.6% for white residents. Finally, the Black population is 3,449,557 (11.8% of the total).
47. Alaska

In Alaska, the median household income is $71,857 for Black residents compared to $94,315 for white residents. Homeownership values are 40.9% (Black) versus 70.7% (white), with the unemployment rate at 4.6% for Black Americans and 5.1% for white residents. Finally, the Black population is 22,400 (3.0% of total).
46. Arizona

In Arizona, the median household income is $58,184 for Black residents compared to $75,939 for white residents. Homeownership values are 38.4% (Black) versus 70.3% (white), with the unemployment rate at 8.3% for Black Americans and 5.0% for white residents. Finally, the Black population is 22,400 307,726 (4.3% of total).
45. West Virginia

In West Virginia, the median household income is $38,004 for Black residents compared to $55,826 for white residents. Homeownership values are 44.5% (Black) versus 75.8% (white), with the unemployment rate at 9.8% for Black Americans and 6.2% for white residents. Finally, the Black population is 60,237 (3.4% of total).
44. Kentucky

In Kentucky, the median household income is $44,196 for Black residents compared to $62,242 for white residents. Homeownership values are 37.9% (Black) versus 72.1% (white), with the unemployment rate at 8.6% for Black Americans and 4.9% for white residents. Finally, the Black population is 355,368 (7.9% of total).
43. Georgia

In Georgia, the median household income is $55,010 for Black residents compared to $81,445 for white residents. Homeownership values are 49.0% (Black) versus 74.7% (white), with the unemployment rate at 8.2% for Black Americans and 4.1% for white residents. Finally, the Black population is 3,334,095 (31.1% of the total).
42. Idaho

In Idaho, the median household income is $54,727 for Black residents compared to $71,661 for white residents. Homeownership values are 36.9% (Black) versus 73.7% (white), with the unemployment rate at 6.7% for Black Americans and 3.9% for white residents. Finally, the Black population is 11,919 (0.6% of the total).
41. Oregon

In Oregon, the median household income is $56,124 for Black residents compared to $77,627 for white residents. Homeownership values are 33.9% (Black) versus 65.8% (white), with the unemployment rate at 6.7% for Black Americans and 5.5% for white residents. Finally, the Black population is 75,790 (1.8% of the total).
40. Maryland

In Maryland, the median household income is $79,161 for Black residents compared to $109,387 for white residents. Homeownership values are 52.5% (Black) versus 76.9% (white), with the unemployment rate at 7.8% for Black Americans and 4.0% for white residents. Finally, the Black population is 1,815,877 (29.5% of the total).
39. Delaware

In Delaware, the median household income is $58,385 for Black residents compared to $86,094 for white residents. Homeownership values are 51.5% (Black) versus 80.1% (white), with the unemployment rate at 8.0% for Black Americans and 4.9% for white residents. Finally, the Black population is 213,516 (21.5% of the total).
38. Wyoming

In Wyoming, the median household income is $56,046 for Black residents compared to $73,542 for white residents. Homeownership values are 38.2% (Black) versus 73.0% (white), with the unemployment rate at 11.0% for Black Americans and 3.8% for white residents. Finally, the Black population is 4,488 (0.8% of the total).
37. Tennessee

In Tennessee, the median household income is $46,708 for Black residents compared to $68,515 for white residents. Homeownership values are 43.6% (Black) versus 73.1% (white), with the unemployment rate at 9.4% for Black Americans and 4.4% for white residents. Finally, the Black population is 1,116,871 (16.1% of the total).
36. Florida

In Florida, the median household income is $51,249 for Black residents compared to $72,212 for white residents. Homeownership values are 47.6% (Black) versus 72.9% (white), with the unemployment rate at 8.1% for Black Americans and 4.6% for white residents. Finally, the Black population is 3,232,871 (14.9% of the total).
35. New Hampshire

In New Hampshire, the median household income is $72,946 for Black residents compared to $91,394 for white residents. Homeownership values are 36.2% (Black) versus 74.0% (white), with the unemployment rate at 7.6% for Black Americans and 3.7% for white residents. Finally, the Black population is 18,477 (1.3% of the total).
34. Washington

In Washington, the median household income is $65,817 for Black residents compared to $91,601 for white residents. Homeownership values are 34.0% (Black) versus 67.7% (white), with the unemployment rate at 8.1% for Black Americans and 4.8% for white residents. Finally, the Black population is 290,907 (3.8% of the total).
33. Rhode Island

In Rhode Island, the median household income is $61,614 for Black residents compared to $86,467 for white residents. Homeownership values are 35.1% (Black) versus 68.3% (white), with the unemployment rate at 8.2% for Black Americans and 5.3% for white residents. Finally, the Black population is 58,304 (5.3% of the total).
32. Oklahoma

In Oklahoma, the median household income is $42,145 for Black residents compared to $65,469 for white residents. Homeownership values are 39.8% (Black) versus 70.1% (white), with the unemployment rate at 8.9% for Black Americans and 4.4% for white residents. Finally, the Black population is 277,702 (7.0% of the total).
31. North Carolina

In North Carolina, the median household income is $47,088 for Black residents compared to $73,675 for white residents. Homeownership values are 46.3% (Black) versus 73.7% (white), with the unemployment rate at 8.3% for Black Americans and 4.3% for white residents. Finally, the Black population is 2,161,841 (20.6% of the total).
30. Virginia

In Virginia, the median household income is $60,201 for Black residents compared to $93,691 for white residents. Homeownership values are 48.6% (Black) versus 73.1% (white), with the unemployment rate at 7.2% for Black Americans and 3.8% for white residents. Finally, the Black population is 1,601,668 (18.6% of the total).
29. South Dakota

In South Dakota, the median household income is $56,399 for Black residents compared to $72,498 for white residents. Homeownership values are 25.6% (Black) versus 72.2% (white), with the unemployment rate at 3.4% for Black Americans and 2.3% for white residents. Finally, the Black population is 19,172 (2.2% of the total).
28. Alabama
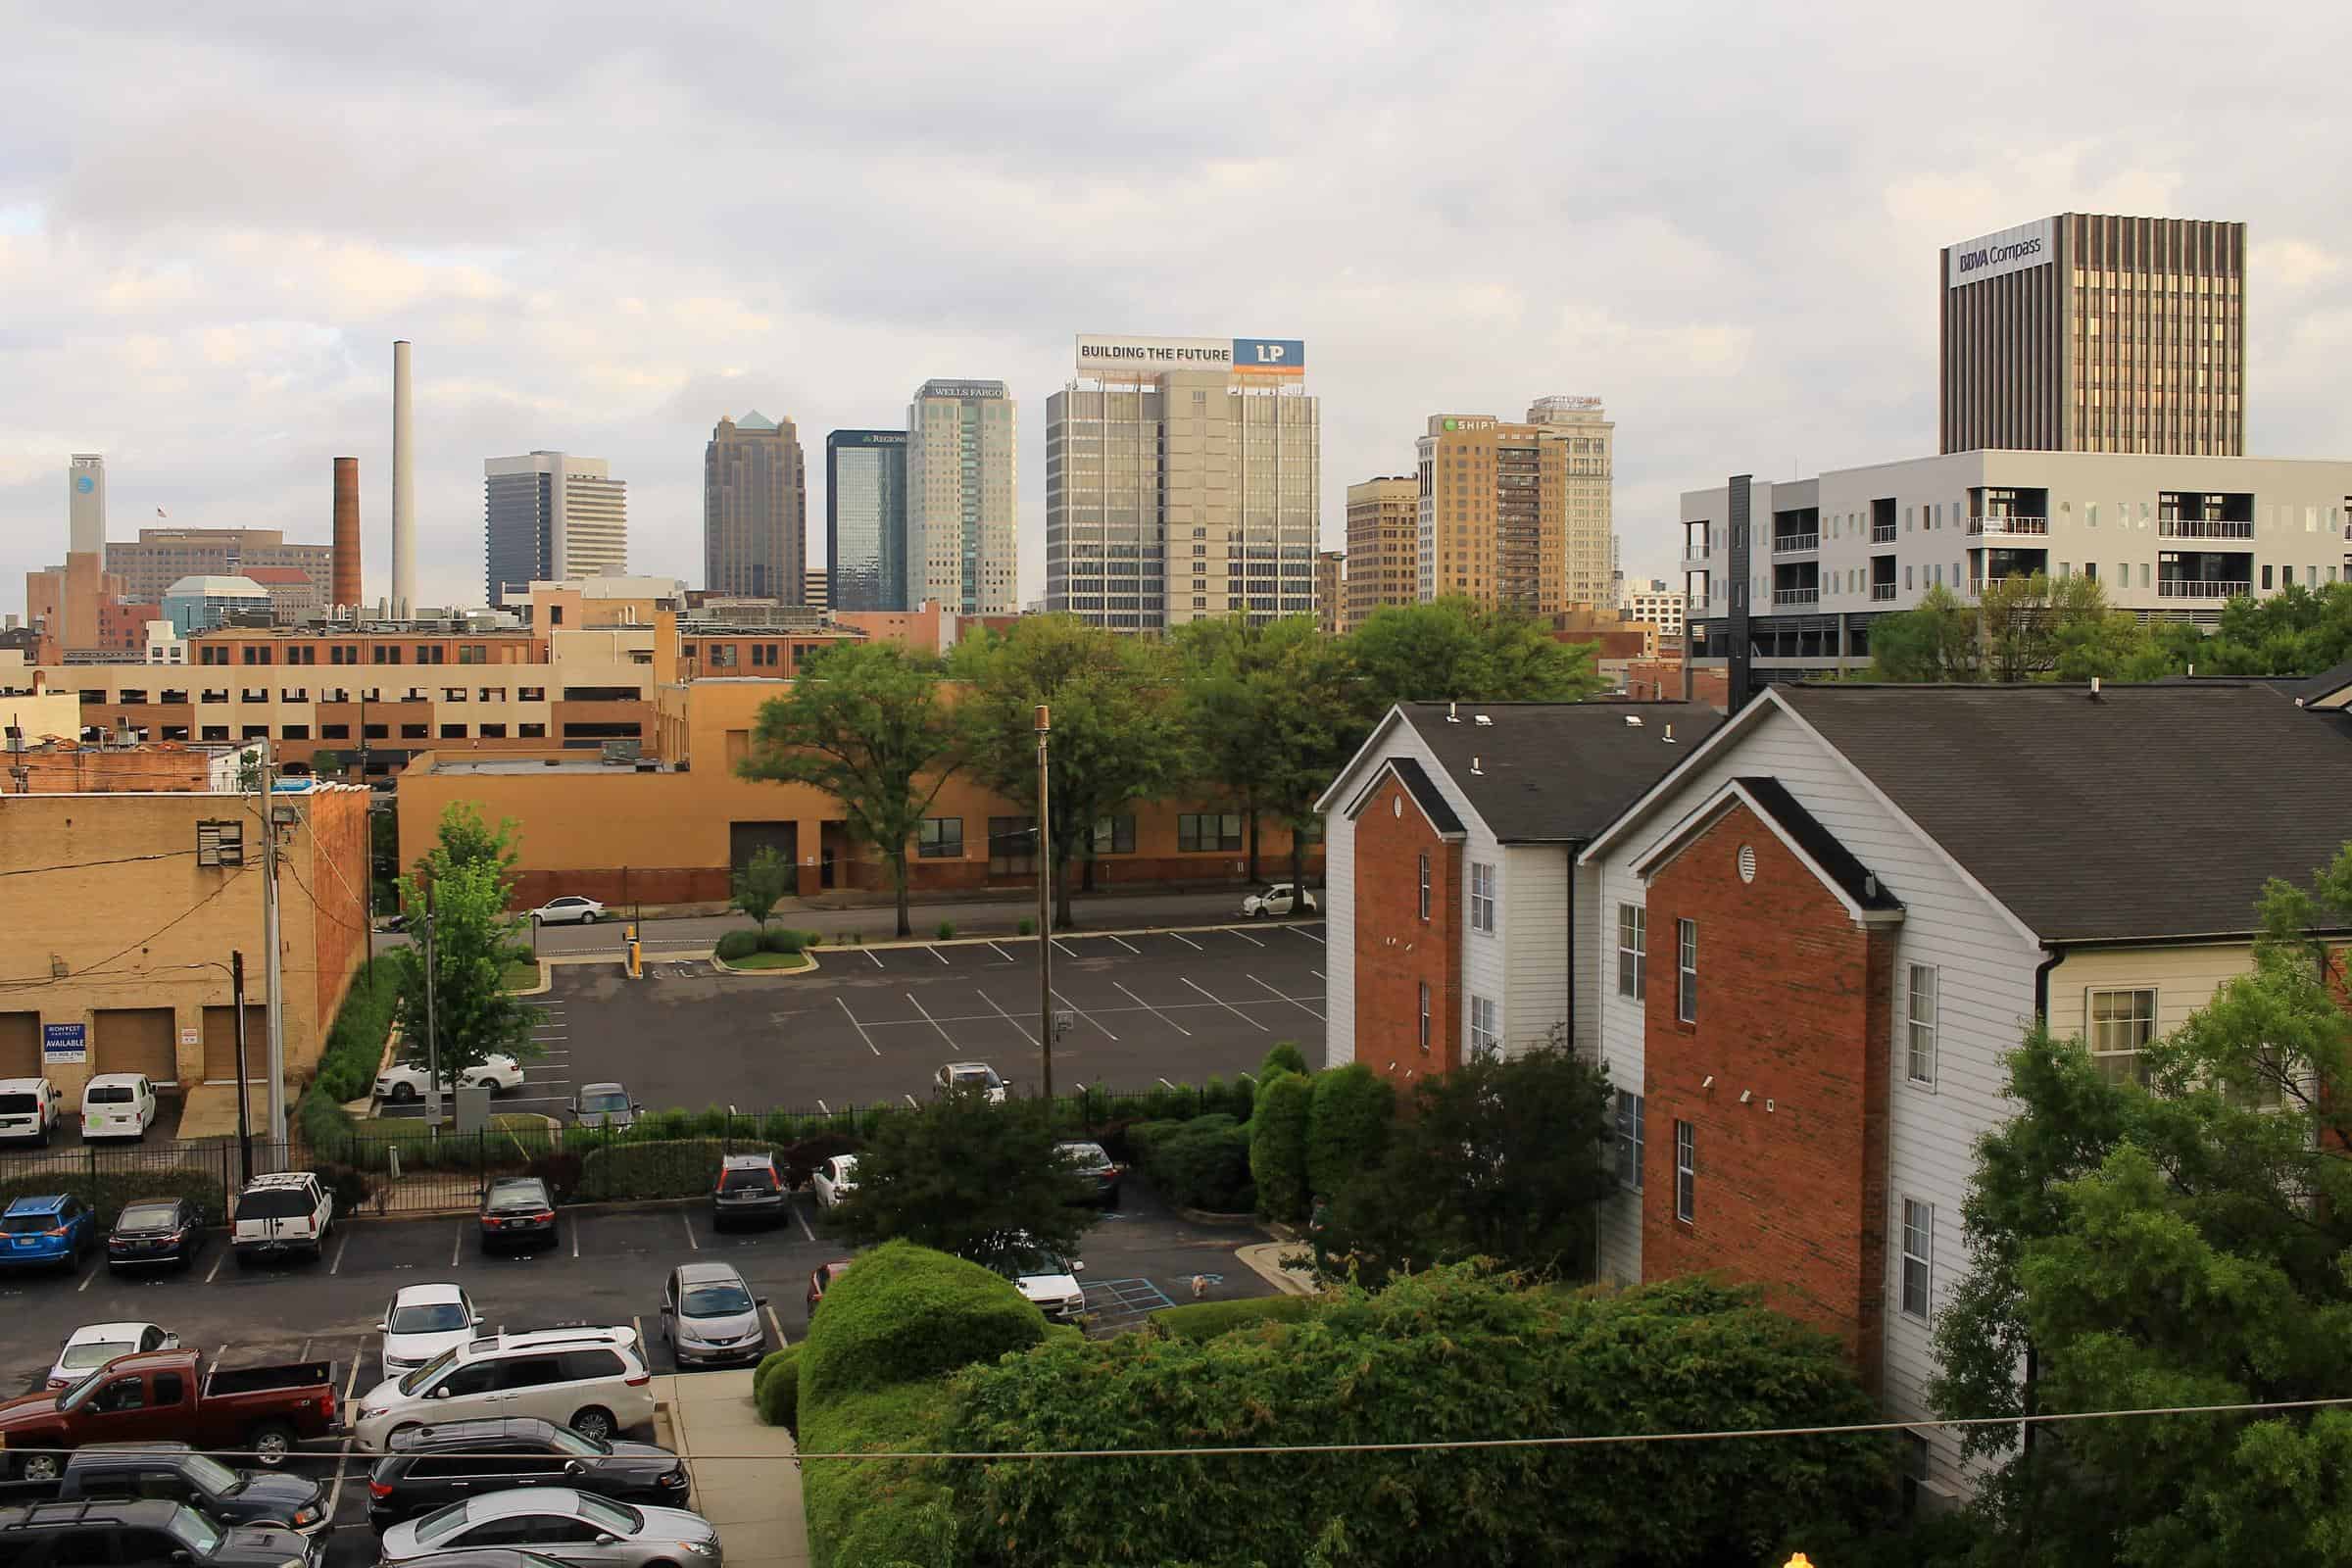
In Alabama, the median household income is $40,661 for Black residents compared to $69,042 for white residents. Homeownership values are 51.3% (Black) versus 77.4% (white), with the unemployment rate at 8.9% for Black Americans and 4.1% for white residents. Finally, the Black population is 1,318,388 (26.2% of the total).
27. California
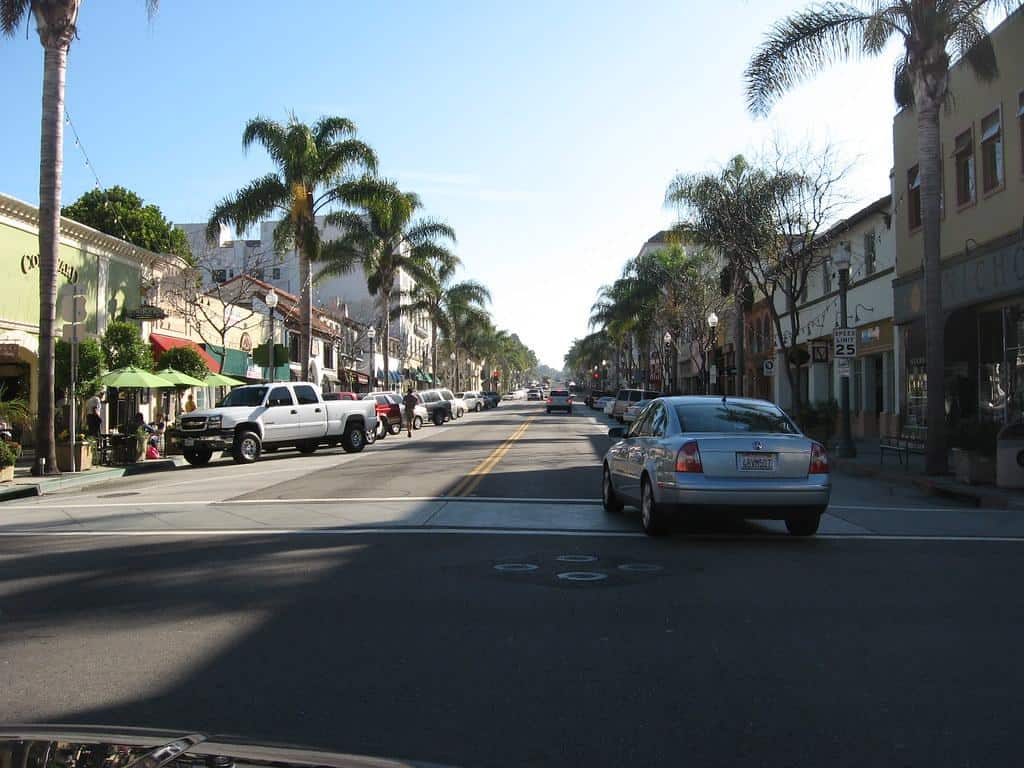
In California, the median household income is $64,513 for Black residents compared to $97,859 for white residents. Homeownership values are 35.6% (Black) versus 60.7% (white), with the unemployment rate at 10.5% for Black Americans and 6.0% for white residents. Finally, the Black population is 2,102,510 (5.3% of the total).
26. Arkansas

In Arkansas, the median household income is $37,395 for Black residents compared to $60,756 for white residents. Homeownership values are 44.2% (Black) versus 71.9% (white), with the unemployment rate at 9.4% for Black Americans and 4.5% for white residents. Finally, the Black population is 454,728 (15.1% of the total).
25. Nevada

In Nevada, the median household income is $48,022 for Black residents compared to $77,786 for white residents. Homeownership values are 31.6% (Black) versus 64.4% (white), with the unemployment rate at 12.5% for Black Americans and 6.2% for white residents. Finally, the Black population is 278,689 (9.0% of the total).
24. Vermont

In Vermont, the median household income is $52,736 for Black residents compared to $74,499 for white residents. Homeownership values are 27.7% (Black) versus 74.0% (white), with the unemployment rate at 6.4% for Black Americans and 3.8% for white residents. Finally, the Black population is 7,548 (1.2% of the total).
23. Maine

In Maine, the median household income is $53,407 for Black residents compared to $68,783 for white residents. Homeownership values are 25.9% (Black) versus 74.4% (white), with the unemployment rate at 5.6% for Black Americans and 4.2% for white residents. Finally, the Black population is 21,093 (1.5% of the total).
22. Colorado

In Colorado, the median household income is $61,343 for Black residents compared to $91,475 for white residents. Homeownership values are 41.8% (Black) versus 69.1% (white), with the unemployment rate at 7.8% for Black Americans and 4.2% for white residents. Finally, the Black population is 221,211 (3.8% of the total).
21. Missouri

In Missouri, the median household income is $44,293 for Black residents compared to $69,547 for white residents. Homeownership values are 39.3% (Black) versus 72.4% (white), with the unemployment rate at 8.2% for Black Americans and 3.9% for white residents. Finally, the Black population is 688,219 (11.2% of the total).
20. Mississippi

In Mississippi, the median household income is $36,263 for Black residents compared to $65,518 for white residents. Homeownership values are 54.4% (Black) versus 78.7% (white), with the unemployment rate at 10.0% for Black Americans and 4.9% for white residents. Finally, the Black population is 1,098,675 (37.1% of the total).
19. South Carolina

In South Carolina, the median household income is $42,672 for Black residents compared to $73,204 for white residents. Homeownership values are 53.5% (Black) versus 78.4% (white), with the unemployment rate at 7.9% for Black Americans and 4.3% for white residents. Finally, the Black population is 1,316,074 (25.6% of the total).
18. Massachusetts
In Massachusetts, the median household income is $67,044 for Black residents compared to $102,701 for white residents. Homeownership values are 36.4% (Black) versus 68.5% (white), with the unemployment rate at 8.4% for Black Americans and 4.7% for white residents. Finally, the Black population is 459,848 (6.6% of the total).
17. Indiana

In Indiana, the median household income is $42,067 for Black residents compared to $70,740 for white residents. Homeownership values are 38.0% (Black) versus 74.9% (white), with the unemployment rate at 9.9% for Black Americans and 4.1% for white residents. Finally, the Black population is 631,919 (9.3% of the total).
16. Montana

In Montana, the median household income is $50,676 for Black residents compared to $68,005 for white residents. Homeownership values are 27.4% (Black) versus 70.7% (white), with the unemployment rate at 11.7% for Black Americans and 3.3% for white residents. Finally, the Black population is 5,248 (0.5% of the total).
15. New York

In New York, the median household income is $58,805 for Black residents compared to $90,866 for white residents. Homeownership values are 32.7% (Black) versus 64.7% (white), with the unemployment rate at 9.2% for Black Americans and 5.0% for white residents. Finally, the Black population is 2,767,223 (13.8% of the total).
14. Louisiana

In Louisiana, the median household income is $37,015 for Black residents compared to $70,270 for white residents. Homeownership values are 48.9% (Black) versus 76.9% (white), with the unemployment rate at 10.4% for Black Americans and 4.9% for white residents. Finally, the Black population is 1,456,107 (31.4% of the total).
13. North Dakota

In North Dakota, the median household income is $49,369 for Black residents compared to $77,950 for white residents. Homeownership values are 11.7% (Black) versus 67.3% (white), with the unemployment rate at 7.9% for Black Americans and 2.6% for white residents. Finally, the Black population is 24,882 (3.2% of the total).
12. Utah

In Utah, the median household income is $57,433 for Black residents compared to $89,462 for white residents. Homeownership values are 27.4% (Black) versus 73.2% (white), with the unemployment rate at 5.8% for Black Americans and 3.2% for white residents. Finally, the Black population is 34,485 (1.1% of the total).
11. Kansas

In Kansas, the median household income is $46,145 for Black residents compared to $72,357 for white residents. Homeownership values are 36.5% (Black) versus 70.2% (white), with the unemployment rate at 9.1% for Black Americans and 3.6% for white residents. Finally, the Black population is 157,768 (5.4% of the total).
10. Connecticut

In Connecticut, the median household income is $59,728 for Black residents compared to $98,855 for white residents. Homeownership values are 40.7% (Black) versus 73.5% (white), with the unemployment rate at 8.8% for Black Americans and 5.2% for white residents. Finally, the Black population is 355,970 (9.9% of the total).
9. New Jersey

In New Jersey, the median household income is $65,351 for Black residents compared to $105,392 for white residents. Homeownership values are 39.7% (Black) versus 73.3% (white), with the unemployment rate at 9.2% for Black Americans and 5.3% for white residents. Finally, the Black population is 1,147,770 (12.4% of the total).
8. Ohio

In Ohio, the median household income is $40,499 for Black residents compared to $71,843 for white residents. Homeownership values are 36.1% (Black) versus 72.7% (white), with the unemployment rate at 10.6% for Black Americans and 4.3% for white residents. Finally, the Black population is 1,431,238 (12.2% of the total).
7. Pennsylvania

In Pennsylvania, the median household income is $45,944 for Black residents compared to $77,962 for white residents. Homeownership values are 43.4% (Black) versus 74.3% (white), with the unemployment rate at 11.1% for Black Americans and 4.6% for white residents. Finally, the Black population is 1,347,784 (10.4% of the total).
6. Michigan

In Michigan, the median household income is $42,171 for Black residents compared to $73,039 for white residents. Homeownership values are 43.3% (Black) versus 78.4% (white), with the unemployment rate at 13.1% for Black Americans and 5.0% for white residents. Finally, the Black population is 1,346,918 (13.4% of the total).
5. Nebraska
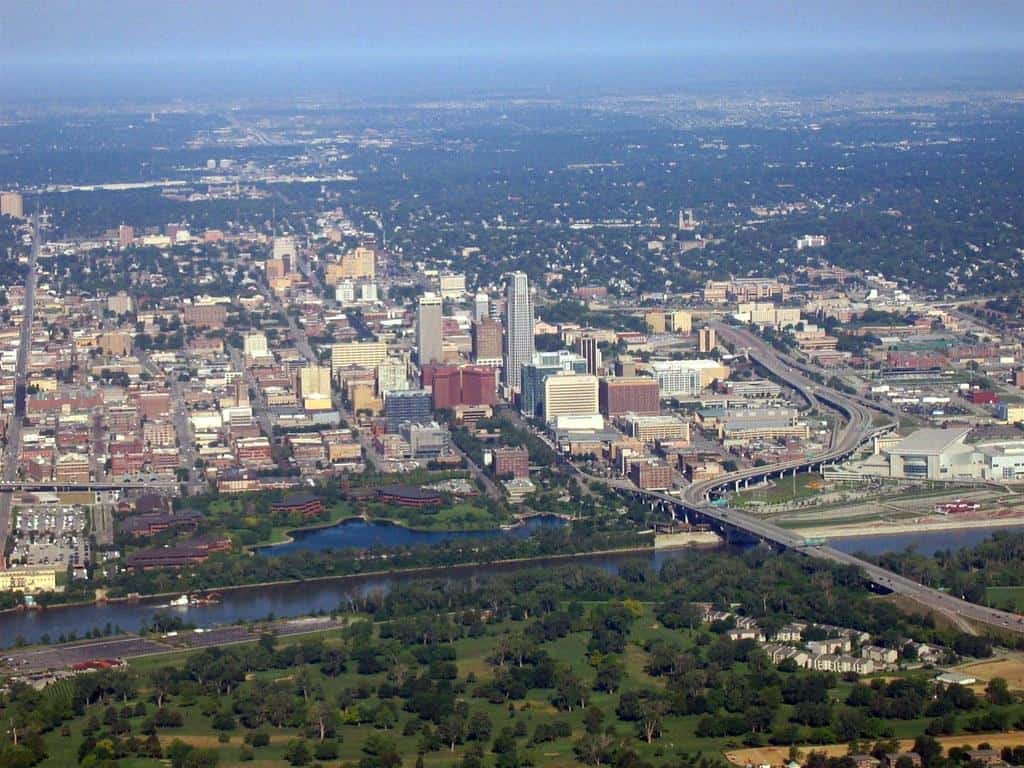
In Nebraska, the median household income is $45,287 for Black residents compared to $74,157 for white residents. Homeownership values are 29.8% (Black) versus 70.0% (white), with the unemployment rate at 8.3% for Black Americans and 2.8% for white residents. Finally, the Black population is 91,357 (4.7% of the total).
4. Illinois

In Illinois, the median household income is $46,717 for Black residents compared to $85,060 for white residents. Homeownership values are 40.2% (Black) versus 73.7% (white), with the unemployment rate at 13.7% for Black Americans and 4.8% for white residents. Finally, the Black population is 1,744,151 (13.7% of the total).
3. Minnesota

In Minnesota, the median household income is $49,738 for Black residents compared to $87,692 for white residents. Homeownership values are 28.4% (Black) versus 76.8% (white), with the unemployment rate at 8.6% for Black Americans and 3.4% for white residents. Finally, the Black population is 377,173 (6.6% of the total).
2. Iowa

In Iowa, the median household income is $40,592 for Black residents compared to $72,363 for white residents. Homeownership values are 27.2% (Black) versus 74.3% (white), with the unemployment rate at 11.0% for Black Americans and 3.4% for white residents. Finally, the Black population is 117,940 (3.7% of the total).
1. Wisconsin

In Wisconsin, the median household income is $38,732 for Black residents compared to $75,803 for white residents. Homeownership values are 26.5% (Black) versus 71.9% (white), with the unemployment rate at 8.3% for Black Americans and 3.0% for white residents. Finally, the Black population is 356,150 (6.1% of the total).
Want to Retire Early? Start Here (Sponsor)
Want retirement to come a few years earlier than you’d planned? Or are you ready to retire now, but want an extra set of eyes on your finances?
Now you can speak with up to 3 financial experts in your area for FREE. By simply clicking here you can begin to match with financial professionals who can help you build your plan to retire early. And the best part? The first conversation with them is free.
Click here to match with up to 3 financial pros who would be excited to help you make financial decisions.
The post Ranking the Worst States for Black Americans appeared first on 24/7 Wall St..