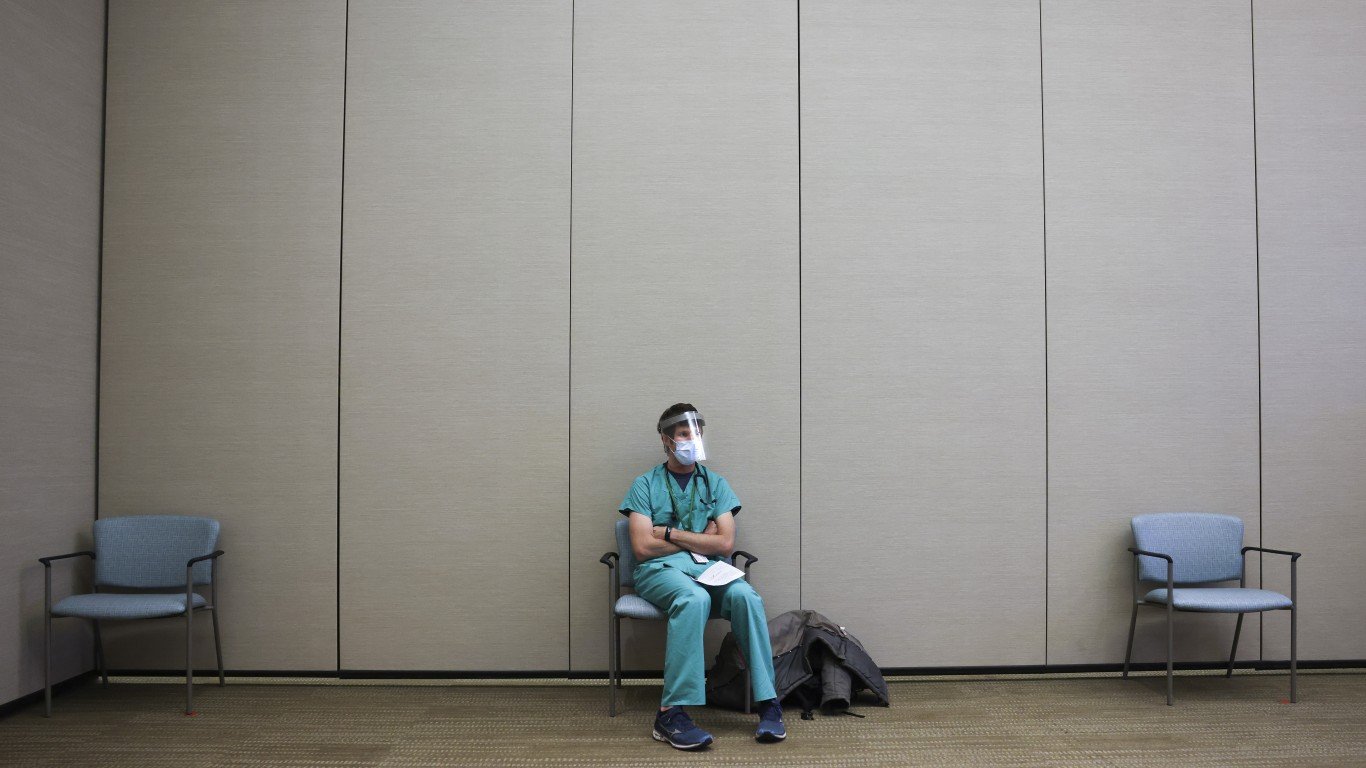
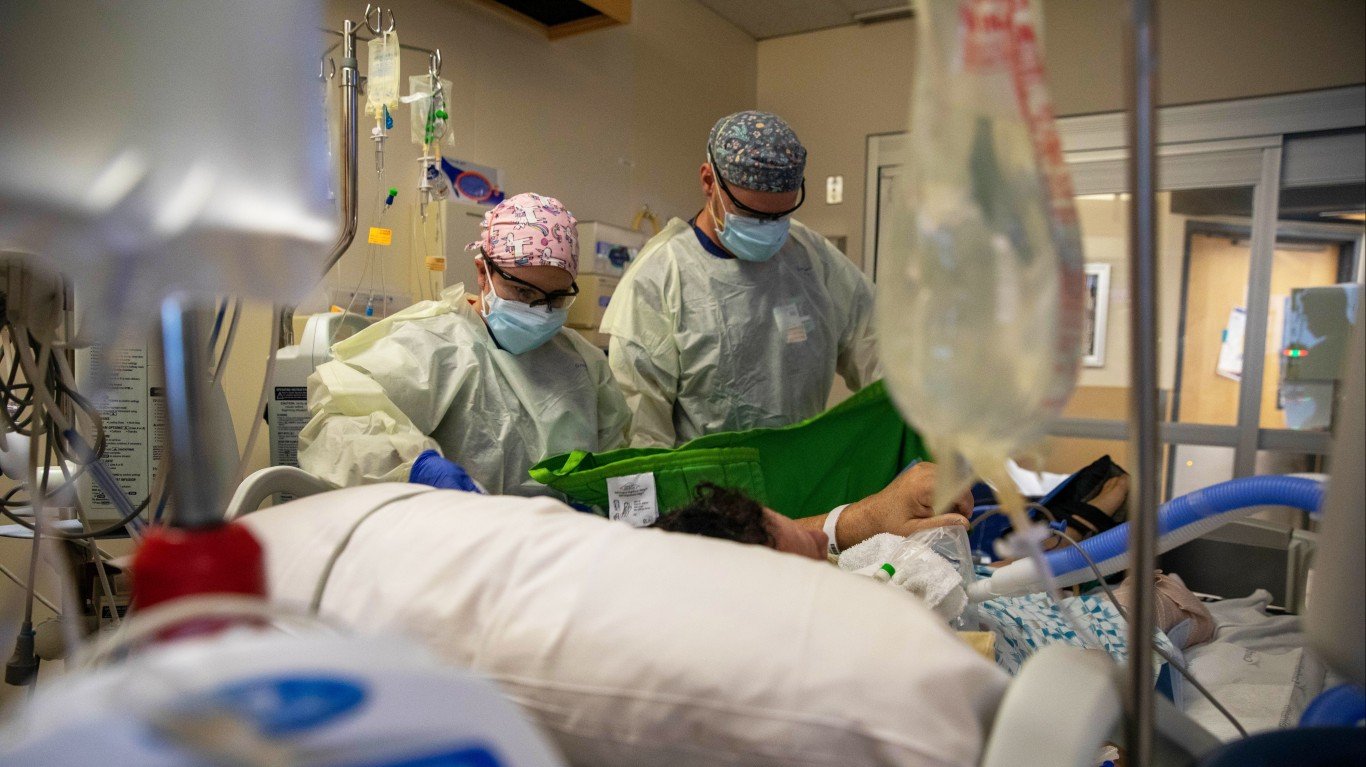
Stereotypes exist — and unfortunately, sometimes these stereotypes or misjudgments prevent people from receiving adequate medical care. A January 2024 study published in JAMA Neurology found that a missed or delayed diagnosis occurred in 23% of hospitalized adults who are either transferred to intensive care or die in the hospital. 17% of the errors made, the report found, cause damage or harm to those patients. Additional studies have found that women, and particularly women of color, and people in racial or ethnic minority subgroups are more likely to receive misdiagnoses, less likely to be taken seriously, and more likely to have serious health issues associated with poor medical care. This is often because of medical stereotypes or medical gaslighting, preventing people from getting care. Even worse, diagnostic mistakes are often not factored in when used to record cause of death. (Residents of this state receive the worst healthcare in America.)
The Centers for Disease Control and Prevention (CDC) say that 21,345 deaths occurred due to medical and surgical complications across the United States between 2018-21. But this can be frightening, as health does not discriminate; almost everyone requires treatment or care in their lifetime. To identify the states where the most medical complications and deaths occur, 24/7 Wall St. reviewed medical mortality data. from the CDC’s WONDER database. States were ranked based on the number of deaths due to complications of medical and surgical care per 100,000 state residents from 2018 to 2021. Mortality data is age-adjusted. As the CDC noted that South Dakota’s mortality data was unreliable, we excluded this state from our analysis. Supplemental data used to calculate the average dollar amount of medical malpractice payouts per resident from 2010 to 2022 are from the National Practitioner Data Ban of the U.S. Department of Health & Human Services and the U.S. Census Bureau’s Population and Housing Unit Estimates program and are inflation adjusted. Data on median annual salary for health care practitioners and technical occupations are from the Bureau of Labor Statistics Occupational Employment and Wage Statistics program and are for 2022. Data on the percentage of the civilian noninstitutionalized population with private health insurance is from the U.S. Census Bureau’s 2022 American Community Survey.
Why We Need to Share This Information

In America, health insurance and access to healthcare remain primary concerns, especially when it comes to political debates. As we approach the 2024 Presidential Election, healthcare issues are top of mind for many individuals. With almost one in 10 uninsured Americans, many cannot afford healthcare and worry astronomical healthcare bills will be their downfall. However, many of us fail to consider whether the hospitals we need are actually safe. As American citizens, we should all be aware of which states pose the greatest risk when it comes to medical error.
Here are the states where your risk of dying due to medical complications is highest:
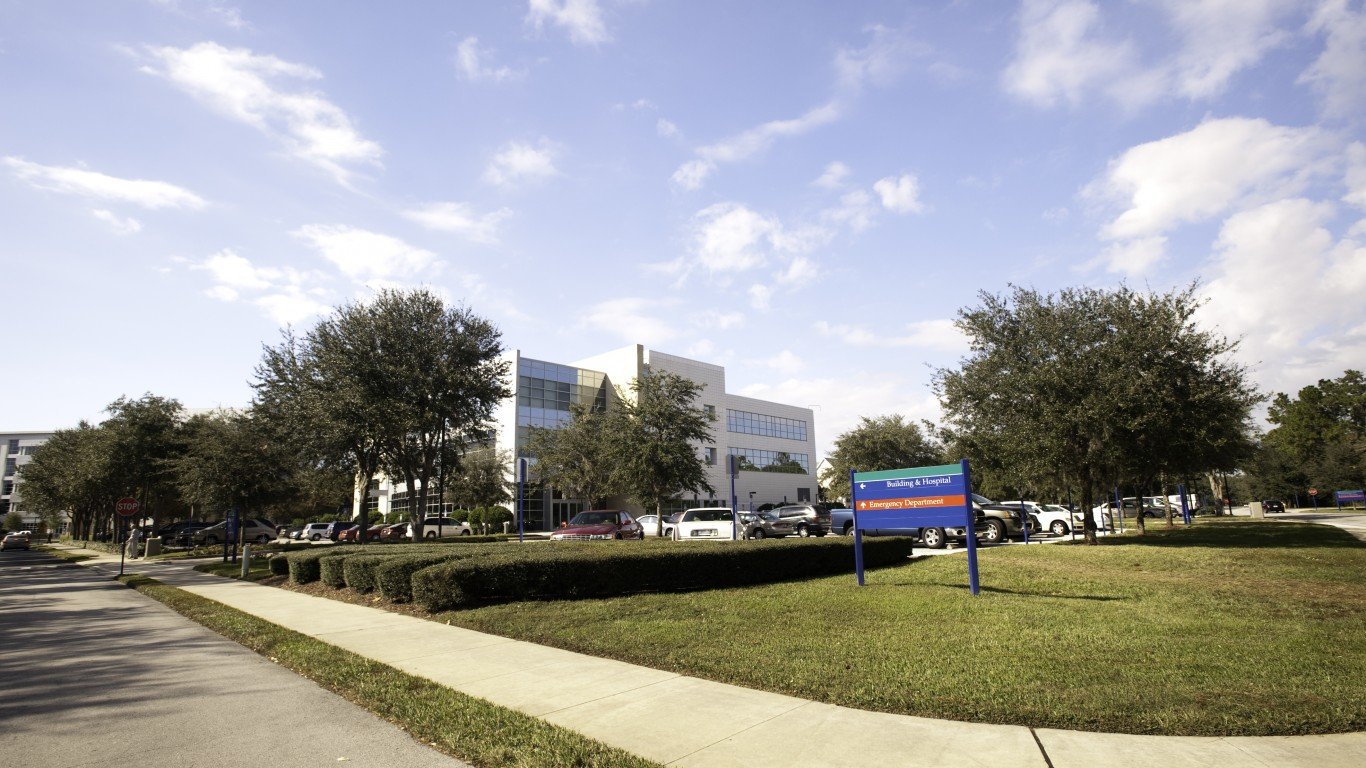
49. California

- Deaths from medical and surgical care complications, 2018-2021: 0.70 per 100,000 people
- Total deaths of these complications, 2018-2021: 1,283 or 6.0% of all deaths — 3rd highest
- Medical malpractice payouts, 2010-2022: $7.52 per capita (nat’l avg: $14.38)
- Avg. medical malpractice payout, 2010-2022: $45,786 for 82,674 cases (nat’l avg payout: $77,552)
- Median annual salary for healthcare practitioners, 2022: $105,710
- Population with private health insurance, 2022: 63.8%
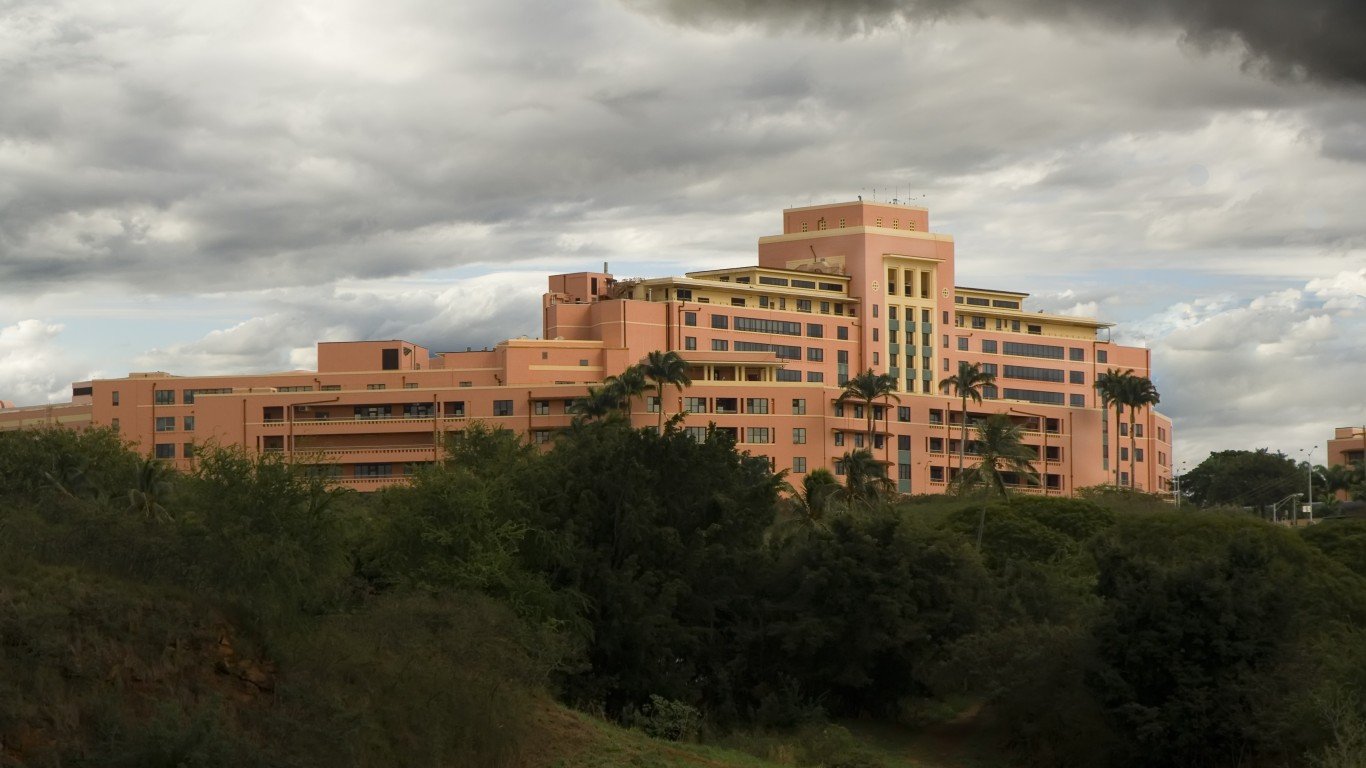
48. Hawaii
- Deaths from medical and surgical care complications, 2018-2021: 1.12 per 100,000 people
- Total deaths of these complications, 2018-2021: 83 or 0.4% of all deaths — 7th lowest
- Medical malpractice payouts, 2010-2022: $11.99 per capita (nat’l avg: $14.38)
- Avg. medical malpractice payout, 2010-2022: $178,208 for 1,239 cases (nat’l avg payout: $77,552)
- Median annual salary for healthcare practitioners, 2022: $99,540
- Population with private health insurance, 2022: 75.0%
47. Massachusetts

- Deaths from medical and surgical care complications, 2018-2021: 1.13 per 100,000 people
- Total deaths of these complications, 2018-2021: 392 or 1.8% of all deaths — 18th highest
- Medical malpractice payouts, 2010-2022: $28.22 per capita (nat’l avg: $14.38)
- Avg. medical malpractice payout, 2010-2022: $193,409 for 12,920 cases (nat’l avg payout: $77,552)
- Median annual salary for healthcare practitioners, 2022: $85,320
- Population with private health insurance, 2022: 73.4%
46. New York

- Deaths from medical and surgical care complications, 2018-2021: 1.16 per 100,000 people
- Total deaths of these complications, 2018-2021: 1,169 or 5.5% of all deaths — 4th highest
- Medical malpractice payouts, 2010-2022: $40.79 per capita (nat’l avg: $14.38)
- Avg. medical malpractice payout, 2010-2022: $299,023 for 34,821 cases (nat’l avg payout: $77,552)
- Median annual salary for healthcare practitioners, 2022: $90,600
- Population with private health insurance, 2022: 65.4%
45. Wisconsin

- Deaths from medical and surgical care complications, 2018-2021: 1.17 per 100,000 people
- Total deaths of these complications, 2018-2021: 356 or 1.7% of all deaths — 21st highest
- Medical malpractice payouts, 2010-2022: $4.83 per capita (nat’l avg: $14.38)
- Avg. medical malpractice payout, 2010-2022: $38,354 for 9,483 cases (nat’l avg payout: $77,552)
- Median annual salary for healthcare practitioners, 2022: $77,320
- Population with private health insurance, 2022: 73.3%
44. Delaware

- Deaths from medical and surgical care complications, 2018-2021: 1.18 per 100,000 people
- Total deaths of these complications, 2018-2021: 65 or 0.3% of all deaths — 4th lowest
- Medical malpractice payouts, 2010-2022: $13.53 per capita (nat’l avg: $14.38)
- Avg. medical malpractice payout, 2010-2022: $58,914 for 2,846 cases (nat’l avg payout: $77,552)
- Median annual salary for healthcare practitioners, 2022: $79,310
- Population with private health insurance, 2022: 71.8%
43. Louisiana

- Deaths from medical and surgical care complications, 2018-2021: 1.19 per 100,000 people
- Total deaths of these complications, 2018-2021: 265 or 1.2% of all deaths — 19th lowest
- Medical malpractice payouts, 2010-2022: $15.80 per capita (nat’l avg: $14.38)
- Avg. medical malpractice payout, 2010-2022: $44,178 for 21,529 cases (nat’l avg payout: $77,552)
- Median annual salary for healthcare practitioners, 2022: $63,610
- Population with private health insurance, 2022: 58.1%
42. Maryland

- Deaths from medical and surgical care complications, 2018-2021: 1.22 per 100,000 people
- Total deaths of these complications, 2018-2021: 356 or 1.7% of all deaths — 21st highest
- Medical malpractice payouts, 2010-2022: $19.42 per capita (nat’l avg: $14.38)
- Avg. medical malpractice payout, 2010-2022: $109,242 for 13,870 cases (nat’l avg payout: $77,552)
- Median annual salary for healthcare practitioners, 2022: $83,500
- Population with private health insurance, 2022: 72.8%
41. Illinois

- Deaths from medical and surgical care complications, 2018-2021: 1.22 per 100,000 people
- Total deaths of these complications, 2018-2021: 738 or 3.5% of all deaths — 8th highest
- Medical malpractice payouts, 2010-2022: $21.17 per capita (nat’l avg: $14.38)
- Avg. medical malpractice payout, 2010-2022: $146,213 for 24,072 cases (nat’l avg payout: $77,552)
- Median annual salary for healthcare practitioners, 2022: $76,650
- Population with private health insurance, 2022: 69.3%
40. New Jersey

- Deaths from medical and surgical care complications, 2018-2021: 1.23 per 100,000 people
- Total deaths of these complications, 2018-2021: 536 or 2.5% of all deaths — 13th highest
- Medical malpractice payouts, 2010-2022: $31.45 per capita (nat’l avg: $14.38)
- Avg. medical malpractice payout, 2010-2022: $172,158 for 21,270 cases (nat’l avg payout: $77,552)
- Median annual salary for healthcare practitioners, 2022: $92,370
- Population with private health insurance, 2022: 71.2%
39. Colorado
- Deaths from medical and surgical care complications, 2018-2021: 1.25 per 100,000 people
- Total deaths of these complications, 2018-2021: 318 or 1.5% of all deaths — 23rd lowest
- Medical malpractice payouts, 2010-2022: $8.67 per capita (nat’l avg: $14.38)
- Avg. medical malpractice payout, 2010-2022: $30,817 for 20,106 cases (nat’l avg payout: $77,552)
- Median annual salary for healthcare practitioners, 2022: $82,000
- Population with private health insurance, 2022: 70.5%
38. Michigan
- Deaths from medical and surgical care complications, 2018-2021: 1.25 per 100,000 people
- Total deaths of these complications, 2018-2021: 632 or 3.0% of all deaths — 9th highest
- Medical malpractice payouts, 2010-2022: $8.40 per capita (nat’l avg: $14.38)
- Avg. medical malpractice payout, 2010-2022: $39,622 for 27,442 cases (nat’l avg payout: $77,552)
- Median annual salary for healthcare practitioners, 2022: $76,240
- Population with private health insurance, 2022: 70.4%
37. Connecticut

- Deaths from medical and surgical care complications, 2018-2021: 1.25 per 100,000 people
- Total deaths of these complications, 2018-2021: 237 or 1.1% of all deaths — 17th lowest
- Medical malpractice payouts, 2010-2022: $24.90 per capita (nat’l avg: $14.38)
- Avg. medical malpractice payout, 2010-2022: $202,225 for 5,749 cases (nat’l avg payout: $77,552)
- Median annual salary for healthcare practitioners, 2022: $84,240
- Population with private health insurance, 2022: 68.9%
36. Virginia
- Deaths from medical and surgical care complications, 2018-2021: 1.27 per 100,000 people
- Total deaths of these complications, 2018-2021: 517 or 2.4% of all deaths — 15th highest
- Medical malpractice payouts, 2010-2022: $9.62 per capita (nat’l avg: $14.38)
- Avg. medical malpractice payout, 2010-2022: $50,701 for 20,711 cases (nat’l avg payout: $77,552)
- Median annual salary for healthcare practitioners, 2022: $76,900
- Population with private health insurance, 2022: 73.0%
35. Nebraska

- Deaths from medical and surgical care complications, 2018-2021: 1.30 per 100,000 people
- Total deaths of these complications, 2018-2021: 126 or 0.6% of all deaths — 11th lowest
- Medical malpractice payouts, 2010-2022: $8.63 per capita (nat’l avg: $14.38)
- Avg. medical malpractice payout, 2010-2022: $35,979 for 5,932 cases (nat’l avg payout: $77,552)
- Median annual salary for healthcare practitioners, 2022: $67,520
- Population with private health insurance, 2022: 73.6%
34. Georgia

- Deaths from medical and surgical care complications, 2018-2021: 1.32 per 100,000 people
- Total deaths of these complications, 2018-2021: 612 or 2.9% of all deaths — 10th highest
- Medical malpractice payouts, 2010-2022: $14.03 per capita (nat’l avg: $14.38)
- Avg. medical malpractice payout, 2010-2022: $139,500 for 13,473 cases (nat’l avg payout: $77,552)
- Median annual salary for healthcare practitioners, 2022: $75,050
- Population with private health insurance, 2022: 66.6%
33. Missouri

- Deaths from medical and surgical care complications, 2018-2021: 1.33 per 100,000 people
- Total deaths of these complications, 2018-2021: 399 or 1.9% of all deaths — 17th highest
- Medical malpractice payouts, 2010-2022: $12.48 per capita (nat’l avg: $14.38)
- Avg. medical malpractice payout, 2010-2022: $61,904 for 15,961 cases (nat’l avg payout: $77,552)
- Median annual salary for healthcare practitioners, 2022: $63,870
- Population with private health insurance, 2022: 68.8%
32. Arizona

- Deaths from medical and surgical care complications, 2018-2021: 1.34 per 100,000 people
- Total deaths of these complications, 2018-2021: 500 or 2.3% of all deaths — 16th highest
- Medical malpractice payouts, 2010-2022: $12.34 per capita (nat’l avg: $14.38)
- Avg. medical malpractice payout, 2010-2022: $55,409 for 20,027 cases (nat’l avg payout: $77,552)
- Median annual salary for healthcare practitioners, 2022: $79,390
- Population with private health insurance, 2022: 63.9%
31. Rhode Island

- Deaths from medical and surgical care complications, 2018-2021: 1.38 per 100,000 people
- Total deaths of these complications, 2018-2021: 75 or 0.4% of all deaths — 5th lowest
- Medical malpractice payouts, 2010-2022: $28.18 per capita (nat’l avg: $14.38)
- Avg. medical malpractice payout, 2010-2022: $179,926 for 2,169 cases (nat’l avg payout: $77,552)
- Median annual salary for healthcare practitioners, 2022: $82,330
- Population with private health insurance, 2022: 70.5%
30. Florida

- Deaths from medical and surgical care complications, 2018-2021: 1.38 per 100,000 people
- Total deaths of these complications, 2018-2021: 1,682 or 7.9% of all deaths — 2nd highest
- Medical malpractice payouts, 2010-2022: $15.98 per capita (nat’l avg: $14.38)
- Avg. medical malpractice payout, 2010-2022: $87,496 for 48,732 cases (nat’l avg payout: $77,552)
- Median annual salary for healthcare practitioners, 2022: $72,780
- Population with private health insurance, 2022: 63.6%
29. Oklahoma

- Deaths from medical and surgical care complications, 2018-2021: 1.40 per 100,000 people
- Total deaths of these complications, 2018-2021: 262 or 1.2% of all deaths — 18th lowest
- Medical malpractice payouts, 2010-2022: $12.30 per capita (nat’l avg: $14.38)
- Avg. medical malpractice payout, 2010-2022: $38,831 for 16,073 cases (nat’l avg payout: $77,552)
- Median annual salary for healthcare practitioners, 2022: $63,580
- Population with private health insurance, 2022: 61.7%
28. Alabama

- Deaths from medical and surgical care complications, 2018-2021: 1.40 per 100,000 people
- Total deaths of these complications, 2018-2021: 339 or 1.6% of all deaths — 25th highest
- Medical malpractice payouts, 2010-2022: $7.63 per capita (nat’l avg: $14.38)
- Avg. medical malpractice payout, 2010-2022: $30,698 for 15,809 cases (nat’l avg payout: $77,552)
- Median annual salary for healthcare practitioners, 2022: $59,810
- Population with private health insurance, 2022: 67.0%
27. New Hampshire

- Deaths from medical and surgical care complications, 2018-2021: 1.42 per 100,000 people
- Total deaths of these complications, 2018-2021: 104 or 0.5% of all deaths — 9th lowest
- Medical malpractice payouts, 2010-2022: $21.10 per capita (nat’l avg: $14.38)
- Avg. medical malpractice payout, 2010-2022: $129,193 for 2,864 cases (nat’l avg payout: $77,552)
- Median annual salary for healthcare practitioners, 2022: $80,000
- Population with private health insurance, 2022: 75.6%
26. Montana

- Deaths from medical and surgical care complications, 2018-2021: 1.42 per 100,000 people
- Total deaths of these complications, 2018-2021: 86 or 0.4% of all deaths — 8th lowest
- Medical malpractice payouts, 2010-2022: $13.33 per capita (nat’l avg: $14.38)
- Avg. medical malpractice payout, 2010-2022: $87,427 for 2,075 cases (nat’l avg payout: $77,552)
- Median annual salary for healthcare practitioners, 2022: $75,380
- Population with private health insurance, 2022: 65.2%
25. Minnesota
- Deaths from medical and surgical care complications, 2018-2021: 1.42 per 100,000 people
- Total deaths of these complications, 2018-2021: 390 or 1.8% of all deaths — 19th highest
- Medical malpractice payouts, 2010-2022: $7.53 per capita (nat’l avg: $14.38)
- Avg. medical malpractice payout, 2010-2022: $50,058 for 10,812 cases (nat’l avg payout: $77,552)
- Median annual salary for healthcare practitioners, 2022: $82,260
- Population with private health insurance, 2022: 74.7%
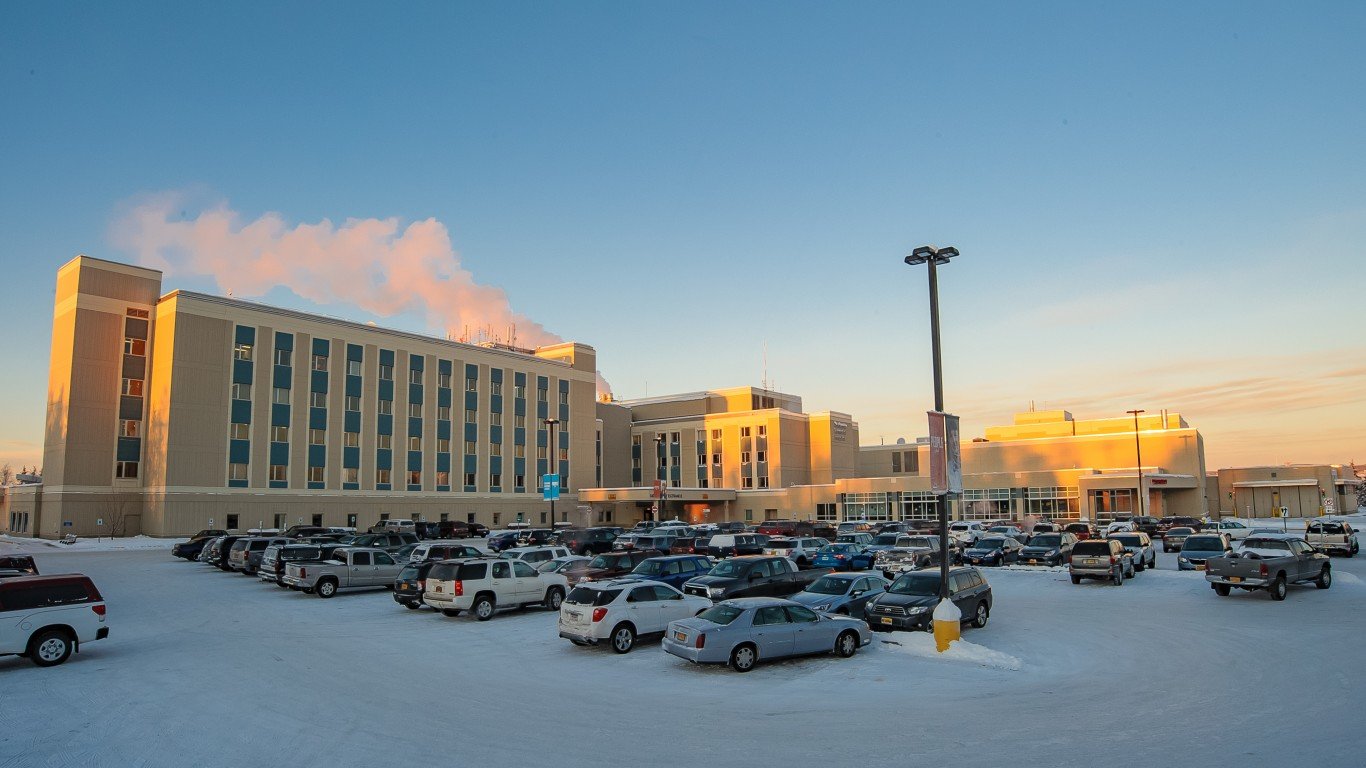
24. Alaska
- Deaths from medical and surgical care complications, 2018-2021: 1.43 per 100,000 people
- Total deaths of these complications, 2018-2021: 37 or 0.2% of all deaths — the lowest
- Medical malpractice payouts, 2010-2022: $19.10 per capita (nat’l avg: $14.38)
- Avg. medical malpractice payout, 2010-2022: $84,324 for 2,160 cases (nat’l avg payout: $77,552)
- Median annual salary for healthcare practitioners, 2022: $94,680
- Population with private health insurance, 2022: 66.4%
23. Pennsylvania

- Deaths from medical and surgical care complications, 2018-2021: 1.43 per 100,000 people
- Total deaths of these complications, 2018-2021: 998 or 4.7% of all deaths — 5th highest
- Medical malpractice payouts, 2010-2022: $30.87 per capita (nat’l avg: $14.38)
- Avg. medical malpractice payout, 2010-2022: $166,985 for 30,829 cases (nat’l avg payout: $77,552)
- Median annual salary for healthcare practitioners, 2022: $74,120
- Population with private health insurance, 2022: 71.2%
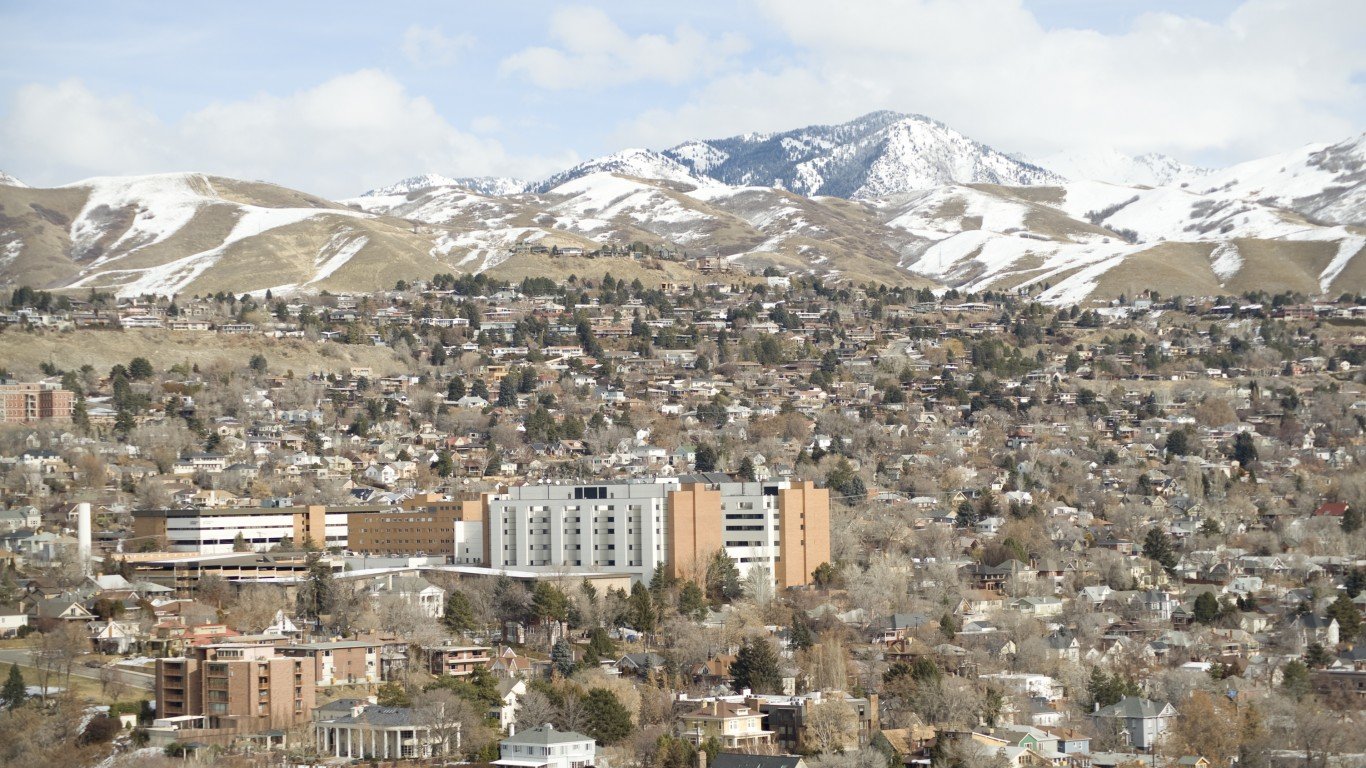
22. Utah
- Deaths from medical and surgical care complications, 2018-2021: 1.45 per 100,000 people
- Total deaths of these complications, 2018-2021: 166 or 0.8% of all deaths — 13th lowest
- Medical malpractice payouts, 2010-2022: $9.17 per capita (nat’l avg: $14.38)
- Avg. medical malpractice payout, 2010-2022: $58,017 for 6,284 cases (nat’l avg payout: $77,552)
- Median annual salary for healthcare practitioners, 2022: $72,890
- Population with private health insurance, 2022: 78.4%
21. South Carolina

- Deaths from medical and surgical care complications, 2018-2021: 1.46 per 100,000 people
- Total deaths of these complications, 2018-2021: 389 or 1.8% of all deaths — 20th highest
- Medical malpractice payouts, 2010-2022: $10.43 per capita (nat’l avg: $14.38)
- Avg. medical malpractice payout, 2010-2022: $64,352 for 10,433 cases (nat’l avg payout: $77,552)
- Median annual salary for healthcare practitioners, 2022: $66,420
- Population with private health insurance, 2022: 66.9%
20. North Carolina

- Deaths from medical and surgical care complications, 2018-2021: 1.48 per 100,000 people
- Total deaths of these complications, 2018-2021: 748 or 3.5% of all deaths — 7th highest
- Medical malpractice payouts, 2010-2022: $5.82 per capita (nat’l avg: $14.38)
- Avg. medical malpractice payout, 2010-2022: $49,898 for 15,368 cases (nat’l avg payout: $77,552)
- Median annual salary for healthcare practitioners, 2022: $66,650
- Population with private health insurance, 2022: 67.8%
19. Texas

- Deaths from medical and surgical care complications, 2018-2021: 1.52 per 100,000 people
- Total deaths of these complications, 2018-2021: 1,784 or 8.4% of all deaths — the highest
- Medical malpractice payouts, 2010-2022: $4.42 per capita (nat’l avg: $14.38)
- Avg. medical malpractice payout, 2010-2022: $22,829 for 69,737 cases (nat’l avg payout: $77,552)
- Median annual salary for healthcare practitioners, 2022: $74,600
- Population with private health insurance, 2022: 62.8%
18. Kentucky
- Deaths from medical and surgical care complications, 2018-2021: 1.54 per 100,000 people
- Total deaths of these complications, 2018-2021: 339 or 1.6% of all deaths — 25th highest
- Medical malpractice payouts, 2010-2022: $11.00 per capita (nat’l avg: $14.38)
- Avg. medical malpractice payout, 2010-2022: $52,301 for 12,138 cases (nat’l avg payout: $77,552)
- Median annual salary for healthcare practitioners, 2022: $64,540
- Population with private health insurance, 2022: 62.8%
17. Nevada

- Deaths from medical and surgical care complications, 2018-2021: 1.56 per 100,000 people
- Total deaths of these complications, 2018-2021: 226 or 1.1% of all deaths — 16th lowest
- Medical malpractice payouts, 2010-2022: $9.12 per capita (nat’l avg: $14.38)
- Avg. medical malpractice payout, 2010-2022: $49,346 for 7,037 cases (nat’l avg payout: $77,552)
- Median annual salary for healthcare practitioners, 2022: $82,050
- Population with private health insurance, 2022: 63.4%
16. Maine

- Deaths from medical and surgical care complications, 2018-2021: 1.56 per 100,000 people
- Total deaths of these complications, 2018-2021: 124 or 0.6% of all deaths — 10th lowest
- Medical malpractice payouts, 2010-2022: $16.42 per capita (nat’l avg: $14.38)
- Avg. medical malpractice payout, 2010-2022: $65,269 for 4,390 cases (nat’l avg payout: $77,552)
- Median annual salary for healthcare practitioners, 2022: $76,400
- Population with private health insurance, 2022: 68.7%
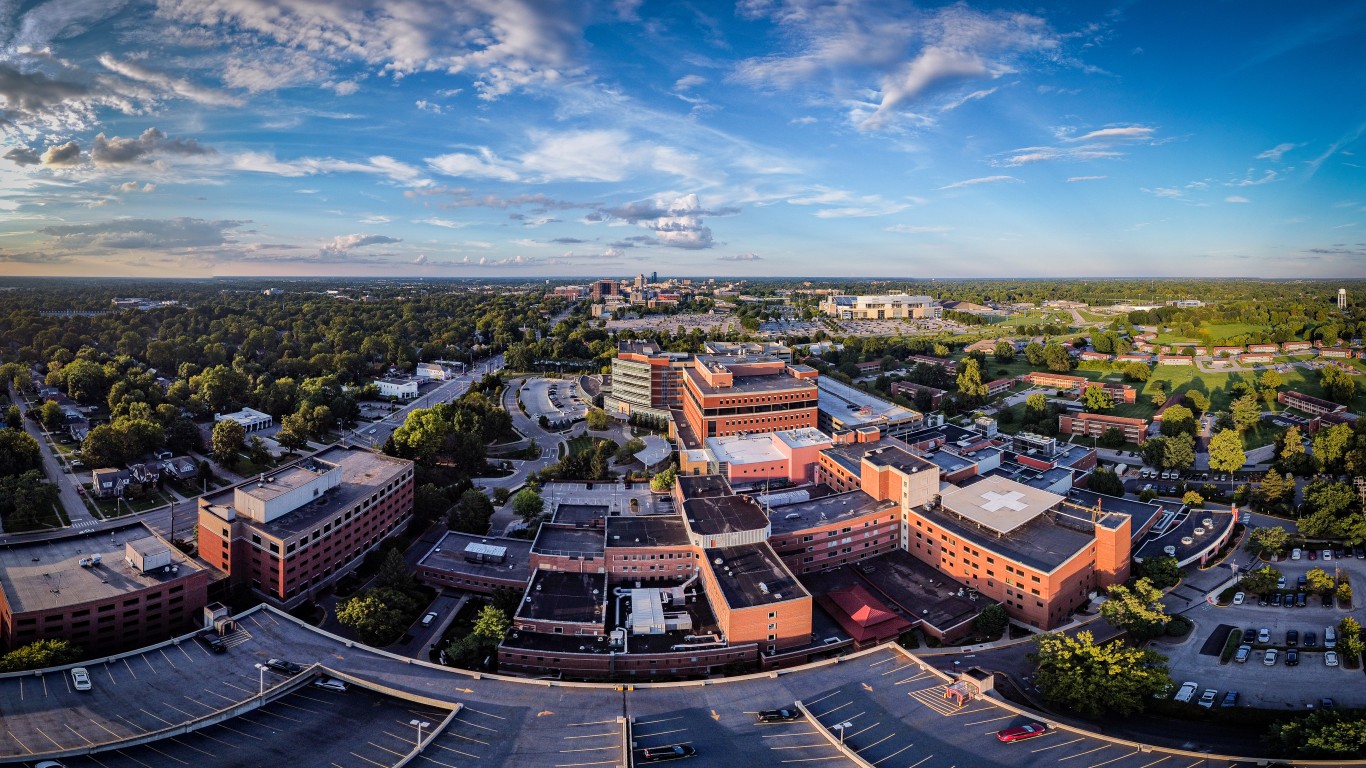
15. Ohio

- Deaths from medical and surgical care complications, 2018-2021: 1.63 per 100,000 people
- Total deaths of these complications, 2018-2021: 964 or 4.5% of all deaths — 6th highest
- Medical malpractice payouts, 2010-2022: $8.62 per capita (nat’l avg: $14.38)
- Avg. medical malpractice payout, 2010-2022: $37,050 for 35,222 cases (nat’l avg payout: $77,552)
- Median annual salary for healthcare practitioners, 2022: $69,960
- Population with private health insurance, 2022: 68.1%
14. Washington

- Deaths from medical and surgical care complications, 2018-2021: 1.63 per 100,000 people
- Total deaths of these complications, 2018-2021: 574 or 2.7% of all deaths — 12th highest
- Medical malpractice payouts, 2010-2022: $10.89 per capita (nat’l avg: $14.38)
- Avg. medical malpractice payout, 2010-2022: $44,590 for 23,155 cases (nat’l avg payout: $77,552)
- Median annual salary for healthcare practitioners, 2022: $96,530
- Population with private health insurance, 2022: 70.8%
13. Oregon

- Deaths from medical and surgical care complications, 2018-2021: 1.63 per 100,000 people
- Total deaths of these complications, 2018-2021: 350 or 1.6% of all deaths — 24th highest
- Medical malpractice payouts, 2010-2022: $13.89 per capita (nat’l avg: $14.38)
- Avg. medical malpractice payout, 2010-2022: $50,468 for 14,563 cases (nat’l avg payout: $77,552)
- Median annual salary for healthcare practitioners, 2022: $100,480
- Population with private health insurance, 2022: 67.1%
12. Iowa

- Deaths from medical and surgical care complications, 2018-2021: 1.63 per 100,000 people
- Total deaths of these complications, 2018-2021: 267 or 1.3% of all deaths — 20th lowest
- Medical malpractice payouts, 2010-2022: $10.34 per capita (nat’l avg: $14.38)
- Avg. medical malpractice payout, 2010-2022: $61,806 for 6,811 cases (nat’l avg payout: $77,552)
- Median annual salary for healthcare practitioners, 2022: $64,070
- Population with private health insurance, 2022: 73.3%
11. Indiana

- Deaths from medical and surgical care complications, 2018-2021: 1.66 per 100,000 people
- Total deaths of these complications, 2018-2021: 532 or 2.5% of all deaths — 14th highest
- Medical malpractice payouts, 2010-2022: $11.25 per capita (nat’l avg: $14.38)
- Avg. medical malpractice payout, 2010-2022: $60,077 for 16,200 cases (nat’l avg payout: $77,552)
- Median annual salary for healthcare practitioners, 2022: $66,760
- Population with private health insurance, 2022: 68.4%
10. North Dakota

- Deaths from medical and surgical care complications, 2018-2021: 1.74 per 100,000 people
- Total deaths of these complications, 2018-2021: 63 or 0.3% of all deaths — 3rd lowest
- Medical malpractice payouts, 2010-2022: $4.45 per capita (nat’l avg: $14.38)
- Avg. medical malpractice payout, 2010-2022: $19,295 for 2,227 cases (nat’l avg payout: $77,552)
- Median annual salary for healthcare practitioners, 2022: $65,210
- Population with private health insurance, 2022: 78.4%
9. Tennessee

- Deaths from medical and surgical care complications, 2018-2021: 1.76 per 100,000 people
- Total deaths of these complications, 2018-2021: 591 or 2.8% of all deaths — 11th highest
- Medical malpractice payouts, 2010-2022: $8.10 per capita (nat’l avg: $14.38)
- Avg. medical malpractice payout, 2010-2022: $42,624 for 16,479 cases (nat’l avg payout: $77,552)
- Median annual salary for healthcare practitioners, 2022: $63,700
- Population with private health insurance, 2022: 67.2%
8. Idaho
- Deaths from medical and surgical care complications, 2018-2021: 1.78 per 100,000 people
- Total deaths of these complications, 2018-2021: 143 or 0.7% of all deaths — 12th lowest
- Medical malpractice payouts, 2010-2022: $8.69 per capita (nat’l avg: $14.38)
- Avg. medical malpractice payout, 2010-2022: $82,120 for 2,359 cases (nat’l avg payout: $77,552)
- Median annual salary for healthcare practitioners, 2022: $74,630
- Population with private health insurance, 2022: 68.3%
7. Vermont

- Deaths from medical and surgical care complications, 2018-2021: 1.78 per 100,000 people
- Total deaths of these complications, 2018-2021: 59 or 0.3% of all deaths — 2nd lowest
- Medical malpractice payouts, 2010-2022: $9.42 per capita (nat’l avg: $14.38)
- Avg. medical malpractice payout, 2010-2022: $35,786 for 2,157 cases (nat’l avg payout: $77,552)
- Median annual salary for healthcare practitioners, 2022: $77,230
- Population with private health insurance, 2022: 70.0%
6. West Virginia

- Deaths from medical and surgical care complications, 2018-2021: 1.81 per 100,000 people
- Total deaths of these complications, 2018-2021: 184 or 0.9% of all deaths — 14th lowest
- Medical malpractice payouts, 2010-2022: $21.26 per capita (nat’l avg: $14.38)
- Avg. medical malpractice payout, 2010-2022: $82,852 for 6,087 cases (nat’l avg payout: $77,552)
- Median annual salary for healthcare practitioners, 2022: $61,350
- Population with private health insurance, 2022: 61.8%
5. Kansas

- Deaths from medical and surgical care complications, 2018-2021: 1.94 per 100,000 people
- Total deaths of these complications, 2018-2021: 273 or 1.3% of all deaths — 21st lowest
- Medical malpractice payouts, 2010-2022: $11.60 per capita (nat’l avg: $14.38)
- Avg. medical malpractice payout, 2010-2022: $47,938 for 9,146 cases (nat’l avg payout: $77,552)
- Median annual salary for healthcare practitioners, 2022: $64,570
- Population with private health insurance, 2022: 73.7%
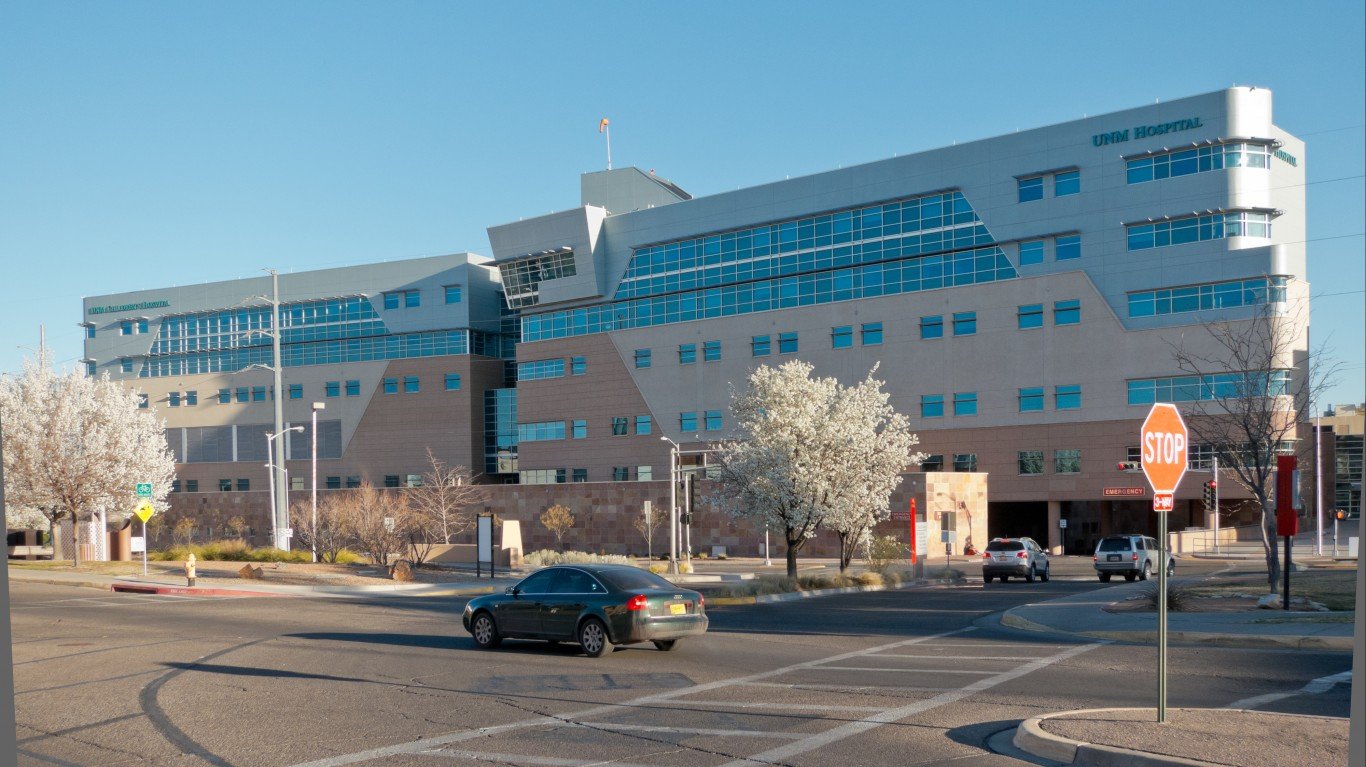
4. New Mexico
- Deaths from medical and surgical care complications, 2018-2021: 1.96 per 100,000 people
- Total deaths of these complications, 2018-2021: 206 or 1.0% of all deaths — 15th lowest
- Medical malpractice payouts, 2010-2022: $21.32 per capita (nat’l avg: $14.38)
- Avg. medical malpractice payout, 2010-2022: $118,078 for 4,917 cases (nat’l avg payout: $77,552)
- Median annual salary for healthcare practitioners, 2022: $78,560
- Population with private health insurance, 2022: 54.4%
3. Arkansas

- Deaths from medical and surgical care complications, 2018-2021: 2.09 per 100,000 people
- Total deaths of these complications, 2018-2021: 311 or 1.5% of all deaths — 22nd lowest
- Medical malpractice payouts, 2010-2022: $7.84 per capita (nat’l avg: $14.38)
- Avg. medical malpractice payout, 2010-2022: $31,206 for 9,761 cases (nat’l avg payout: $77,552)
- Median annual salary for healthcare practitioners, 2022: $60,660
- Population with private health insurance, 2022: 60.0%
2. Mississippi

- Deaths from medical and surgical care complications, 2018-2021: 2.58 per 100,000 people
- Total deaths of these complications, 2018-2021: 352 or 1.6% of all deaths — 23rd highest
- Medical malpractice payouts, 2010-2022: $7.67 per capita (nat’l avg: $14.38)
- Avg. medical malpractice payout, 2010-2022: $39,856 for 7,448 cases (nat’l avg payout: $77,552)
- Median annual salary for healthcare practitioners, 2022: $60,190
- Population with private health insurance, 2022: 61.5%
1. Wyoming

- Deaths from medical and surgical care complications, 2018-2021: 2.61 per 100,000 people
- Total deaths of these complications, 2018-2021: 79 or 0.4% of all deaths — 6th lowest
- Medical malpractice payouts, 2010-2022: $10.89 per capita (nat’l avg: $14.38)
- Avg. medical malpractice payout, 2010-2022: $36,728 for 2,231 cases (nat’l avg payout: $77,552)
- Median annual salary for healthcare practitioners, 2022: $76,920
- Population with private health insurance, 2022: 71.0%
Find a Qualified Financial Advisor (Sponsor)
Finding a qualified financial advisor doesn’t have to be hard. SmartAsset’s free tool matches you with up to 3 fiduciary financial advisors in your area in 5 minutes. Each advisor has been vetted by SmartAsset and is held to a fiduciary standard to act in your best interests. If you’re ready to be matched with local advisors that can help you achieve your financial goals, get started now.
The post Don’t Trust Your Medical Care in This State — You Might Die appeared first on 24/7 Wall St..