Populations worldwide are growing exponentially, while concerns are growing right along with it. This growing population results in demands on food production, sanitation, and public services. With limited resources, how will the planet manage to support so many humans? More people mean more pollution and exacerbated climate change, which will undoubtedly affect life on Earth as we know it.
However, while a significant number of areas of the globe are experiencing expanding populations, other areas are dwindling. Likewise, this is the case in America as well; while many U.S. cities are increasing in residents, there are also many areas that are shrinking. Nature, a science journal, recently reported that half of 30,000 U.S. cities will see population decline by the year 2100. Just as population increase poses city-wide challenges, so too does population loss. Loss of residents contributes to issues like transit disruptions and lack of access to electricity.
24/7 Wall St. reviewed the study, Depopulation and associated challenges for US cities by 2100, listing here the 26 cities with 2020 population above 10,000 that are projected to shrink by at least 50% by 2100 — under the middle of the road scenario, which includes intermediate challenges. We also added socioeconomic data — median household income, poverty rate, unemployment rate, bachelor’s degree attainment rate — from the Census Bureau’s 5-year estimates 2022 American Community Survey.
Interestingly, the majority of the cities on this list are in the Midwestern region of the country, representing 12 of the 26 listed cities. The cities of Saginaw, Flint, Burton, and Bay City are all in Michigan. Six cities are located in Illinois, including Serling, Belleville, Freeport, Cahokia, Decatur, and East St. Louis. However, Pine Bluff, Arkansas is at the top of the list. This city is estimated to lose 67.8% of its population by 2100.
Why This Matters
 Cities with declining populations will face socioeconomic, environmental, and infrastructure challenges to accommodate the remaining population. Residents of depopulating cities may see disruptions in basic services like transit, clean water, electricity, proper sewage system, solid waste management, social services, health care access, and more as adjusting larger systems to a smaller population with a decreasing tax revenue can prove difficult. Such cities need to plan ahead, either to find ways to attract new residents, to reduce the loss of the current population, or to address depopulation challenges.
26. Laurinburg, North Carolina

- Population change by 2100: -50.1% (from 14,978 in 2020 to 7,468 in 2100)
- Current population trend from 2000-2020: slowly depopulating
- Median household income: $38,015 (vs $75,149 nationwide)
- Poverty rate: 33.8% (vs. 12.5% nationwide)
- Unemployment rate: 11.2% (vs. 5.3% nationwide)
- Bachelor’s degree attainment rate: 19.0% (vs. 34.3% nationwide)
25. Bogalusa, Louisiana
- Population change by 2100: -52.5% (from 10,659 in 2020 to 5,065 in 2100)
- Current population trend from 2000-2020: moderately depopulating
- Median household income: $39,213 (vs $75,149 nationwide)
- Poverty rate: 29.6% (vs. 12.5% nationwide)
- Unemployment rate: 11.6% (vs. 5.3% nationwide)
- Bachelor’s degree attainment rate: 12.2% (vs. 34.3% nationwide)
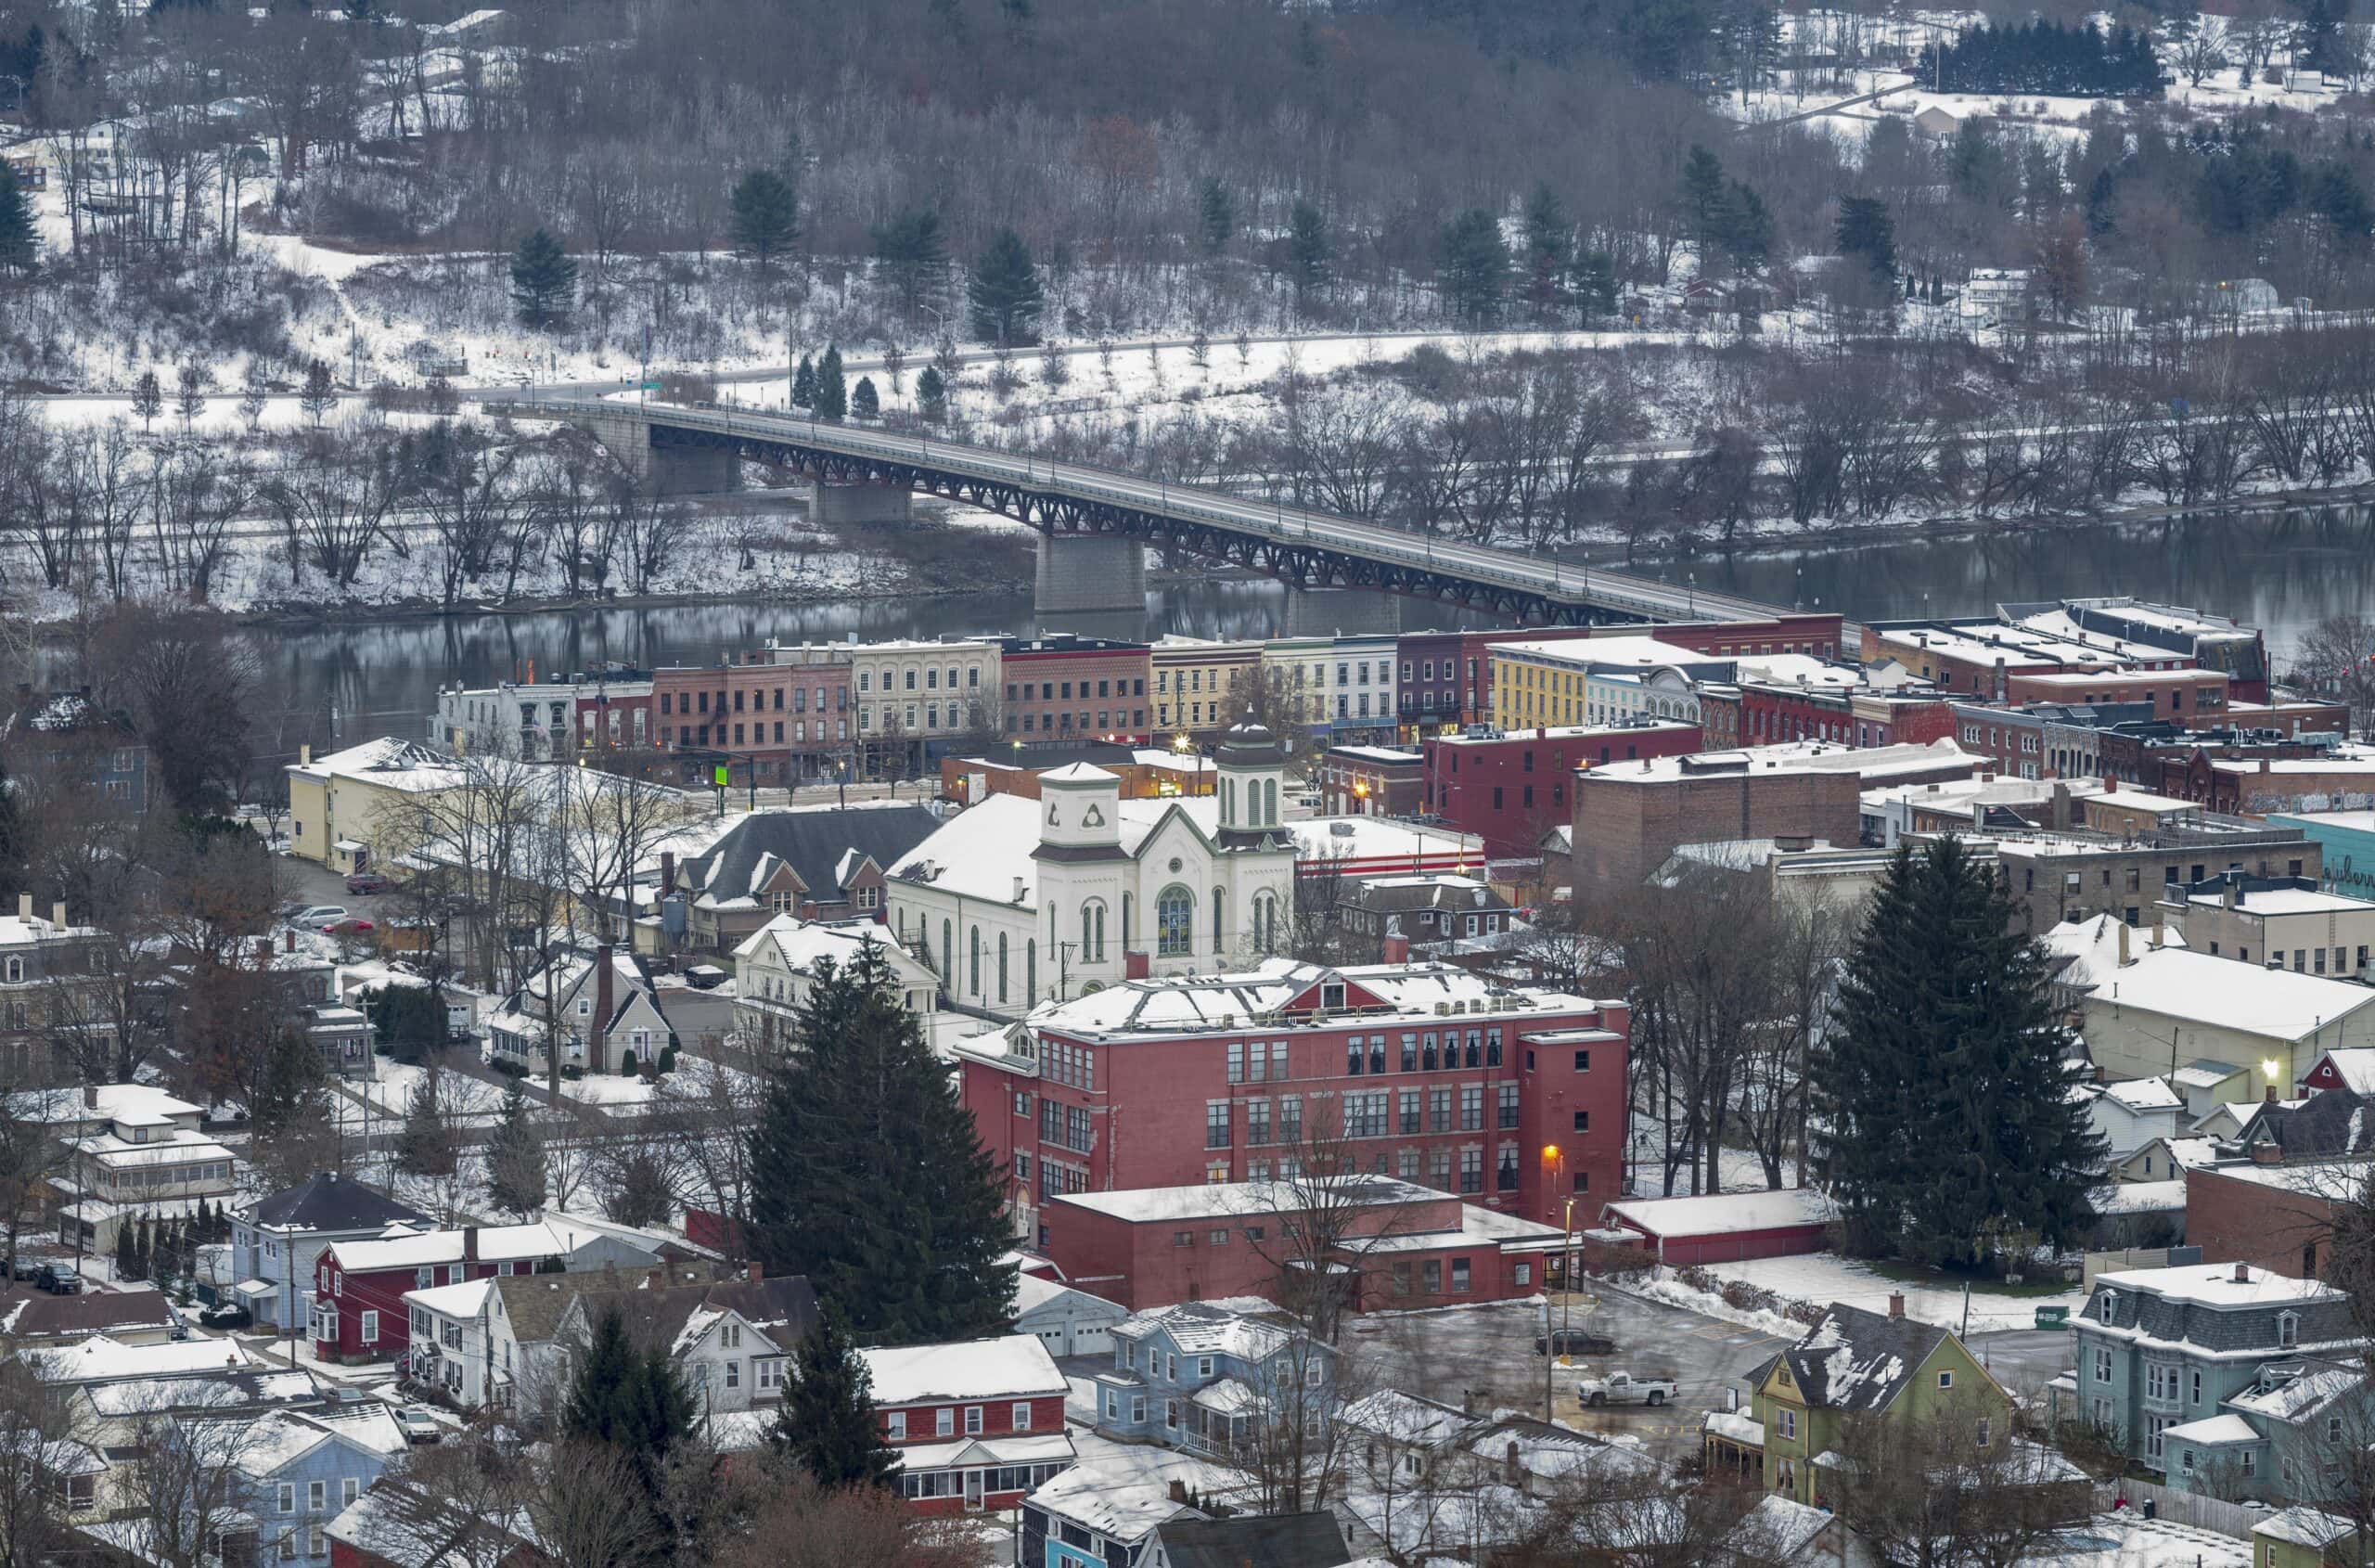
24. Meadville, Pennsylvania

- Population change by 2100: -53.5% (from 13,050 in 2020 to 6,064 in 2100)
- Current population trend from 2000-2020: slowly depopulating
- Median household income: $46,157 (vs $75,149 nationwide)
- Poverty rate: 18.1% (vs. 12.5% nationwide)
- Unemployment rate: 6.9% (vs. 5.3% nationwide)
- Bachelor’s degree attainment rate: 24.9% (vs. 34.3% nationwide)
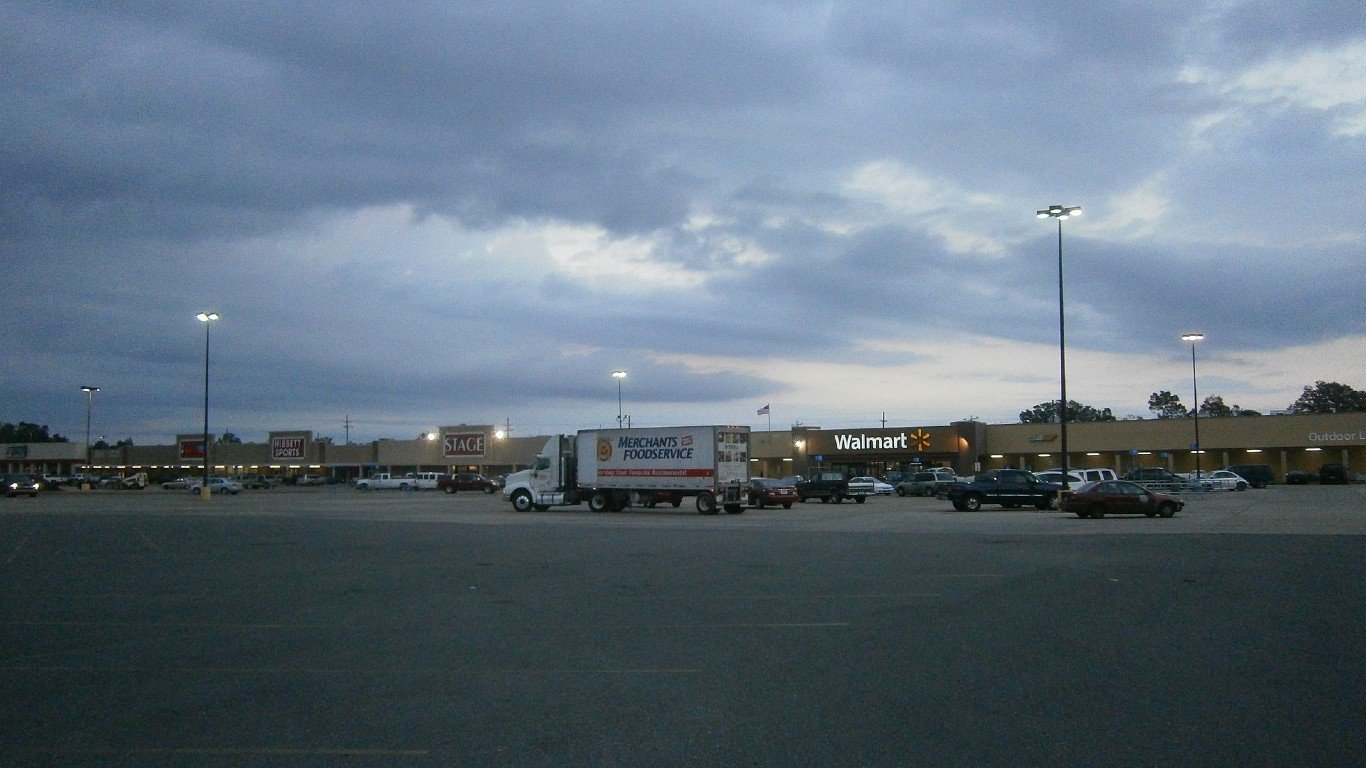
23. Burton, Michigan
- Population change by 2100: -53.7% (from 29,715 in 2020 to 13,756 in 2100)
- Current population trend from 2000-2020: slowly depopulating
- Median household income: $55,698 (vs $75,149 nationwide)
- Poverty rate: 16.2% (vs. 12.5% nationwide)
- Unemployment rate: 7.1% (vs. 5.3% nationwide)
- Bachelor’s degree attainment rate: 16.2% (vs. 34.3% nationwide)
22. Batavia, New York

- Population change by 2100: -54.1% (from 15,600 in 2020 to 7,161 in 2100)
- Current population trend from 2000-2020: fluctuating
- Median household income: $54,937 (vs $75,149 nationwide)
- Poverty rate: 13.3% (vs. 12.5% nationwide)
- Unemployment rate: 4.0% (vs. 5.3% nationwide)
- Bachelor’s degree attainment rate: 22.5% (vs. 34.3% nationwide)
21. Sterling, Illinois

- Population change by 2100: -54.4% (from 14,764 in 2020 to 6,732 in 2100)
- Current population trend from 2000-2020: slowly depopulating
- Median household income: $49,007 (vs $75,149 nationwide)
- Poverty rate: 15.1% (vs. 12.5% nationwide)
- Unemployment rate: 5.1% (vs. 5.3% nationwide)
- Bachelor’s degree attainment rate: 16.5% (vs. 34.3% nationwide)
20. Freeport, Illinois

- Population change by 2100: -55.0% (from 23,973 in 2020 to 10,797 in 2100)
- Current population trend from 2000-2020: slowly depopulating
- Median household income: $44,658 (vs $75,149 nationwide)
- Poverty rate: 18.6% (vs. 12.5% nationwide)
- Unemployment rate: 6.4% (vs. 5.3% nationwide)
- Bachelor’s degree attainment rate: 18.2% (vs. 34.3% nationwide)
19. Cambridge, Ohio

- Population change by 2100: -55.8% (from 10,089 in 2020 to 4,459 in 2100)
- Current population trend from 2000-2020: slowly depopulating
- Median household income: $39,589 (vs $75,149 nationwide)
- Poverty rate: 30.2% (vs. 12.5% nationwide)
- Unemployment rate: 2.5% (vs. 5.3% nationwide)
- Bachelor’s degree attainment rate: 13.4% (vs. 34.3% nationwide)
18. Fulton, New York

- Population change by 2100: -56.3% (from 11,389 in 2020 to 4,974 in 2100)
- Current population trend from 2000-2020: slowly depopulating
- Median household income: N/A
- Poverty rate: N/A
- Unemployment rate: N/A
- Bachelor’s degree attainment rate: N/A
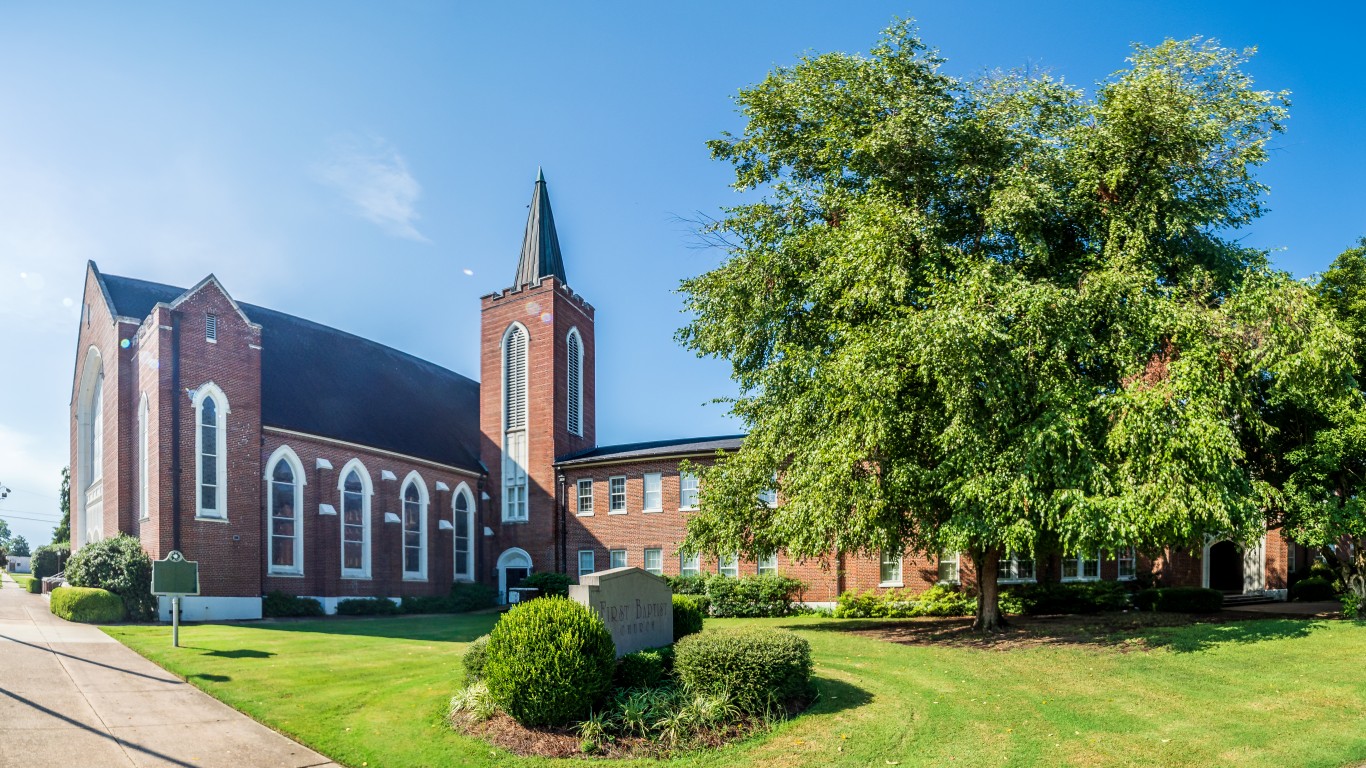
17. Selma, Alabama

- Population change by 2100: -56.5% (from 17,971 in 2020 to 7,809 in 2100)
- Current population trend from 2000-2020: moderately depopulating
- Median household income: $31,084 (vs $75,149 nationwide)
- Poverty rate: 29.5% (vs. 12.5% nationwide)
- Unemployment rate: 12.9% (vs. 5.3% nationwide)
- Bachelor’s degree attainment rate: 19.7% (vs. 34.3% nationwide)
16. Oswego, New York
- Population change by 2100: -57.0% (from 16,921 in 2020 to 7,280 in 2100)
- Current population trend from 2000-2020: slowly depopulating
- Median household income: $50,266 (vs $75,149 nationwide)
- Poverty rate: 25.4% (vs. 12.5% nationwide)
- Unemployment rate: 10.6% (vs. 5.3% nationwide)
- Bachelor’s degree attainment rate: 27.8% (vs. 34.3% nationwide)
15. New Castle, Pennsylvania

- Population change by 2100: -57.0% (from 21,926 in 2020 to 9,427 in 2100)
- Current population trend from 2000-2020: slowly depopulating
- Median household income: $39,948 (vs $75,149 nationwide)
- Poverty rate: 26.4% (vs. 12.5% nationwide)
- Unemployment rate: 15.6% (vs. 5.3% nationwide)
- Bachelor’s degree attainment rate: 16.5% (vs. 34.3% nationwide)
14. Bay City, Michigan

- Population change by 2100: -57.9% (from 32,661 in 2020 to 13,734 in 2100)
- Current population trend from 2000-2020: slowly depopulating
- Median household income: $45,026 (vs $75,149 nationwide)
- Poverty rate: 24.8% (vs. 12.5% nationwide)
- Unemployment rate: 6.2% (vs. 5.3% nationwide)
- Bachelor’s degree attainment rate: 16.3% (vs. 34.3% nationwide)
13. Mount Airy, North Carolina

- Population change by 2100: -58.6% (from 10,676 in 2020 to 4,418 in 2100)
- Current population trend from 2000-2020: slowly increasing
- Median household income: $34,089 (vs $75,149 nationwide)
- Poverty rate: 31.7% (vs. 12.5% nationwide)
- Unemployment rate: 7.2% (vs. 5.3% nationwide)
- Bachelor’s degree attainment rate: 24.7% (vs. 34.3% nationwide)
12. Saginaw, Michigan
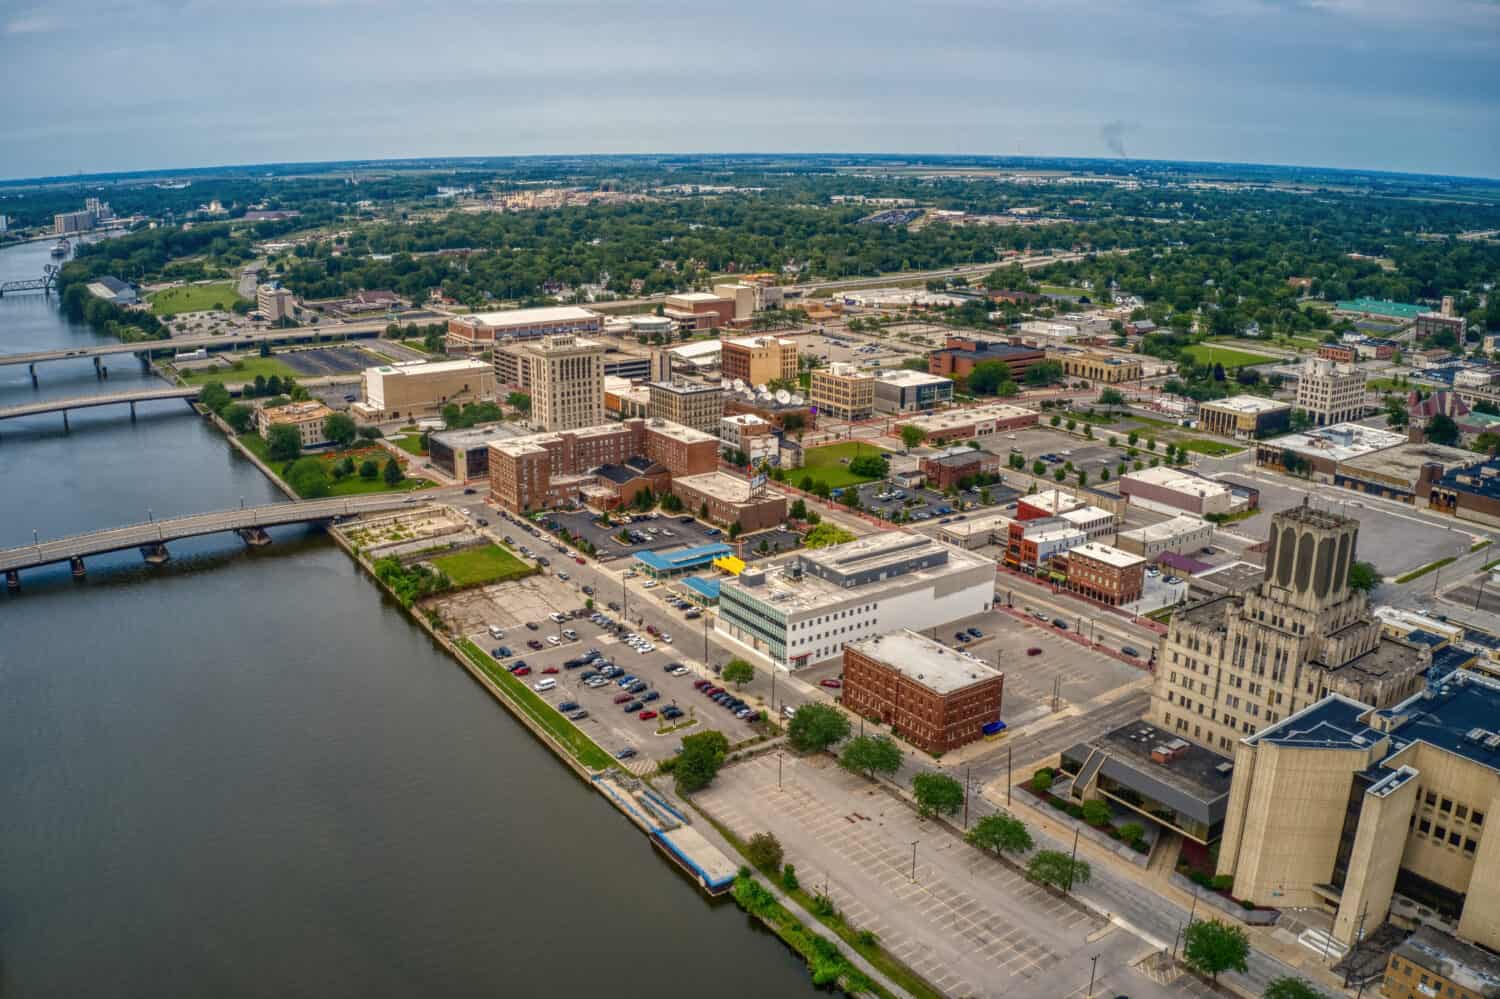
- Population change by 2100: -59.7% (from 44,202 in 2020 to 17,828 in 2100)
- Current population trend from 2000-2020: moderately depopulating
- Median household income: $35,521 (vs $75,149 nationwide)
- Poverty rate: 34.5% (vs. 12.5% nationwide)
- Unemployment rate: 11.7% (vs. 5.3% nationwide)
- Bachelor’s degree attainment rate: 12.8% (vs. 34.3% nationwide)
11. Belleville, Illinois

- Population change by 2100: -60.5% (from 42,404 in 2020 to 16,770 in 2100)
- Current population trend from 2000-2020: fluctuating
- Median household income: $60,573 (vs $75,149 nationwide)
- Poverty rate: 14.7% (vs. 12.5% nationwide)
- Unemployment rate: 5.9% (vs. 5.3% nationwide)
- Bachelor’s degree attainment rate: 26.4% (vs. 34.3% nationwide)
10. Decatur, Illinois

- Population change by 2100: -60.5% (from 70,522 in 2020 to 27,862 in 2100)
- Current population trend from 2000-2020: slowly depopulating
- Median household income: $49,039 (vs $75,149 nationwide)
- Poverty rate: 19.5% (vs. 12.5% nationwide)
- Unemployment rate: 8.9% (vs. 5.3% nationwide)
- Bachelor’s degree attainment rate: 21.4% (vs. 34.3% nationwide)
9. Cahokia, Illinois
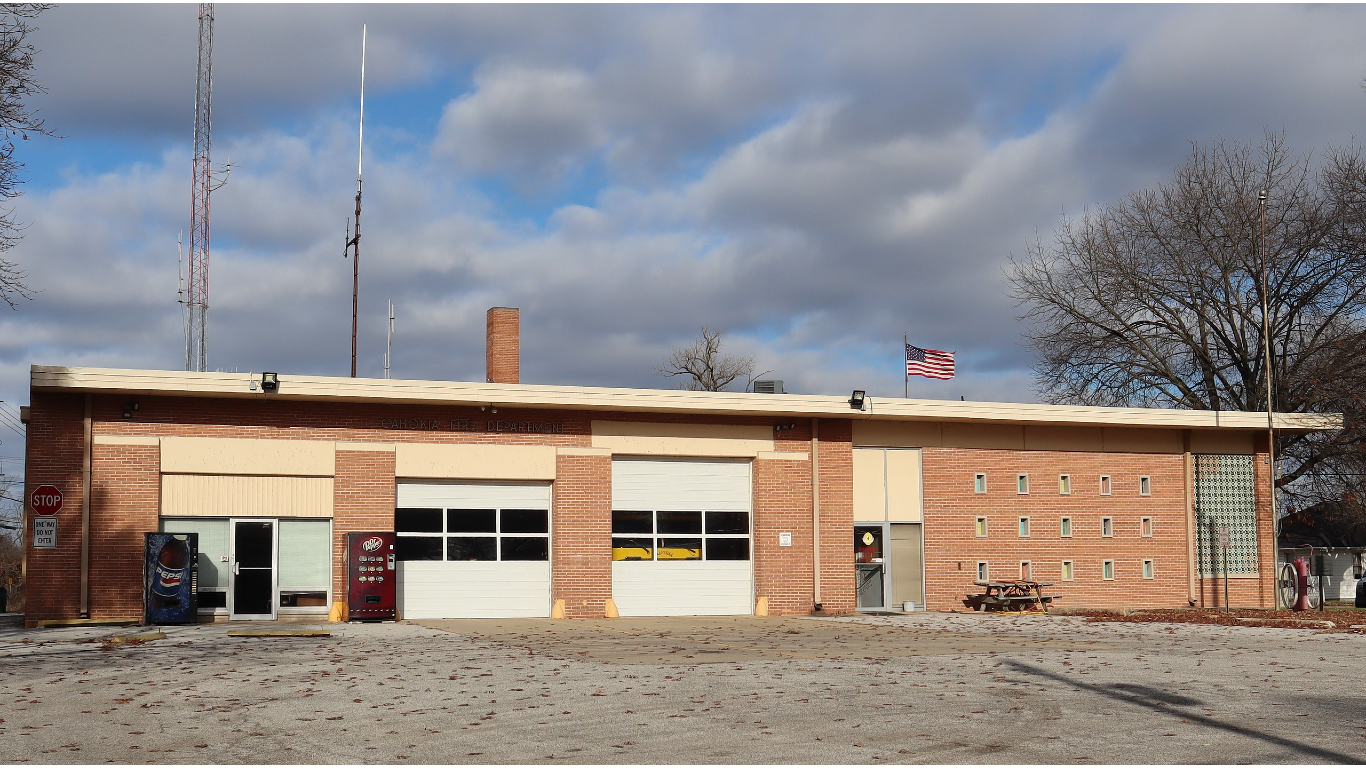
- Population change by 2100: -60.8% (from 12,096 in 2020 to 4,747 in 2100)
- Current population trend from 2000-2020: moderately depopulating
- Median household income: N/A
- Poverty rate: N/A
- Unemployment rate: N/A
- Bachelor’s degree attainment rate: N/A
8. East St. Louis, Illinois
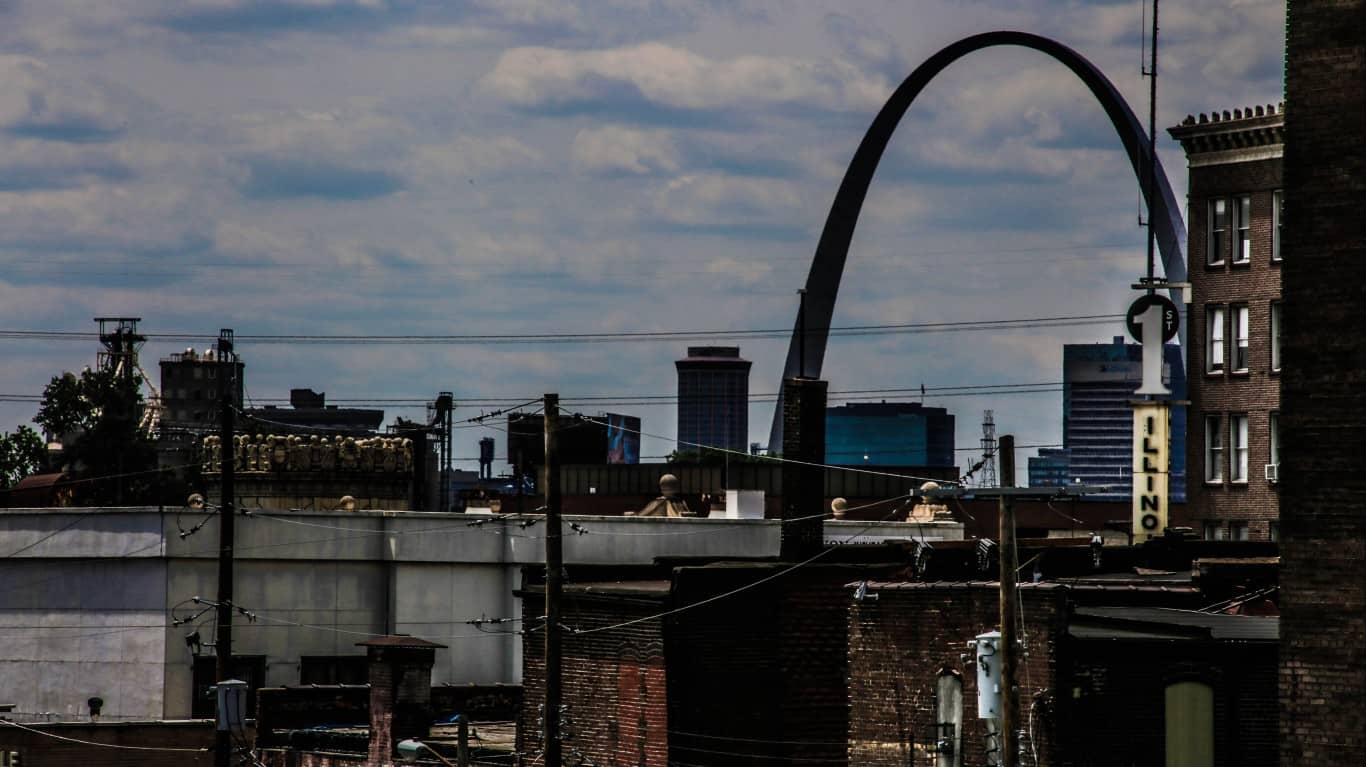
- Population change by 2100: -60.8% (from 18,469 in 2020 to 7,240 in 2100)
- Current population trend from 2000-2020: moderately depopulating
- Median household income: $28,519 (vs $75,149 nationwide)
- Poverty rate: 31.6% (vs. 12.5% nationwide)
- Unemployment rate: 13.0% (vs. 5.3% nationwide)
- Bachelor’s degree attainment rate: 12.4% (vs. 34.3% nationwide)
7. Flint, Michigan

- Population change by 2100: -60.9% (from 81,252 in 2020 to 31,799 in 2100)
- Current population trend from 2000-2020: moderately depopulating
- Median household income: $35,451 (vs $75,149 nationwide)
- Poverty rate: 33.3% (vs. 12.5% nationwide)
- Unemployment rate: 17.6% (vs. 5.3% nationwide)
- Bachelor’s degree attainment rate: 12.3% (vs. 34.3% nationwide)
6. Eufaula, Alabama

- Population change by 2100: -61.3% (from 12,882 in 2020 to 4,982 in 2100)
- Current population trend from 2000-2020: slowly depopulating
- Median household income: $39,511 (vs $75,149 nationwide)
- Poverty rate: 25.3% (vs. 12.5% nationwide)
- Unemployment rate: 5.2% (vs. 5.3% nationwide)
- Bachelor’s degree attainment rate: 17.3% (vs. 34.3% nationwide)
5. Plainview, Texas
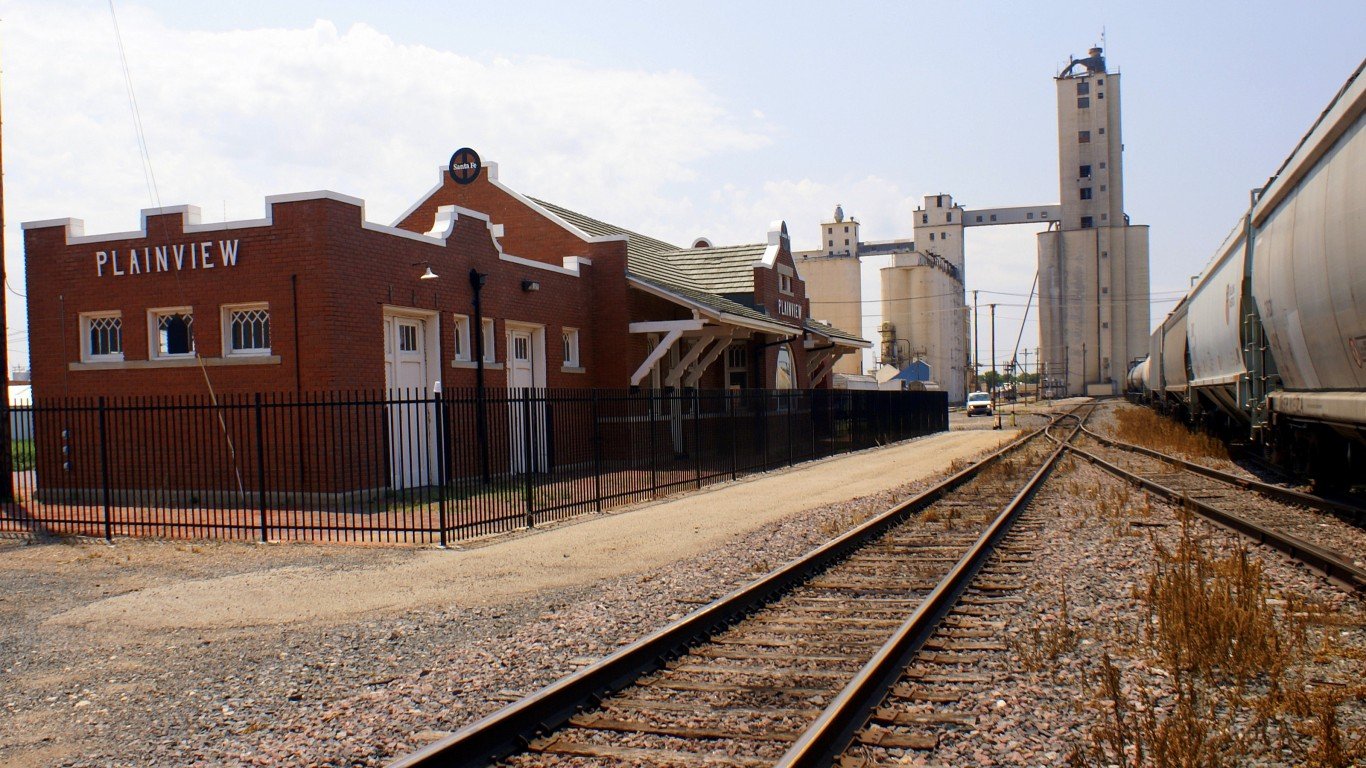
- Population change by 2100: -63.1% (from 20,187 in 2020 to 7,451 in 2100)
- Current population trend from 2000-2020: slowly depopulating
- Median household income: $46,274 (vs $75,149 nationwide)
- Poverty rate: 21.6% (vs. 12.5% nationwide)
- Unemployment rate: 6.6% (vs. 5.3% nationwide)
- Bachelor’s degree attainment rate: 14.6% (vs. 34.3% nationwide)
4. Portsmouth, Ohio

- Population change by 2100: -63.3% (from 18,252 in 2020 to 6,706 in 2100)
- Current population trend from 2000-2020: slowly depopulating
- Median household income: $36,051 (vs $75,149 nationwide)
- Poverty rate: 35.4% (vs. 12.5% nationwide)
- Unemployment rate: 11.5% (vs. 5.3% nationwide)
- Bachelor’s degree attainment rate: 16.7% (vs. 34.3% nationwide)
3. Show Low, Arizona
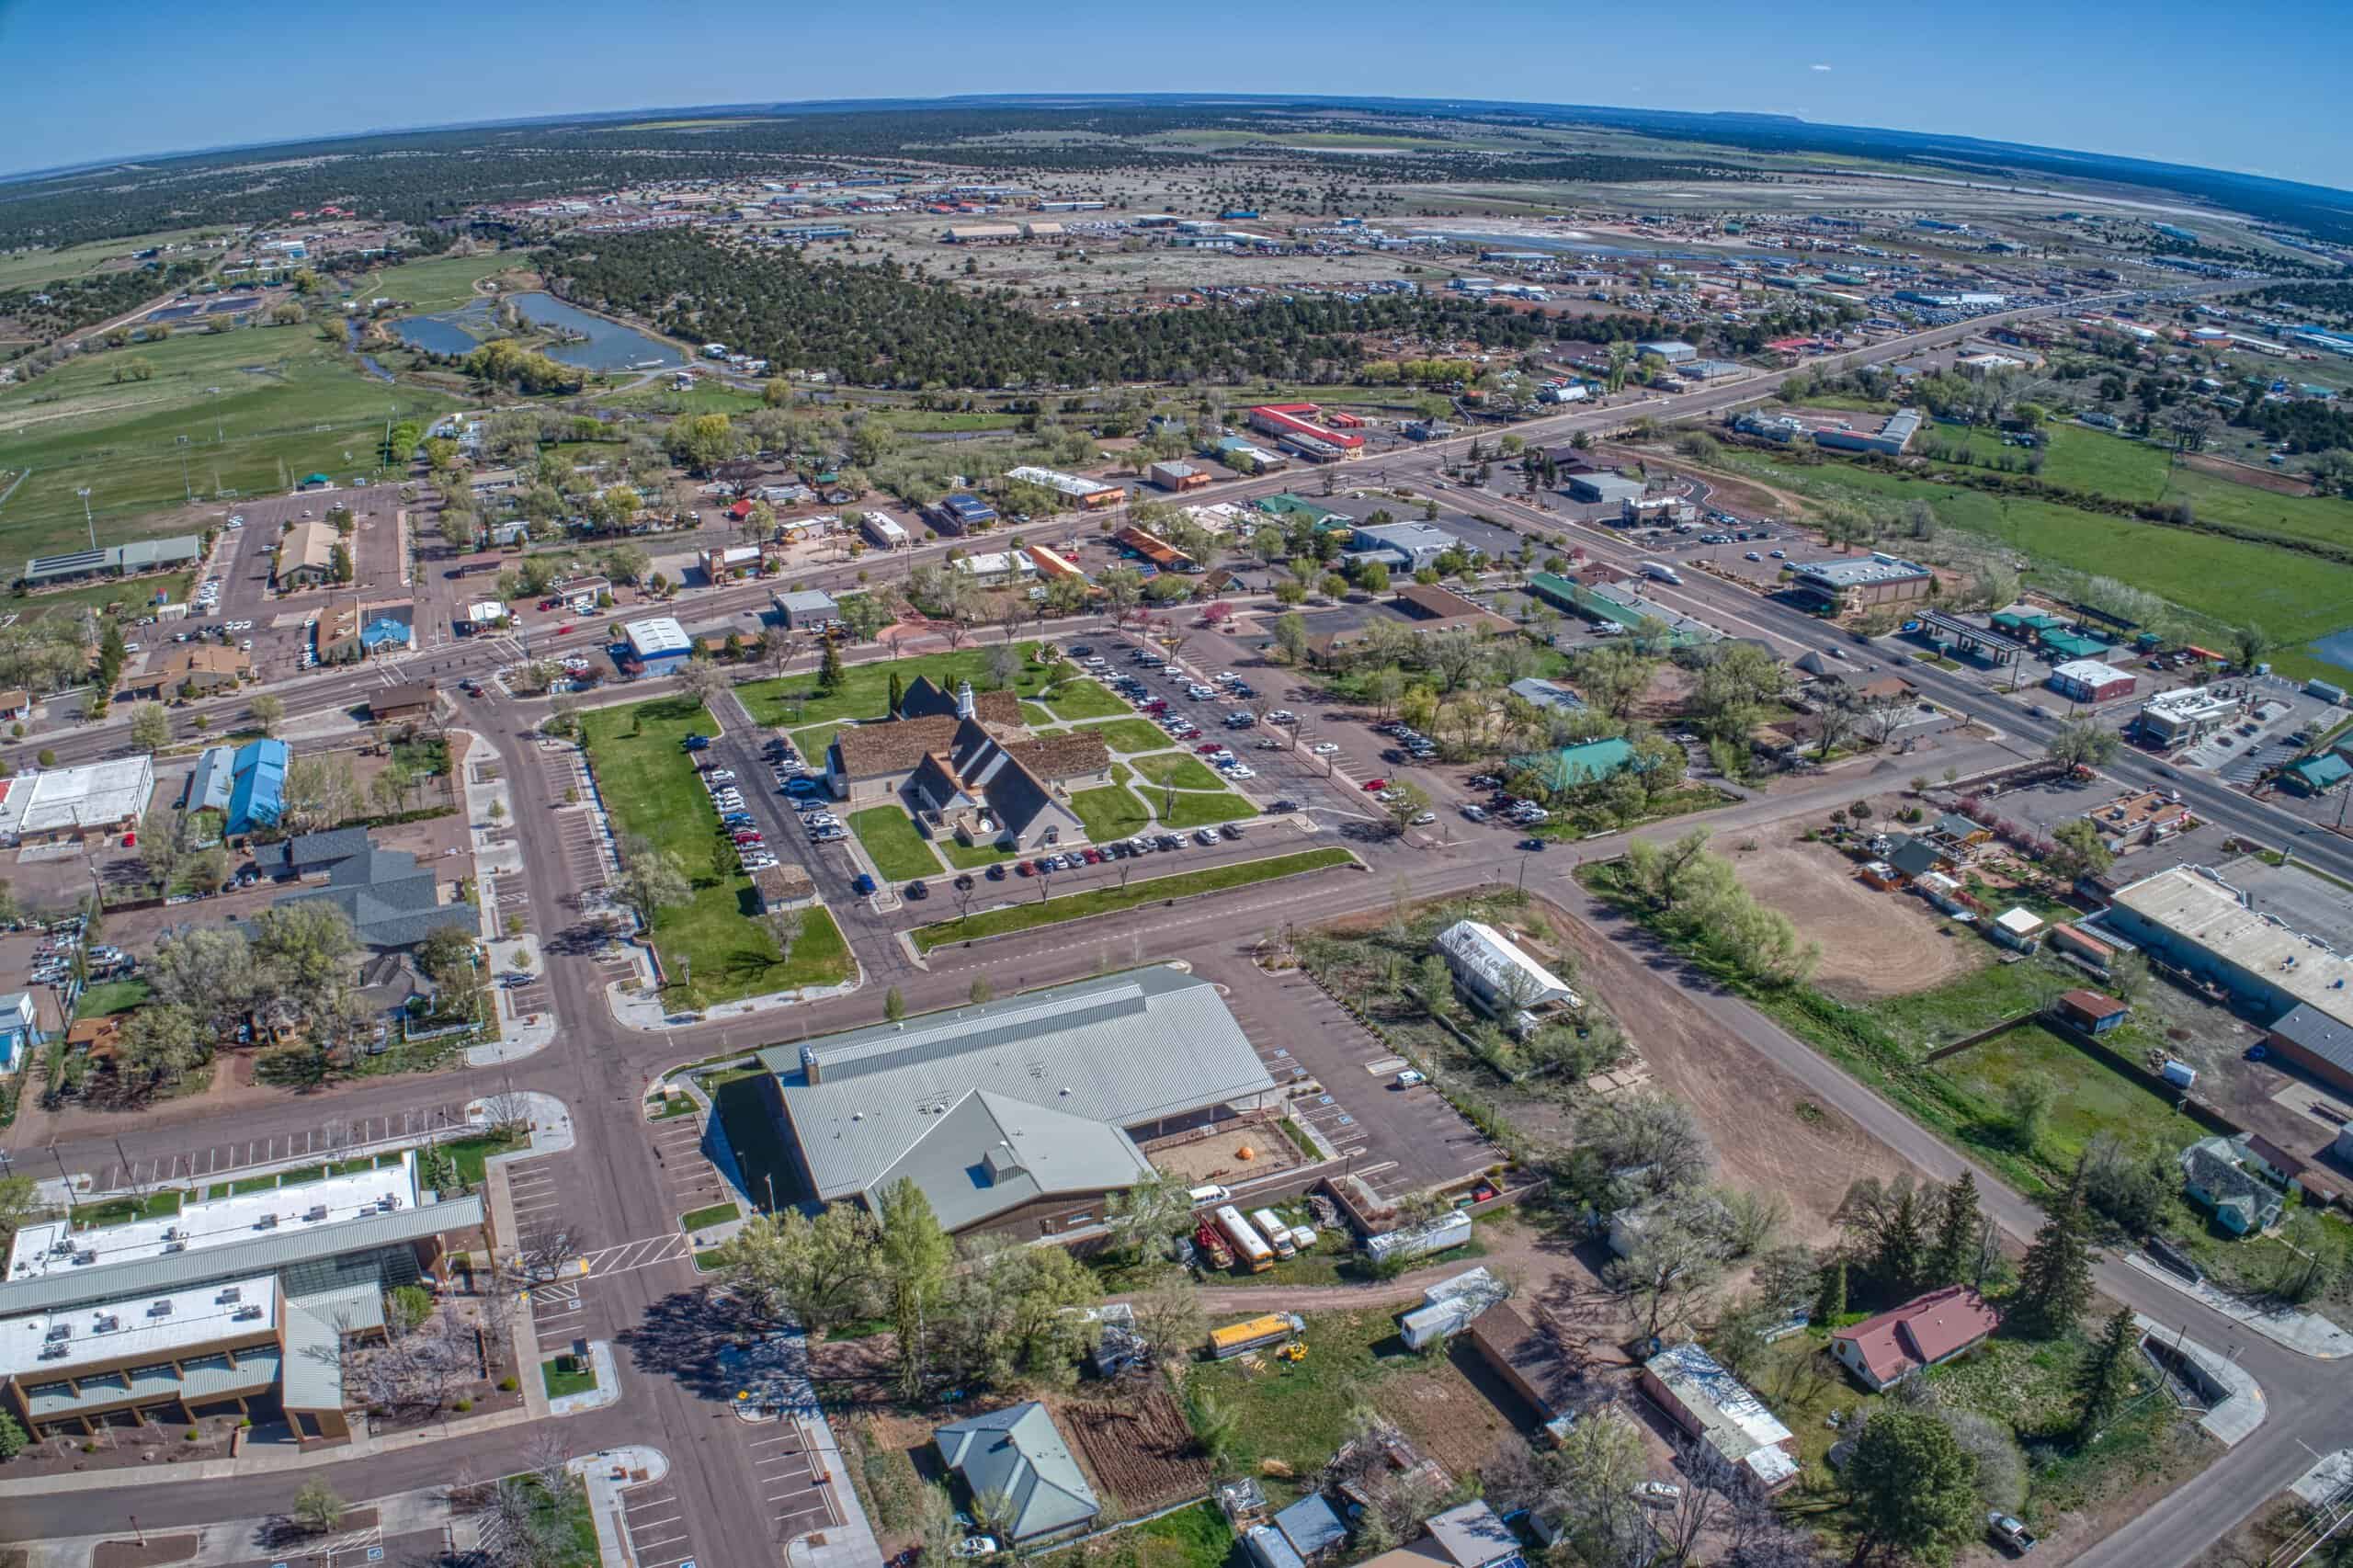
- Population change by 2100: -64.9% (from 11,732 in 2020 to 4,117 in 2100)
- Current population trend from 2000-2020: moderately increasing
- Median household income: $57,406 (vs $75,149 nationwide)
- Poverty rate: 12.6% (vs. 12.5% nationwide)
- Unemployment rate: 6.5% (vs. 5.3% nationwide)
- Bachelor’s degree attainment rate: 28.5% (vs. 34.3% nationwide)
2. Greenville, Mississippi
- Population change by 2100: -67.7% (from 29,670 in 2020 to 9,594 in 2100)
- Current population trend from 2000-2020: moderately depopulating
- Median household income: $35,148 (vs $75,149 nationwide)
- Poverty rate: 32.2% (vs. 12.5% nationwide)
- Unemployment rate: 11.5% (vs. 5.3% nationwide)
- Bachelor’s degree attainment rate: 20.5% (vs. 34.3% nationwide)
1. Pine Bluff, Arkansas
- Population change by 2100: -67.8% (from 41,253 in 2020 to 13,286 in 2100)
- Current population trend from 2000-2020: moderately depopulating
- Median household income: $39,411 (vs $75,149 nationwide)
- Poverty rate: 24.9% (vs. 12.5% nationwide)
- Unemployment rate: 9.8% (vs. 5.3% nationwide)
- Bachelor’s degree attainment rate: 22.2% (vs. 34.3% nationwide)
Get Ready To Retire (Sponsored)
Start by taking a quick retirement quiz from SmartAsset that will match you with up to 3 financial advisors that serve your area and beyond in 5 minutes, or less.
Each advisor has been vetted by SmartAsset and is held to a fiduciary standard to act in your best interests.
Here’s how it works:
1. Answer SmartAsset advisor match quiz
2. Review your pre-screened matches at your leisure. Check out the advisors’ profiles.
3. Speak with advisors at no cost to you. Have an introductory call on the phone or introduction in person and choose whom to work with in the future
Get started right here.
The post US Cities Experiencing Rapid Population Loss appeared first on 24/7 Wall St..