Will America’s downtowns recover after the downturn from the global pandemic? Digital technology and working from home have reduced the need for many of America’s workers to make the commute into a busy downtown every day. When employees aren’t heading downtown for jobs, it affects restaurants, retail, and other downtown businesses. Though some American downtowns are rebounding, many have experienced severe population declines in the past 10 years. One American city in particular has reduced its population by nearly 40% in a ten year time span. The population of Albany, Georgia’s downtown has declined by 39.3%.
To determine the cities with shrinking downtowns, 24/7 Wall St. reviewed five-year data on population change from the U.S. Census Bureau’s 2022 American Community Survey. Cities were ranked based on the percentage change in population in downtown census tracts from 2012 to 2022. Downtown areas were defined as the census tracts that fall at least 50% within the 1.8-mile radius around a city hall. Non-downtown areas were defined as the census tracts that fall at least 50% within a city’s boundaries, yet less than 50% within the 1.8-mile radius around city hall. Boundary definitions are from the U.S. Census Bureau and are for 2022. Only principal cities of metropolitan statistical areas were considered. City hall coordinates as well as supplemental data on income are also from the Census Bureau.
Some of the cities on our list are experiencing not only downtown population loss but overall population loss as well. Although in some locations, downtowns are shrinking, while non-downtown tracts are experiencing population growth, suggesting people may be moving from declining downtowns to the suburbs. In other cities, such as some Midwestern cities on the list that have known decades of economic struggles, populations have generally been declining — including in their downtown areas. (Some of the cities on this list are also among America’s fastest shrinking big cities.)
Geographically, 10 of the cities on the list are from the Midwest. However, the region with the most cities on the list is the South, with 26 cities, including 10 in Texas alone. Georgia has the second most cities on the list, at four, including the city whose downtown shrank the most from 2012 to 2022.
Why This Matters
American downtowns and city centers have an overall impact on the health of the local economy. When downtowns are thriving; property values go up, jobs are plentiful, and tax revenues are generated. Furthermore, urban sprawl is reduced and people can rely on walking or public transportation to get to jobs, schools, parks, and restaurants.
Here are 40 American cities with shrinking downtowns:
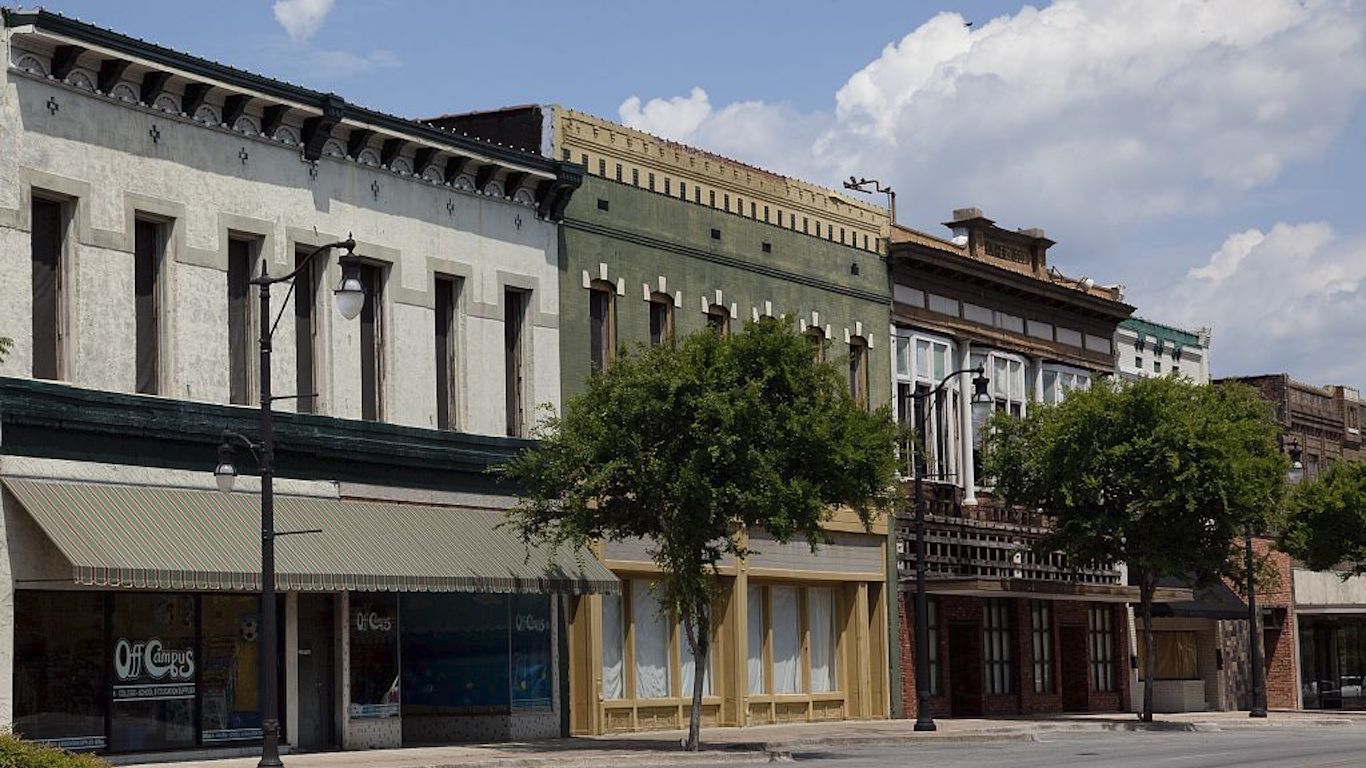
40. San Angelo, Texas
- Population change in downtown tracts from 2012 to 2022: -10.3%
- Population change of non-downtown tracts from 2012 to 2022: +8.7%
- Per capita income change in downtown tracts from 2012 to 2022: +21.3%
- Per capita income change in non-downtown tracts from 2012 to 2022: +15.5%
39. San Antonio, Texas

- Population change in downtown tracts from 2012 to 2022: -10.6%
- Population change of non-downtown tracts from 2012 to 2022: +7.5%
- Per capita income change in downtown tracts from 2012 to 2022: +28.5%
- Per capita income change in non-downtown tracts from 2012 to 2022: +8.0%
38. St. Joseph, Missouri
- Population change in downtown tracts from 2012 to 2022: -10.9%
- Population change of non-downtown tracts from 2012 to 2022: -1.7%
- Per capita income change in downtown tracts from 2012 to 2022: +9.1%
- Per capita income change in non-downtown tracts from 2012 to 2022: +11.5%
37. Springfield, Illinois

- Population change in downtown tracts from 2012 to 2022: -10.9%
- Population change of non-downtown tracts from 2012 to 2022: -2.0%
- Per capita income change in downtown tracts from 2012 to 2022: +9.5%
- Per capita income change in non-downtown tracts from 2012 to 2022: +8.2%
36. Youngstown, Ohio
- Population change in downtown tracts from 2012 to 2022: -11.1%
- Population change of non-downtown tracts from 2012 to 2022: -7.4%
- Per capita income change in downtown tracts from 2012 to 2022: +21.5%
- Per capita income change in non-downtown tracts from 2012 to 2022: +2.2%
35. Canton, Ohio

- Population change in downtown tracts from 2012 to 2022: -11.3%
- Population change of non-downtown tracts from 2012 to 2022: -2.8%
- Per capita income change in downtown tracts from 2012 to 2022: +4.6%
- Per capita income change in non-downtown tracts from 2012 to 2022: +11.1%
34. Brownsville, Texas
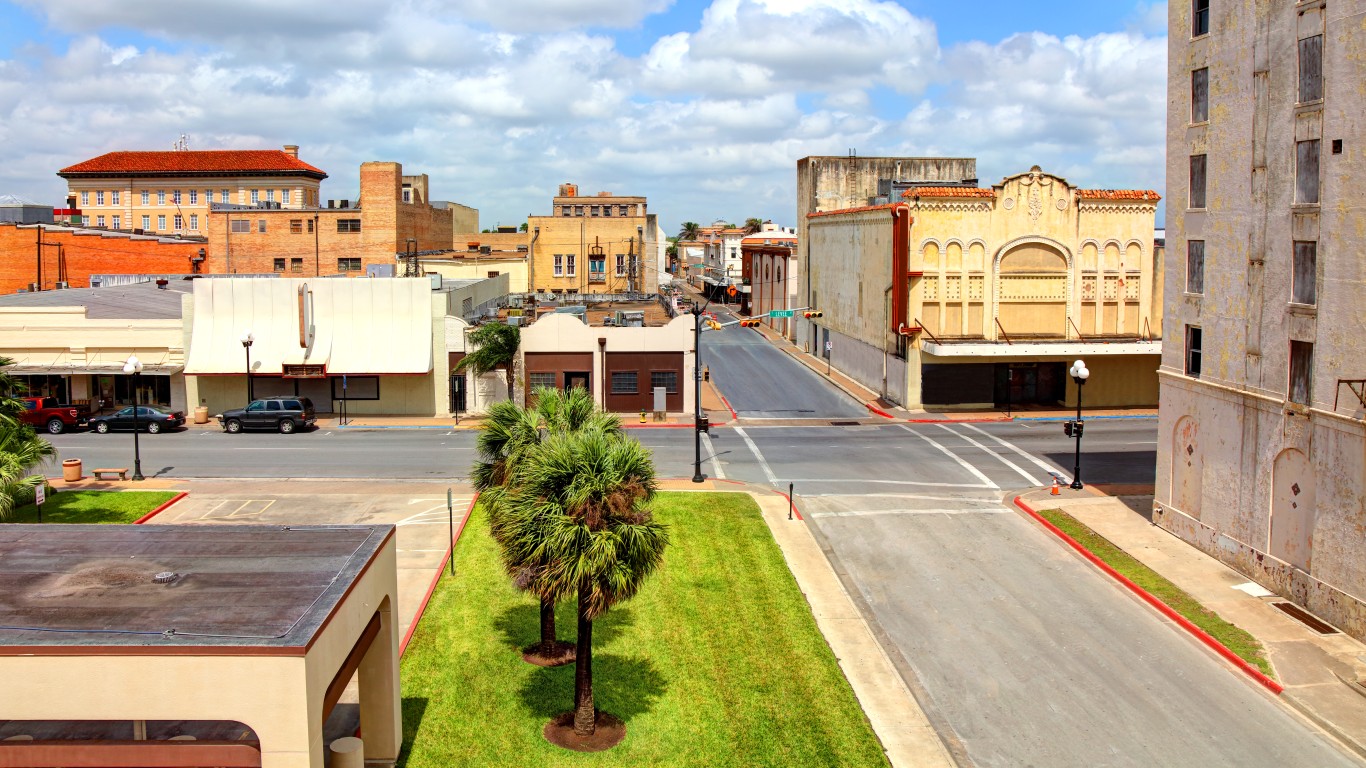
- Population change in downtown tracts from 2012 to 2022: -11.5%
- Population change of non-downtown tracts from 2012 to 2022: +0.6%
- Per capita income change in downtown tracts from 2012 to 2022: +11.5%
- Per capita income change in non-downtown tracts from 2012 to 2022: +9.8%
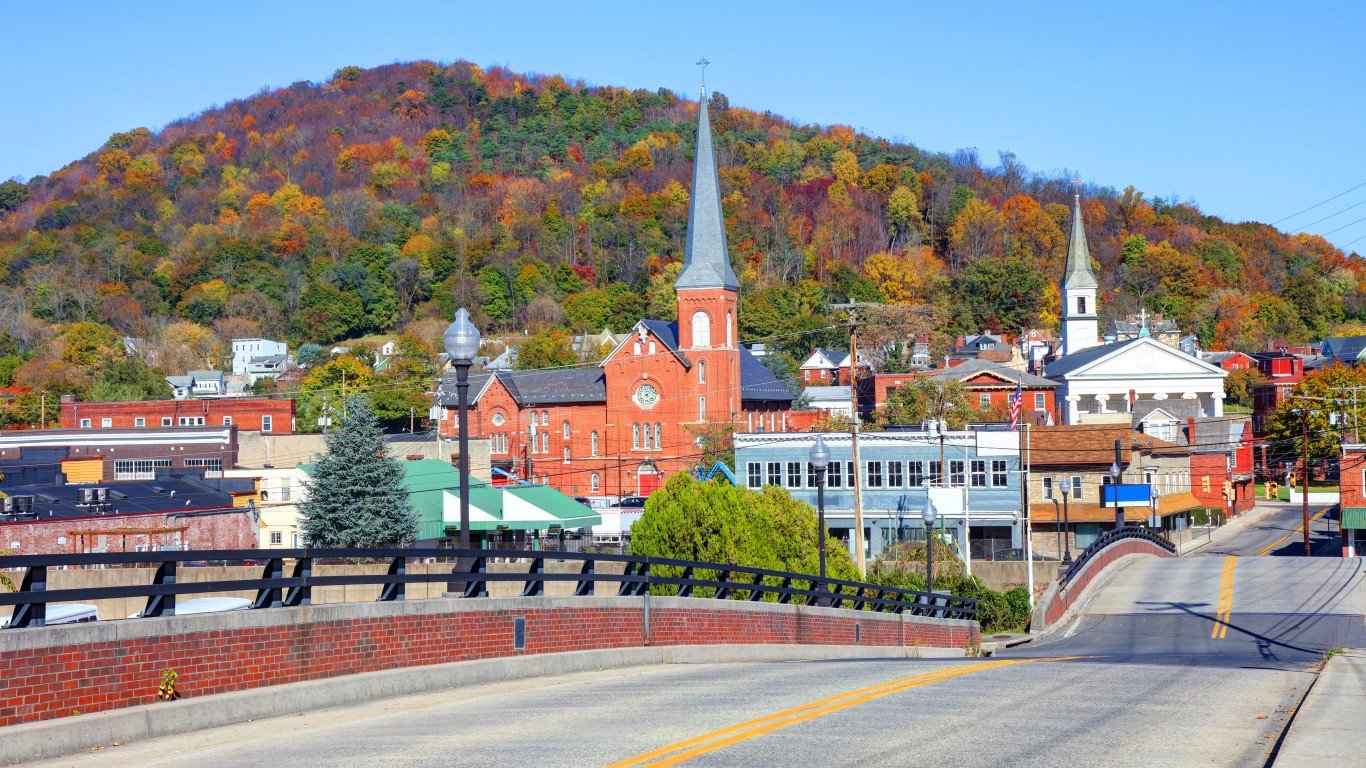
33. Johnstown, Pennsylvania
- Population change in downtown tracts from 2012 to 2022: -11.6%
- Population change of non-downtown tracts from 2012 to 2022: -12.4%
- Per capita income change in downtown tracts from 2012 to 2022: +23.9%
- Per capita income change in non-downtown tracts from 2012 to 2022: -1.5%
32. Amarillo, Texas
- Population change in downtown tracts from 2012 to 2022: -11.6%
- Population change of non-downtown tracts from 2012 to 2022: +1.8%
- Per capita income change in downtown tracts from 2012 to 2022: +14.1%
- Per capita income change in non-downtown tracts from 2012 to 2022: +6.2%
31. Hattiesburg, Mississippi

- Population change in downtown tracts from 2012 to 2022: -11.7%
- Population change of non-downtown tracts from 2012 to 2022: +9.2%
- Per capita income change in downtown tracts from 2012 to 2022: +21.2%
- Per capita income change in non-downtown tracts from 2012 to 2022: +0.8%
30. Valdosta, Georgia

- Population change in downtown tracts from 2012 to 2022: -12.6%
- Population change of non-downtown tracts from 2012 to 2022: +4.5%
- Per capita income change in downtown tracts from 2012 to 2022: +26.0%
- Per capita income change in non-downtown tracts from 2012 to 2022: +5.0%
29. El Paso, Texas
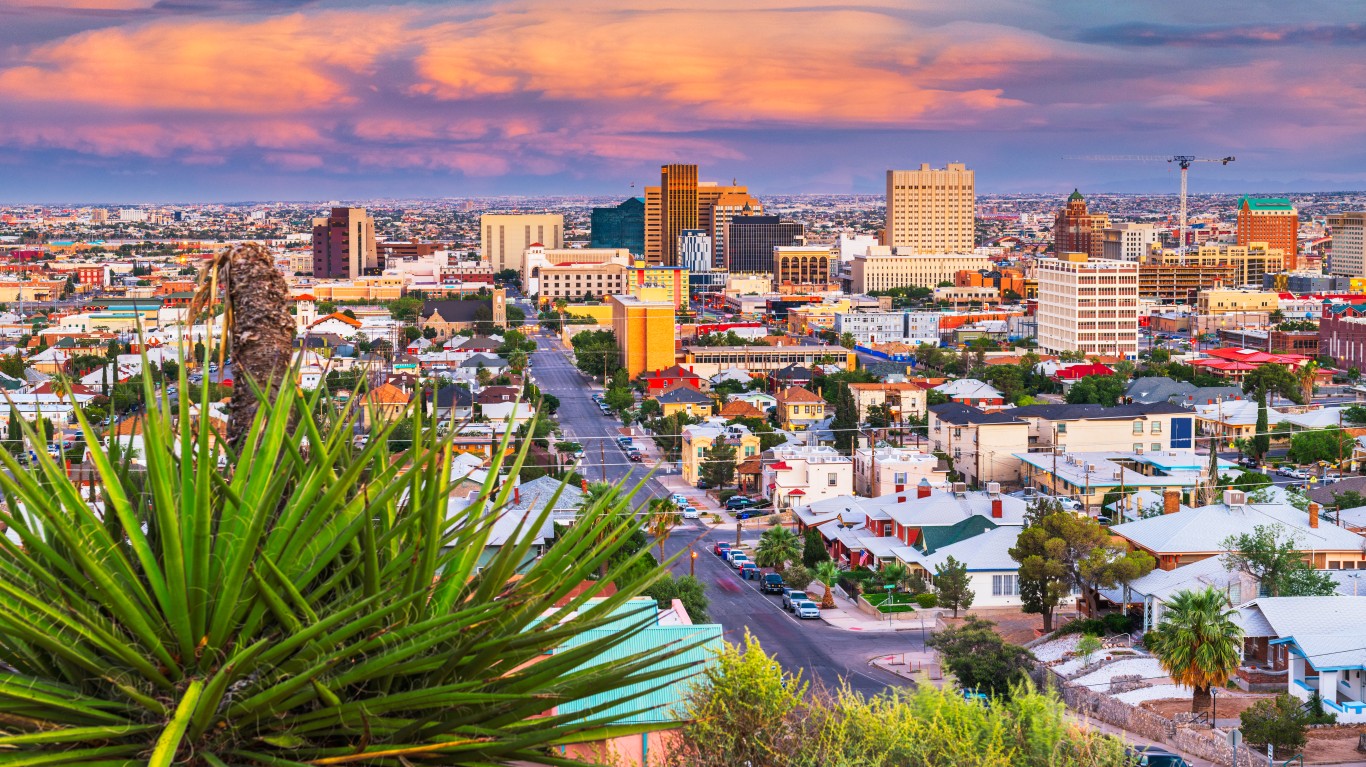
- Population change in downtown tracts from 2012 to 2022: -12.7%
- Population change of non-downtown tracts from 2012 to 2022: -3.2%
- Per capita income change in downtown tracts from 2012 to 2022: +17.9%
- Per capita income change in non-downtown tracts from 2012 to 2022: +8.5%
28. Jackson, Mississippi

- Population change in downtown tracts from 2012 to 2022: -13.2%
- Population change of non-downtown tracts from 2012 to 2022: -12.6%
- Per capita income change in downtown tracts from 2012 to 2022: +33.1%
- Per capita income change in non-downtown tracts from 2012 to 2022: +5.4%
27. Casper, Wyoming
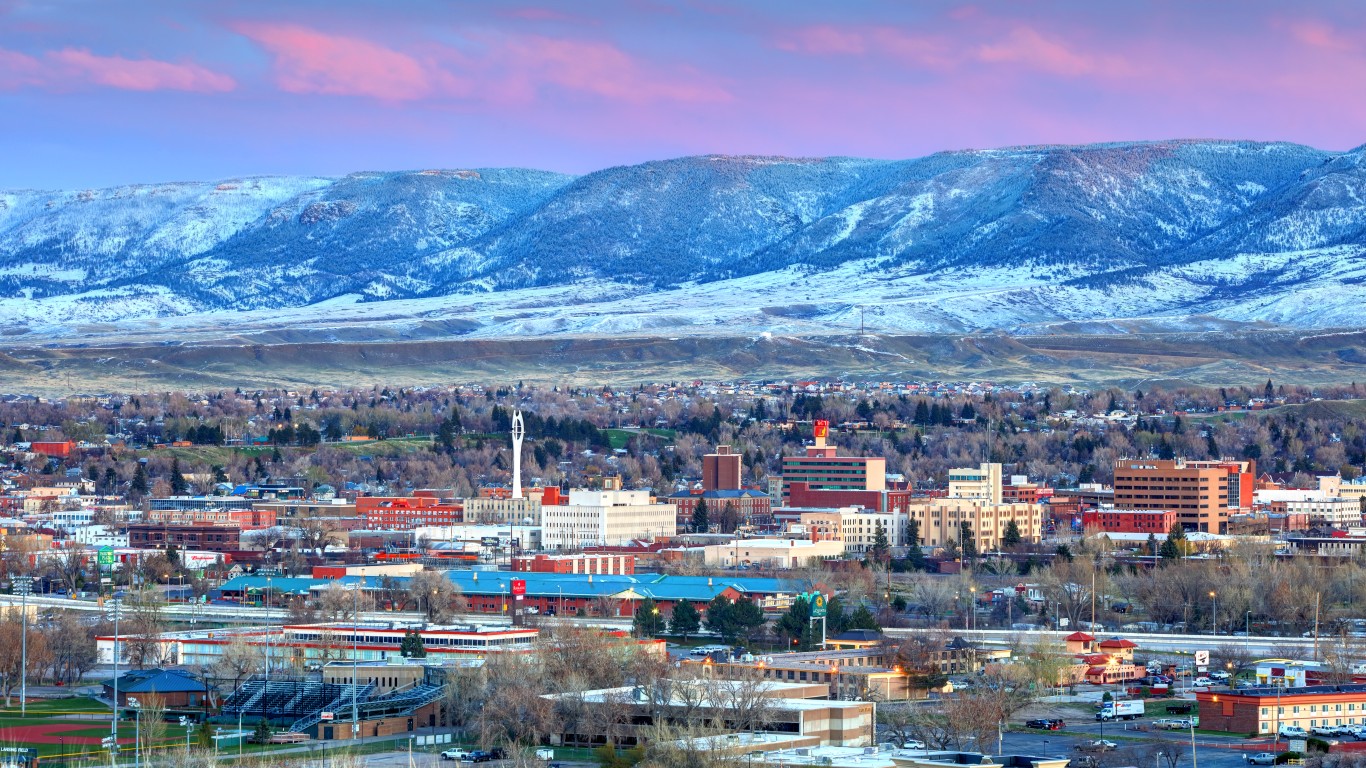
- Population change in downtown tracts from 2012 to 2022: -13.2%
- Population change of non-downtown tracts from 2012 to 2022: +1.5%
- Per capita income change in downtown tracts from 2012 to 2022: +11.6%
- Per capita income change in non-downtown tracts from 2012 to 2022: -3.6%
26. Gadsden, Alabama
- Population change in downtown tracts from 2012 to 2022: -13.3%
- Population change of non-downtown tracts from 2012 to 2022: -6.4%
- Per capita income change in downtown tracts from 2012 to 2022: +5.2%
- Per capita income change in non-downtown tracts from 2012 to 2022: +7.4%
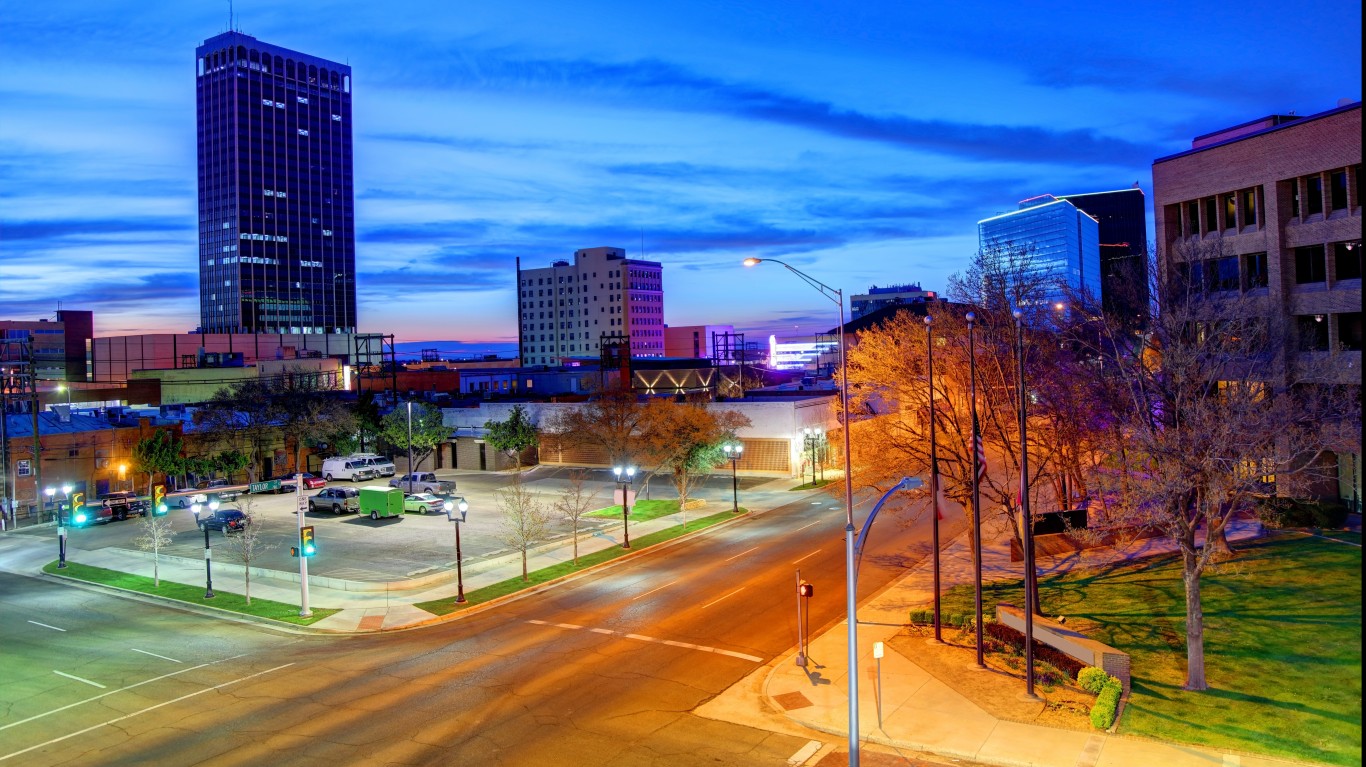
25. Abilene, Texas
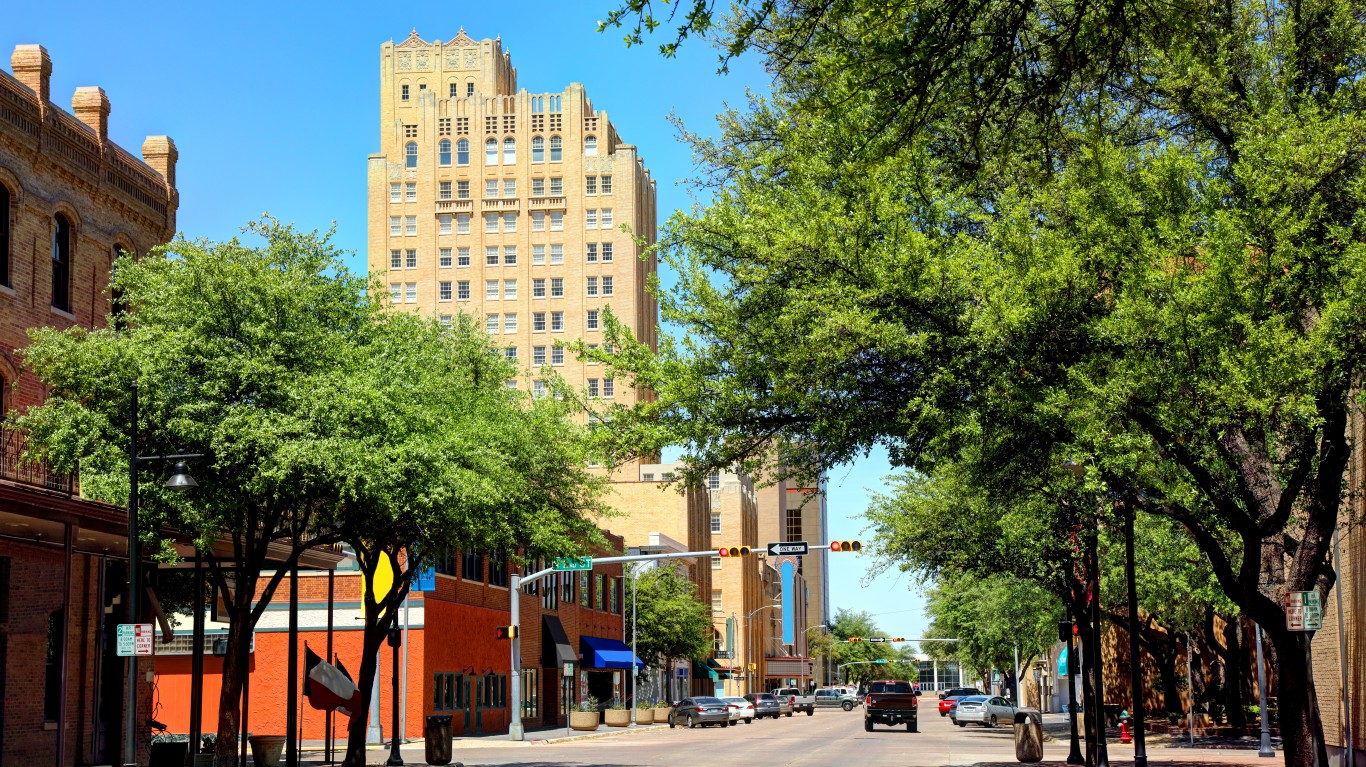
- Population change in downtown tracts from 2012 to 2022: -13.3%
- Population change of non-downtown tracts from 2012 to 2022: +3.3%
- Per capita income change in downtown tracts from 2012 to 2022: +4.8%
- Per capita income change in non-downtown tracts from 2012 to 2022: +7.5%
24. Cumberland, Maryland
- Population change in downtown tracts from 2012 to 2022: -13.4%
- Population change of non-downtown tracts from 2012 to 2022: -7.4%
- Per capita income change in downtown tracts from 2012 to 2022: +5.1%
- Per capita income change in non-downtown tracts from 2012 to 2022: +14.8%
23. Panama City, Florida
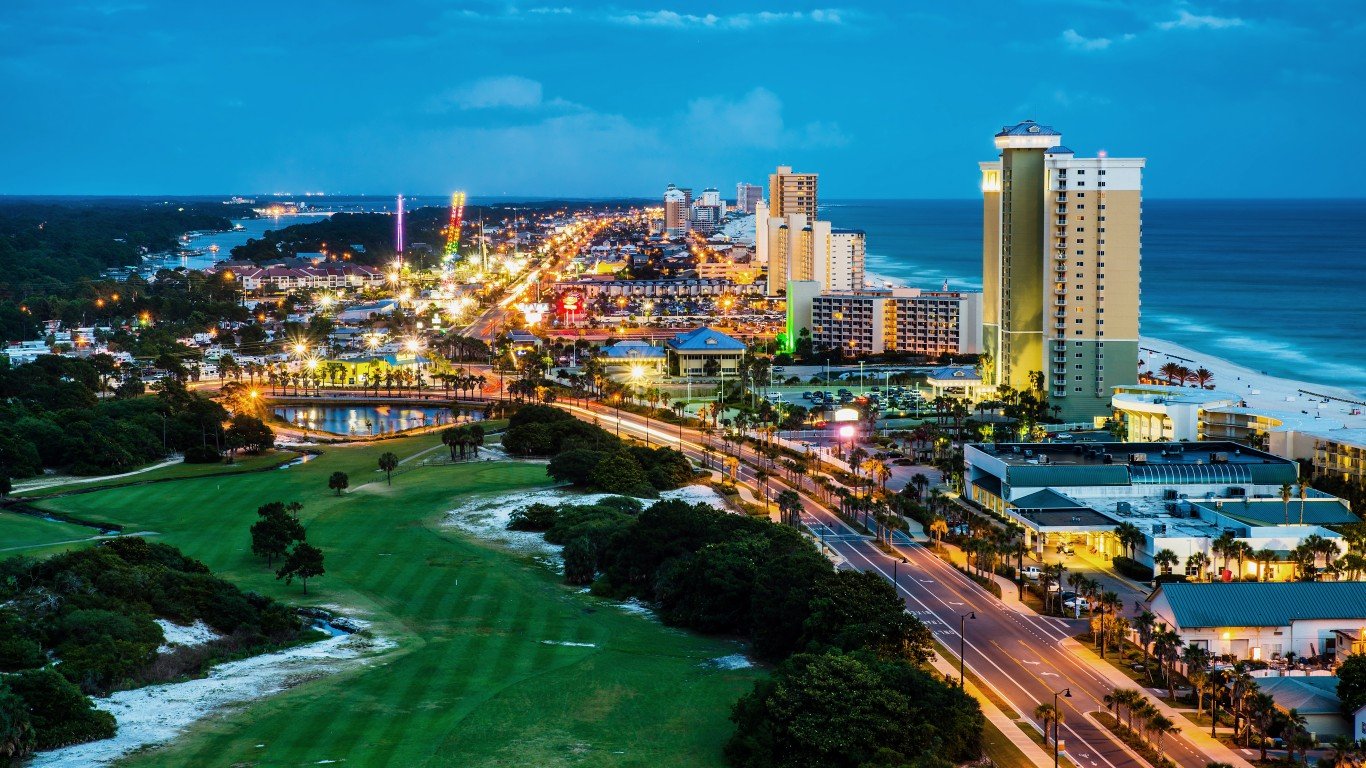
- Population change in downtown tracts from 2012 to 2022: -13.8%
- Population change of non-downtown tracts from 2012 to 2022: -7.9%
- Per capita income change in downtown tracts from 2012 to 2022: +20.6%
- Per capita income change in non-downtown tracts from 2012 to 2022: +17.1%
22. Decatur, Illinois

- Population change in downtown tracts from 2012 to 2022: -14.7%
- Population change of non-downtown tracts from 2012 to 2022: -7.4%
- Per capita income change in downtown tracts from 2012 to 2022: +9.4%
- Per capita income change in non-downtown tracts from 2012 to 2022: +6.2%
21. Kankakee, Illinois
- Population change in downtown tracts from 2012 to 2022: -14.9%
- Population change of non-downtown tracts from 2012 to 2022: +3.6%
- Per capita income change in downtown tracts from 2012 to 2022: +19.4%
- Per capita income change in non-downtown tracts from 2012 to 2022: +2.7%
20. Naples, Florida

- Population change in downtown tracts from 2012 to 2022: -15.0%
- Population change of non-downtown tracts from 2012 to 2022: +3.3%
- Per capita income change in downtown tracts from 2012 to 2022: +31.1%
- Per capita income change in non-downtown tracts from 2012 to 2022: +29.3%
19. Laredo, Texas
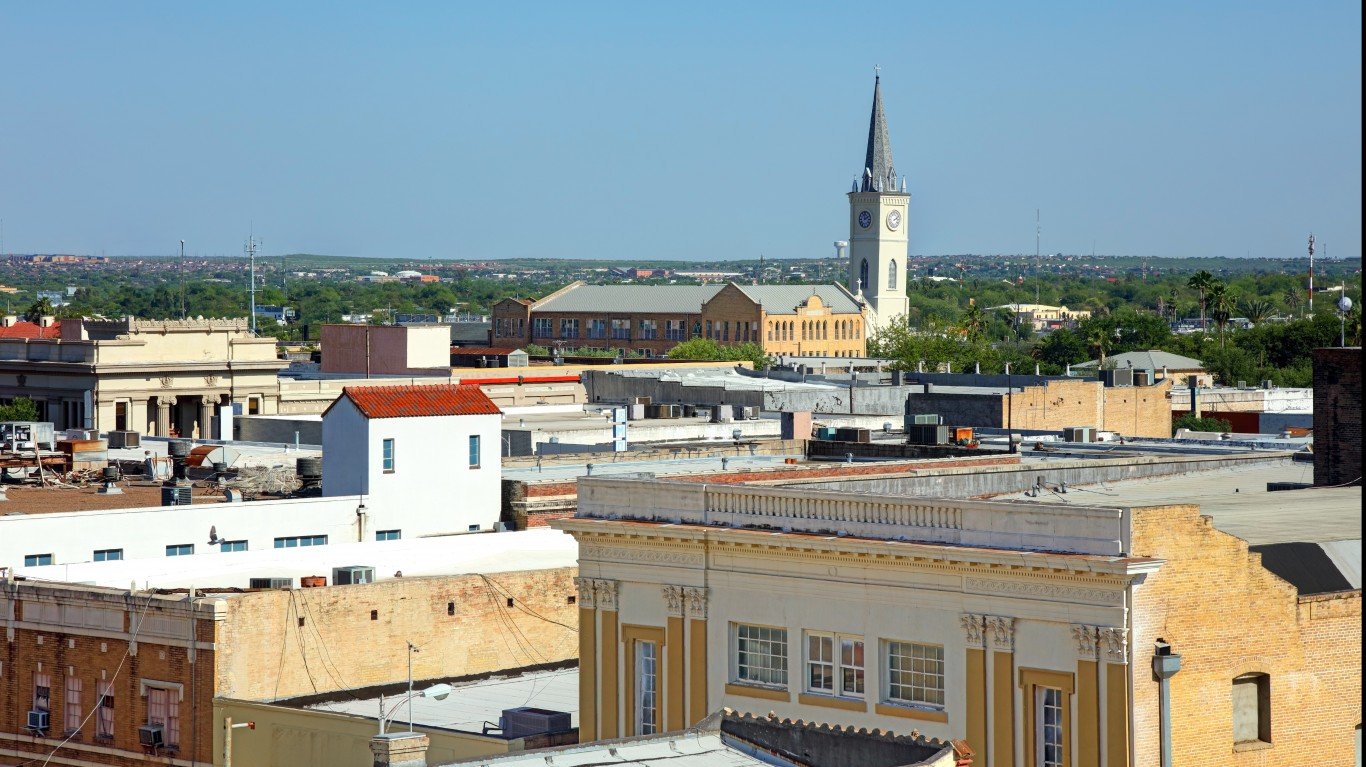
- Population change in downtown tracts from 2012 to 2022: -15.4%
- Population change of non-downtown tracts from 2012 to 2022: +5.4%
- Per capita income change in downtown tracts from 2012 to 2022: +27.8%
- Per capita income change in non-downtown tracts from 2012 to 2022: +22.2%
18. Evansville, Indiana
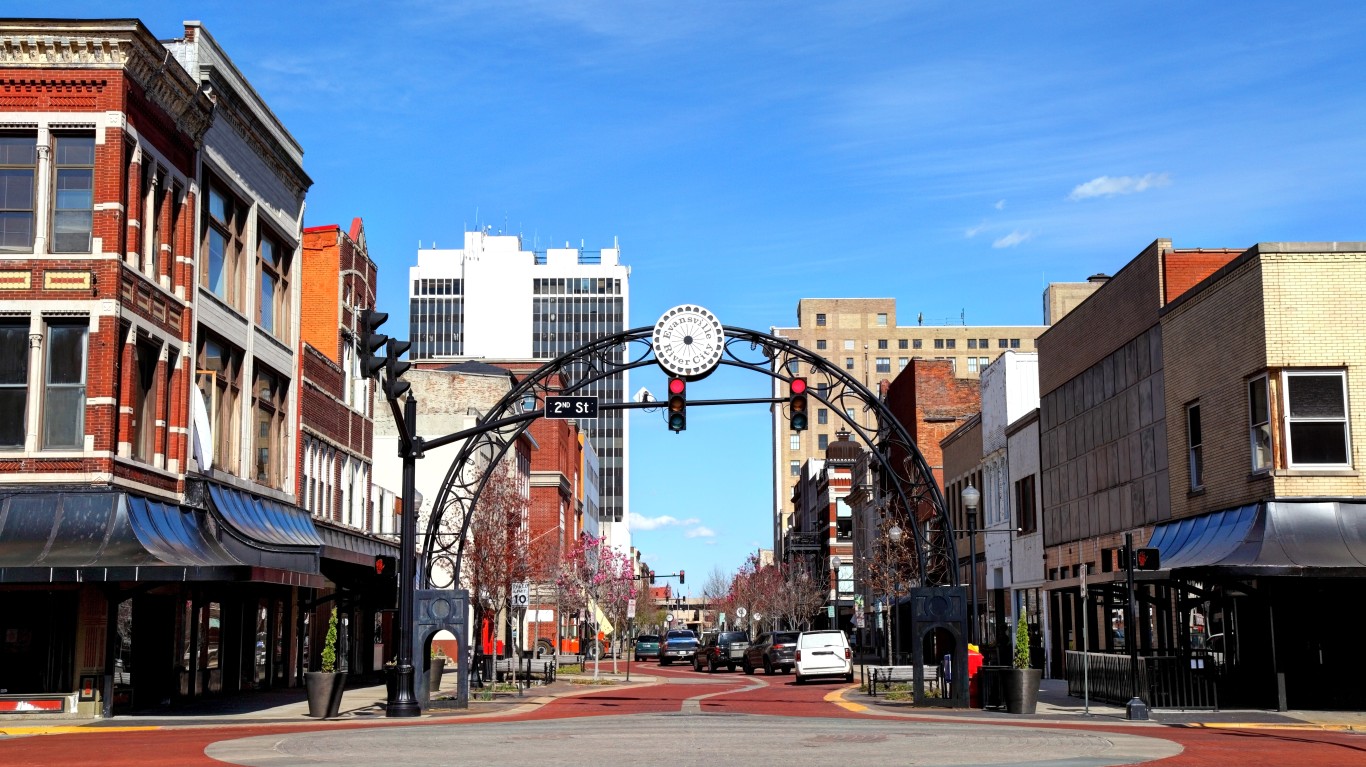
- Population change in downtown tracts from 2012 to 2022: -15.6%
- Population change of non-downtown tracts from 2012 to 2022: +0.2%
- Per capita income change in downtown tracts from 2012 to 2022: +10.5%
- Per capita income change in non-downtown tracts from 2012 to 2022: +8.6%
17. Lima, Ohio
- Population change in downtown tracts from 2012 to 2022: -16.0%
- Population change of non-downtown tracts from 2012 to 2022: +8.3%
- Per capita income change in downtown tracts from 2012 to 2022: +17.7%
- Per capita income change in non-downtown tracts from 2012 to 2022: -1.3%
16. Flint, Michigan

- Population change in downtown tracts from 2012 to 2022: -16.9%
- Population change of non-downtown tracts from 2012 to 2022: -22.0%
- Per capita income change in downtown tracts from 2012 to 2022: +19.1%
- Per capita income change in non-downtown tracts from 2012 to 2022: +7.1%
15. Yuma, Arizona

- Population change in downtown tracts from 2012 to 2022: -17.0%
- Population change of non-downtown tracts from 2012 to 2022: -5.4%
- Per capita income change in downtown tracts from 2012 to 2022: +23.6%
- Per capita income change in non-downtown tracts from 2012 to 2022: +19.6%
14. Bangor, Maine
- Population change in downtown tracts from 2012 to 2022: -17.2%
- Population change of non-downtown tracts from 2012 to 2022: +4.4%
- Per capita income change in downtown tracts from 2012 to 2022: +25.7%
- Per capita income change in non-downtown tracts from 2012 to 2022: +16.7%
13. Victoria, Texas
- Population change in downtown tracts from 2012 to 2022: -17.8%
- Population change of non-downtown tracts from 2012 to 2022: +5.7%
- Per capita income change in downtown tracts from 2012 to 2022: -6.3%
- Per capita income change in non-downtown tracts from 2012 to 2022: +2.1%
12. Topeka, Kansas
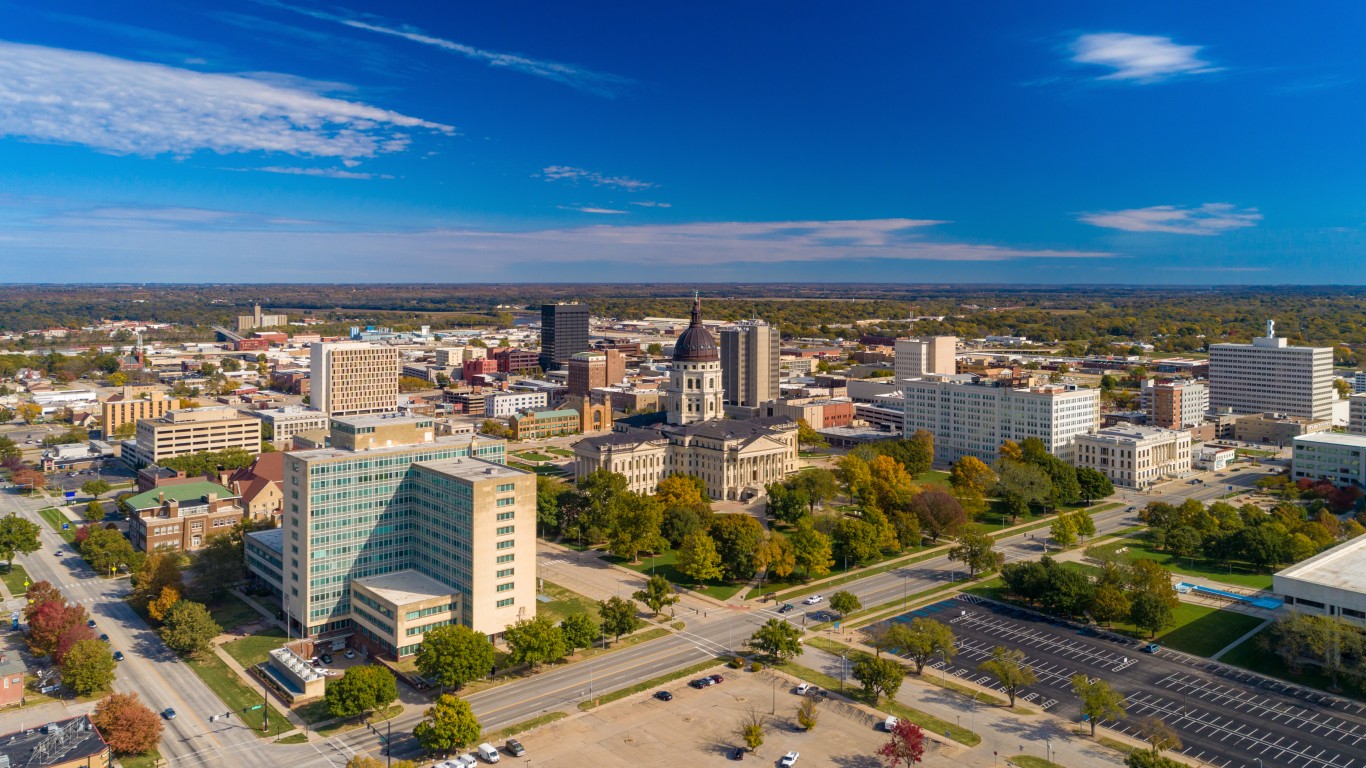
- Population change in downtown tracts from 2012 to 2022: -18.4%
- Population change of non-downtown tracts from 2012 to 2022: +3.2%
- Per capita income change in downtown tracts from 2012 to 2022: +33.2%
- Per capita income change in non-downtown tracts from 2012 to 2022: +5.0%
11. Savannah, Georgia
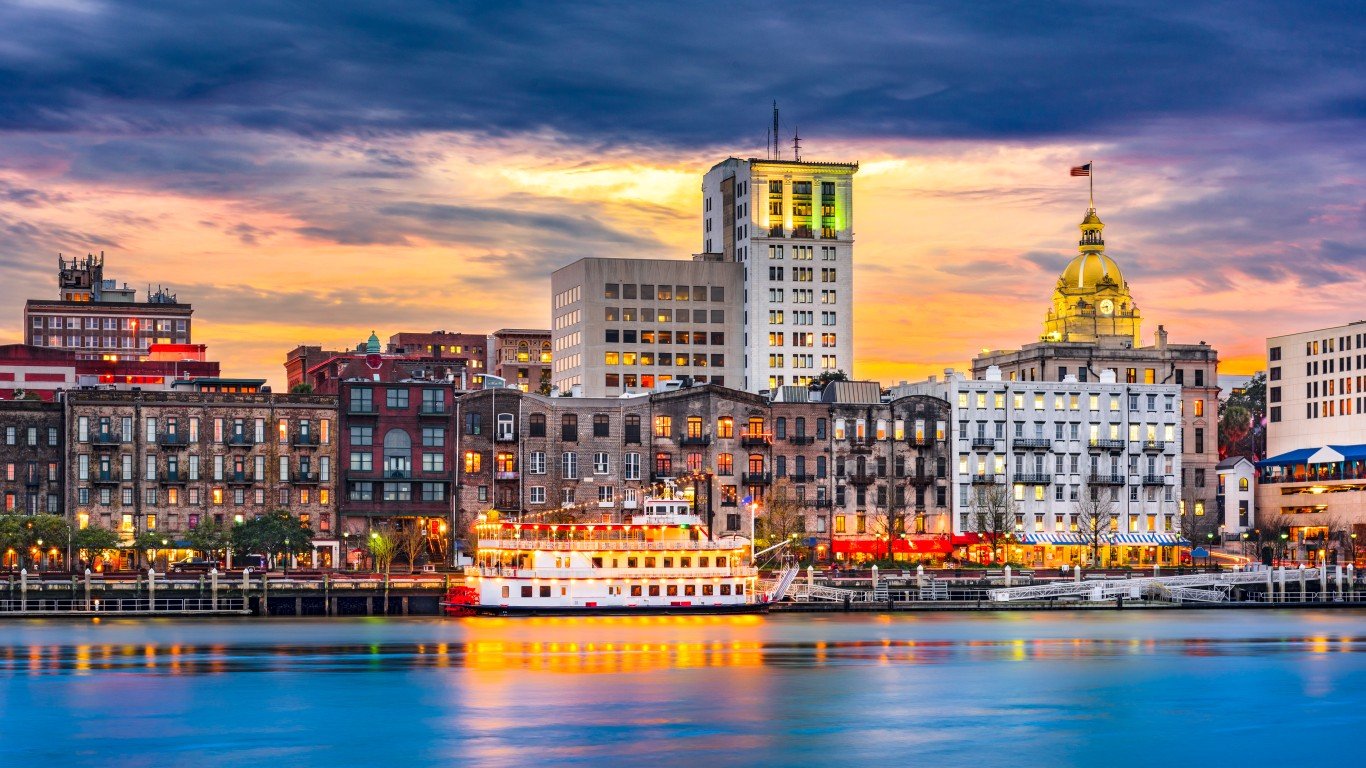
- Population change in downtown tracts from 2012 to 2022: -18.4%
- Population change of non-downtown tracts from 2012 to 2022: +1.8%
- Per capita income change in downtown tracts from 2012 to 2022: +76.9%
- Per capita income change in non-downtown tracts from 2012 to 2022: +15.2%
10. Texarkana, Texas
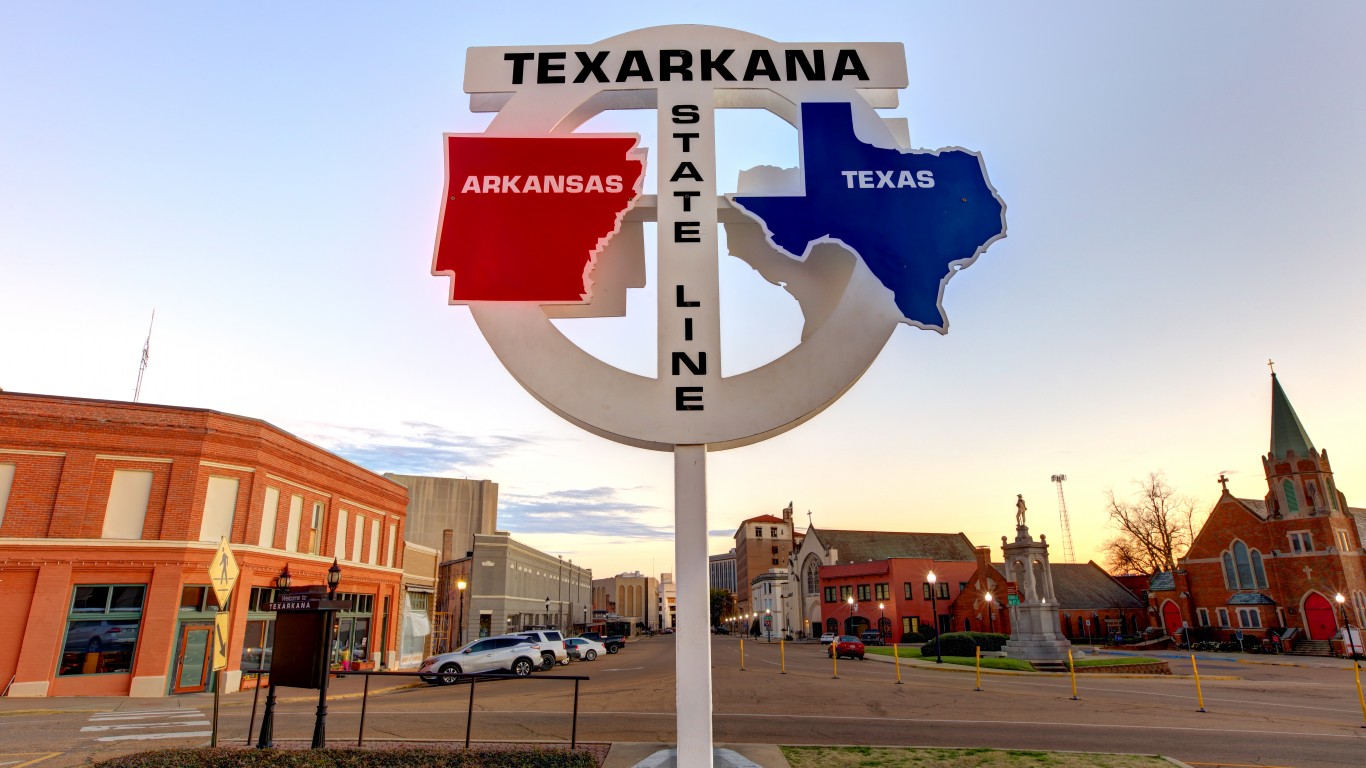
- Population change in downtown tracts from 2012 to 2022: -19.9%
- Population change of non-downtown tracts from 2012 to 2022: -2.2%
- Per capita income change in downtown tracts from 2012 to 2022: +28.7%
- Per capita income change in non-downtown tracts from 2012 to 2022: +1.3%
9. Saginaw, Michigan
- Population change in downtown tracts from 2012 to 2022: -20.2%
- Population change of non-downtown tracts from 2012 to 2022: -11.8%
- Per capita income change in downtown tracts from 2012 to 2022: +26.4%
- Per capita income change in non-downtown tracts from 2012 to 2022: -0.6%
8. Sumter, South Carolina

- Population change in downtown tracts from 2012 to 2022: -21.0%
- Population change of non-downtown tracts from 2012 to 2022: +9.6%
- Per capita income change in downtown tracts from 2012 to 2022: -7.5%
- Per capita income change in non-downtown tracts from 2012 to 2022: -9.5%
7. Shreveport, Louisiana

- Population change in downtown tracts from 2012 to 2022: -21.0%
- Population change of non-downtown tracts from 2012 to 2022: -8.9%
- Per capita income change in downtown tracts from 2012 to 2022: +92.2%
- Per capita income change in non-downtown tracts from 2012 to 2022: -1.2%
6. Alexandria, Louisiana
- Population change in downtown tracts from 2012 to 2022: -21.3%
- Population change of non-downtown tracts from 2012 to 2022: -1.0%
- Per capita income change in downtown tracts from 2012 to 2022: +29.3%
- Per capita income change in non-downtown tracts from 2012 to 2022: -10.3%
5. Anniston, Alabama
- Population change in downtown tracts from 2012 to 2022: -22.2%
- Population change of non-downtown tracts from 2012 to 2022: +5.9%
- Per capita income change in downtown tracts from 2012 to 2022: +10.5%
- Per capita income change in non-downtown tracts from 2012 to 2022: +4.9%
4. Birmingham, Alabama

- Population change in downtown tracts from 2012 to 2022: -22.5%
- Population change of non-downtown tracts from 2012 to 2022: -9.6%
- Per capita income change in downtown tracts from 2012 to 2022: +28.7%
- Per capita income change in non-downtown tracts from 2012 to 2022: +15.6%
3. Columbus, Georgia
- Population change in downtown tracts from 2012 to 2022: -25.4%
- Population change of non-downtown tracts from 2012 to 2022: +3.6%
- Per capita income change in downtown tracts from 2012 to 2022: +41.4%
- Per capita income change in non-downtown tracts from 2012 to 2022: +1.0%
2. Pine Bluff, Arkansas
- Population change in downtown tracts from 2012 to 2022: -30.5%
- Population change of non-downtown tracts from 2012 to 2022: -10.0%
- Per capita income change in downtown tracts from 2012 to 2022: +19.1%
- Per capita income change in non-downtown tracts from 2012 to 2022: +1.4%
1. Albany, Georgia
- Population change in downtown tracts from 2012 to 2022: -39.3%
- Population change of non-downtown tracts from 2012 to 2022: -4.0%
- Per capita income change in downtown tracts from 2012 to 2022: +23.7%
- Per capita income change in non-downtown tracts from 2012 to 2022: +1.9%
Buffett Missed These Two…
Warren Buffett loves dividend stocks, and has stuffed Berkshire with some of his favorites.
But he overlooked two dividend legends that continue to print checks on a new level, they’re nowhere in his portfolio.
Unlock the two dividend legends Buffett missed in this new free report.
The post This American City Has Lost Nearly 40% of Its Downtown’s Population in Just 10 Years appeared first on 24/7 Wall St..