In September 2024, a 1-in-1,000-years weather event dumped over 18 inches of rain in Carolina Beach, North Carolina, and delivered another 15+ inches across the Wilmington area. The storm, named Potential Tropical Cyclone Eight, could cost over $7 billion, considering damage and economic loss. Potential tropical storms like this one can bring hurricane conditions to land, though it’s usually unclear whether the cyclone will develop. Considering the breadth of damage from this potential store, it’s clear that hurricanes can cause even more severe damage. Hurricanes can cause heavy rain, flash floods, storm surges, and even tornadoes in some cases. Since hurricane season lasts through the end of November, coastal areas of the Carolinas, as well as many other areas, are set to face more weather events over the coming months. (This is every $5 billion plus weather event since 2020.)
Wherever you’re living, you probably want to know whether you’re at risk of dealing with potentially severe hurricane — and, if so, how you can mitigate your risk. To identify the countries with the highest hurricane risk, 24/7 Wall St. reviewed data on natural hazard risks for U.S. counties from the March 2023 FEMA National Risk Index dataset. FEMA calculates the Hurricane Risk Index Score, which is essentially a community’s relative risk for hurricanes compared to the rest of the country. This score, as well as its overall rating and ranking, depends on the total expected economic loss, community resilience, population loss, and infrastructure. Supplemental data on the total value of all owner-occupied homes and population change due to net migration are from the U.S. Census Bureau. If you live in one of the areas on this list, make sure to follow hurricane preparedness tips — and pack an emergency kit. Better safe than sorry!
Why We’re Sharing This Information

Every year, it feels like climate change and global warming are just getting worse. Scientists are now predicting that these changes will increase the power of hurricanes, making them more intense than ever before (outranking the most powerful hurricanes of all time.) This list provides a good idea of where the hurricane risk is greatest. If you’re getting ready to relocate to one of these areas, being aware of what you might face is paramount. And if you live in one of these areas, staying safe means staying informed.
50. Kings County, NY

- FEMA hurricane risk index score: 97.80/100
- Total value of owner-occupied homes: $333.6 billion
- Population change due to net migration, 2017 to 2022: -7.7%
- County seat: Brooklyn
49. St. Tammany Parish, LA

- FEMA hurricane risk index score: 97.85/100
- Total value of owner-occupied homes: $24.3 billion
- Population change due to net migration, 2017 to 2022: +3.9%
- County seat: Covington
48. Terrebonne Parish, LA

- FEMA hurricane risk index score: 97.89/100
- Total value of owner-occupied homes: $7.2 billion
- Population change due to net migration, 2017 to 2022: -5.9%
- County seat: Houma
47. Monroe County, FL

- FEMA hurricane risk index score: 97.94/100
- Total value of owner-occupied homes: $19.0 billion
- Population change due to net migration, 2017 to 2022: -2.2%
- County seat: Key West
46. Dorchester County, SC
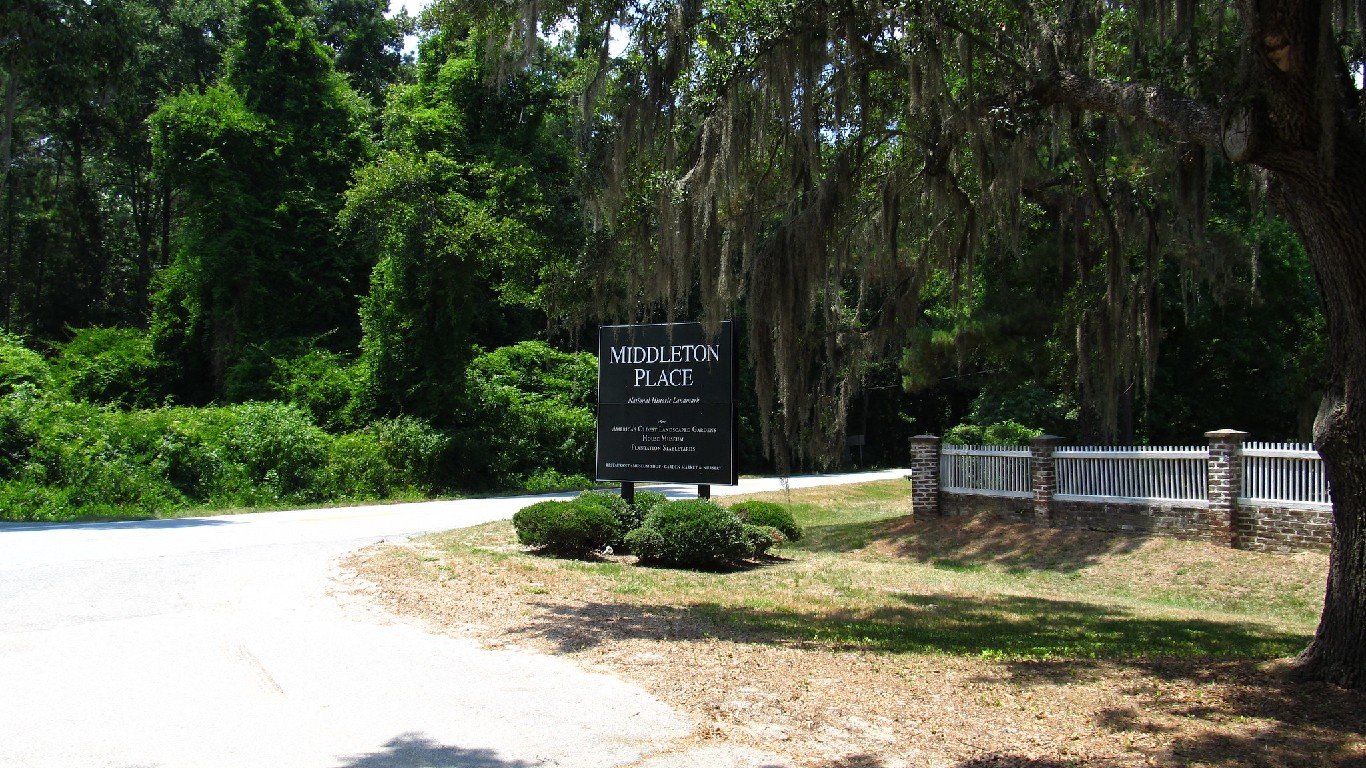
- FEMA hurricane risk index score: 97.98/100
- Total value of owner-occupied homes: $13.3 billion
- Population change due to net migration, 2017 to 2022: +4.4%
- County seat: St. George
45. Suffolk County, NY

- FEMA hurricane risk index score: 98.03/100
- Total value of owner-occupied homes: $256.7 billion
- Population change due to net migration, 2017 to 2022: -0.6%
- County seat: Riverhead
44. Craven County, NC

- FEMA hurricane risk index score: 98.07/100
- Total value of owner-occupied homes: $6.4 billion
- Population change due to net migration, 2017 to 2022: +2.0%
- County seat: New Bern
43. Charlotte County, FL

- FEMA hurricane risk index score: 98.12/100
- Total value of owner-occupied homes: $22.7 billion
- Population change due to net migration, 2017 to 2022: +14.3%
- County seat: Punta Gorda
42. Martin County, FL

- FEMA hurricane risk index score: 98.16/100
- Total value of owner-occupied homes: $26.2 billion
- Population change due to net migration, 2017 to 2022: +5.4%
- County seat: Stuart
41. Volusia County, FL

- FEMA hurricane risk index score: 98.21/100
- Total value of owner-occupied homes: $48.5 billion
- Population change due to net migration, 2017 to 2022: +8.8%
- County seat: DeLand
40. Harrison County, MS

- FEMA hurricane risk index score: 98.25/100
- Total value of owner-occupied homes: $11.0 billion
- Population change due to net migration, 2017 to 2022: +1.1%
- County seat: Biloxi
39. Nueces County, TX

- FEMA hurricane risk index score: 98.30/100
- Total value of owner-occupied homes: $17.3 billion
- Population change due to net migration, 2017 to 2022: -0.9%
- County seat: Corpus Christi
38. Galveston County, TX

- FEMA hurricane risk index score: 98.34/100
- Total value of owner-occupied homes: $27.9 billion
- Population change due to net migration, 2017 to 2022: +2.7%
- County seat: Galveston
37. Brunswick County, NC

- FEMA hurricane risk index score: 98.38/100
- Total value of owner-occupied homes: $17.5 billion
- Population change due to net migration, 2017 to 2022: +19.1%
- County seat: Bolivia
36. Orleans Parish, LA

- FEMA hurricane risk index score: 98.43/100
- Total value of owner-occupied homes: $30.7 billion
- Population change due to net migration, 2017 to 2022: -5.5%
- County seat: New Orleans
35. Indian River County, FL
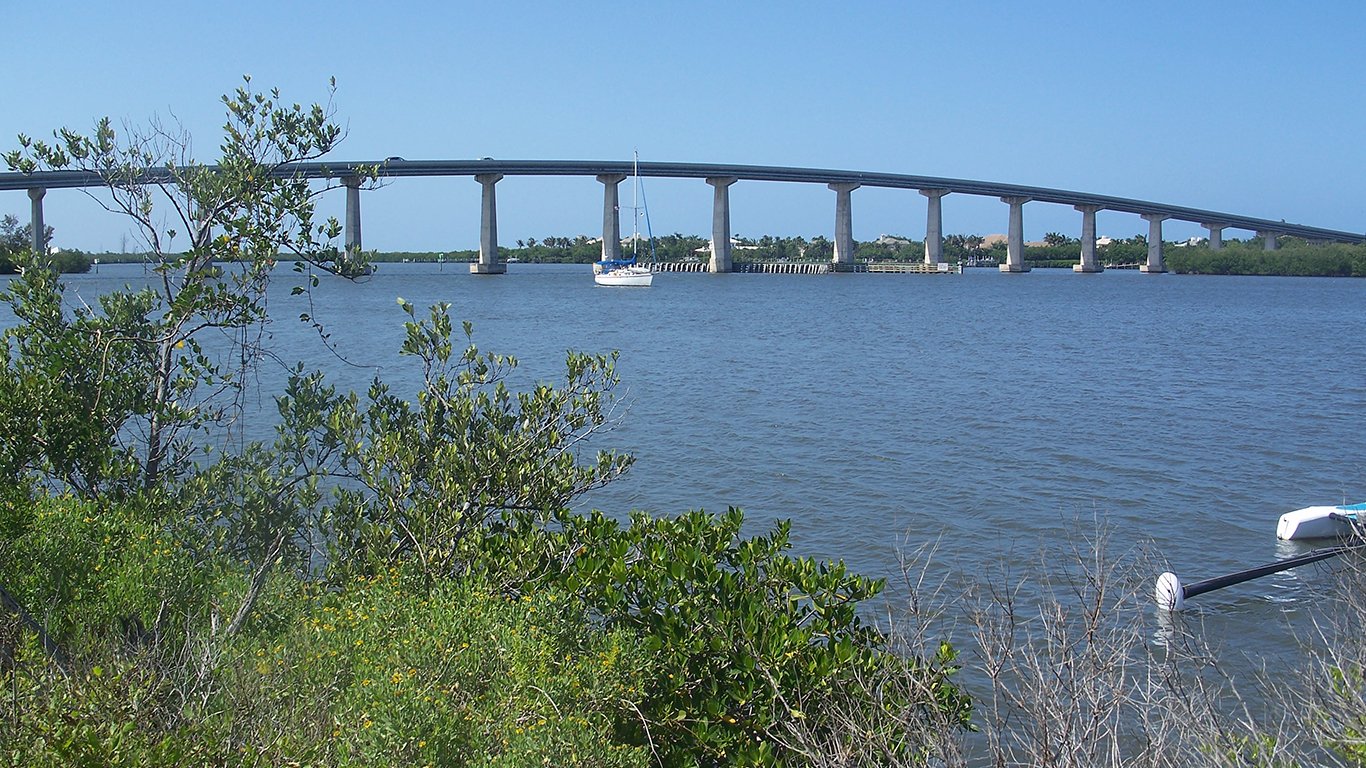
- FEMA hurricane risk index score: 98.47/100
- Total value of owner-occupied homes: $22.2 billion
- Population change due to net migration, 2017 to 2022: +9.1%
- County seat: Vero Beach
34. Brazoria County, TX

- FEMA hurricane risk index score: 98.52/100
- Total value of owner-occupied homes: $25.9 billion
- Population change due to net migration, 2017 to 2022: +5.8%
- County seat: Angleton
33. Carteret County, NC

- FEMA hurricane risk index score: 98.56/100
- Total value of owner-occupied homes: $8.0 billion
- Population change due to net migration, 2017 to 2022: +5.4%
- County seat: Beaufort
32. Berkeley County, SC

- FEMA hurricane risk index score: 98.61/100
- Total value of owner-occupied homes: $20.4 billion
- Population change due to net migration, 2017 to 2022: +9.9%
- County seat: Moncks Corner
31. Polk County, FL

- FEMA hurricane risk index score: 98.65/100
- Total value of owner-occupied homes: $44.6 billion
- Population change due to net migration, 2017 to 2022: +13.0%
- County seat: Bartow
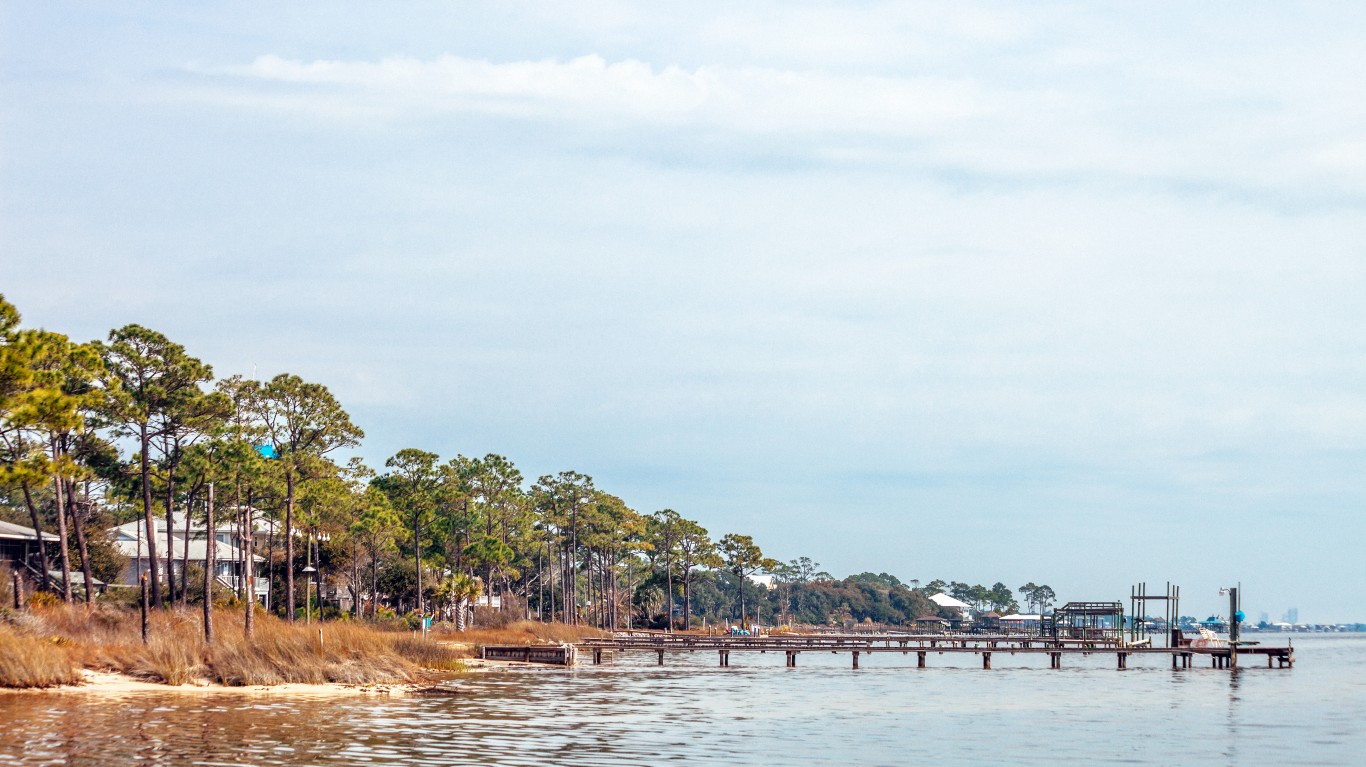
30. Okaloosa County, FL

- FEMA hurricane risk index score: 98.70/100
- Total value of owner-occupied homes: $21.9 billion
- Population change due to net migration, 2017 to 2022: +2.5%
- County seat: Crestview
29. Bay County, FL

- FEMA hurricane risk index score: 98.74/100
- Total value of owner-occupied homes: $15.0 billion
- Population change due to net migration, 2017 to 2022: +9.3%
- County seat: Panama City
28. Duval County, FL

- FEMA hurricane risk index score: 98.79/100
- Total value of owner-occupied homes: $73.3 billion
- Population change due to net migration, 2017 to 2022: +2.7%
- County seat: Jacksonville
27. Cameron County, TX

- FEMA hurricane risk index score: 98.83/100
- Total value of owner-occupied homes: $12.4 billion
- Population change due to net migration, 2017 to 2022: -0.3%
- County seat: Brownsville
26. Baldwin County, AL
- FEMA hurricane risk index score: 98.88/100
- Total value of owner-occupied homes: $23.8 billion
- Population change due to net migration, 2017 to 2022: +10.0%
- County seat: Bay Minette
25. Escambia County, FL
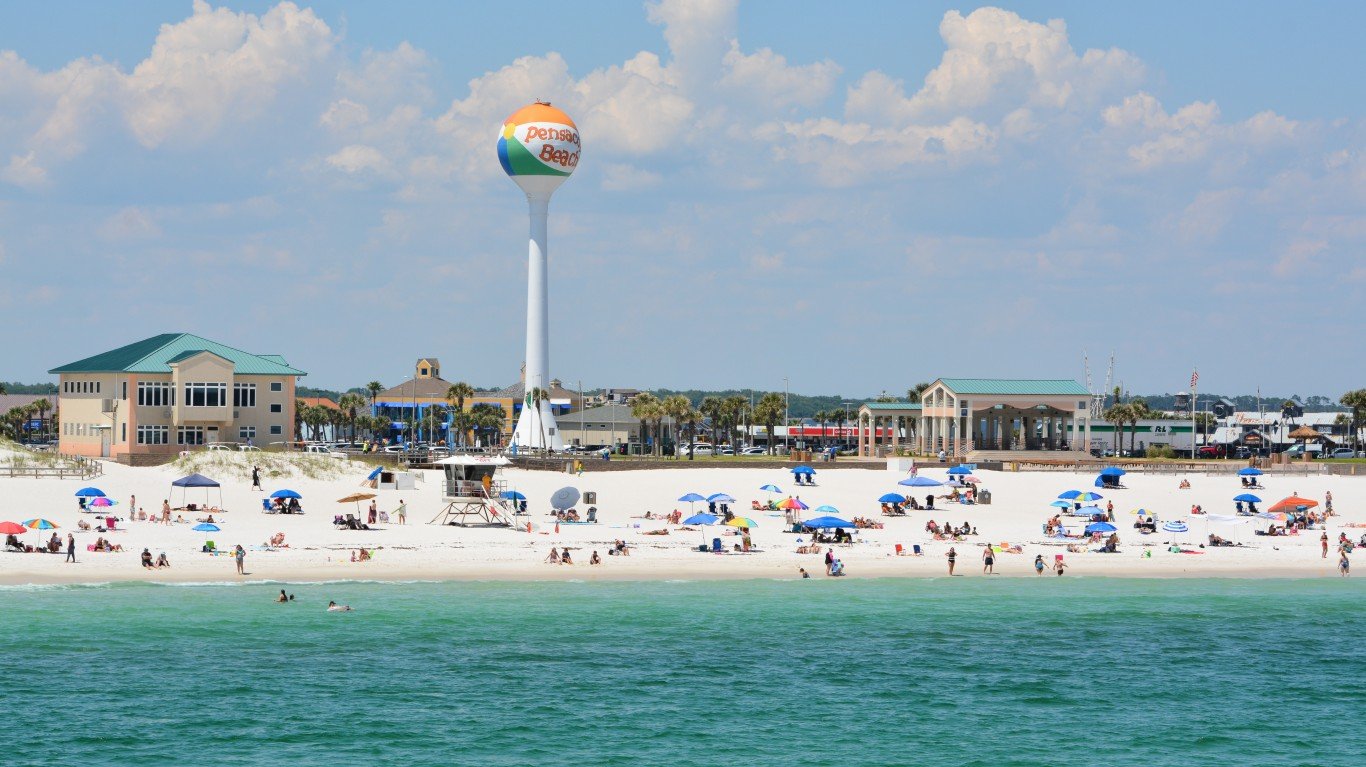
- FEMA hurricane risk index score: 98.92/100
- Total value of owner-occupied homes: $20.8 billion
- Population change due to net migration, 2017 to 2022: +2.1%
- County seat: Pensacola
24. Jefferson Parish, LA

- FEMA hurricane risk index score: 98.97/100
- Total value of owner-occupied homes: $30.1 billion
- Population change due to net migration, 2017 to 2022: -4.6%
- County seat: Gretna
23. Onslow County, NC

- FEMA hurricane risk index score: 99.01/100
- Total value of owner-occupied homes: $9.2 billion
- Population change due to net migration, 2017 to 2022: +1.2%
- County seat: Jacksonville
22. Orange County, FL

- FEMA hurricane risk index score: 99.06/100
- Total value of owner-occupied homes: $114.5 billion
- Population change due to net migration, 2017 to 2022: +1.5%
- County seat: Orlando
21. Beaufort County, SC

- FEMA hurricane risk index score: 99.10/100
- Total value of owner-occupied homes: $30.6 billion
- Population change due to net migration, 2017 to 2022: +6.6%
- County seat: Beaufort
20. St. Lucie County, FL

- FEMA hurricane risk index score: 99.15/100
- Total value of owner-occupied homes: $29.9 billion
- Population change due to net migration, 2017 to 2022: +14.4%
- County seat: Fort Pierce
19. Manatee County, FL

- FEMA hurricane risk index score: 99.19/100
- Total value of owner-occupied homes: $47.5 billion
- Population change due to net migration, 2017 to 2022: +11.5%
- County seat: Bradenton
18. Fort Bend County, TX

- FEMA hurricane risk index score: 99.24/100
- Total value of owner-occupied homes: $80.3 billion
- Population change due to net migration, 2017 to 2022: +9.7%
- County seat: Richmond
17. Hidalgo County, TX

- FEMA hurricane risk index score: 99.28/100
- Total value of owner-occupied homes: $25.1 billion
- Population change due to net migration, 2017 to 2022: +0.5%
- County seat: Edinburg
16. Sarasota County, FL

- FEMA hurricane risk index score: 99.33/100
- Total value of owner-occupied homes: $72.8 billion
- Population change due to net migration, 2017 to 2022: +11.2%
- County seat: Sarasota
15. New Hanover County, NC

- FEMA hurricane risk index score: 99.37/100
- Total value of owner-occupied homes: $24.1 billion
- Population change due to net migration, 2017 to 2022: +6.0%
- County seat: Wilmington
14. Mobile County, AL

- FEMA hurricane risk index score: 99.42/100
- Total value of owner-occupied homes: $20.9 billion
- Population change due to net migration, 2017 to 2022: -0.7%
- County seat: Mobile
13. Chatham County, GA

- FEMA hurricane risk index score: 99.46/100
- Total value of owner-occupied homes: $22.9 billion
- Population change due to net migration, 2017 to 2022: +2.1%
- County seat: Savannah
12. Collier County, FL

- FEMA hurricane risk index score: 99.51/100
- Total value of owner-occupied homes: $85.3 billion
- Population change due to net migration, 2017 to 2022: +8.6%
- County seat: East Naples
11. Horry County, SC

- FEMA hurricane risk index score: 99.55/100
- Total value of owner-occupied homes: $29.6 billion
- Population change due to net migration, 2017 to 2022: +14.9%
- County seat: Conway
10. Pasco County, FL

- FEMA hurricane risk index score: 99.60/100
- Total value of owner-occupied homes: $45.2 billion
- Population change due to net migration, 2017 to 2022: +14.0%
- County seat: Dade City
9. Charleston County, SC

- FEMA hurricane risk index score: 99.64/100
- Total value of owner-occupied homes: $61.5 billion
- Population change due to net migration, 2017 to 2022: +2.9%
- County seat: Charleston
8. Pinellas County, FL

- FEMA hurricane risk index score: 99.69/100
- Total value of owner-occupied homes: $106.9 billion
- Population change due to net migration, 2017 to 2022: +2.3%
- County seat: Clearwater
7. Brevard County, FL

- FEMA hurricane risk index score: 99.73/100
- Total value of owner-occupied homes: $63.1 billion
- Population change due to net migration, 2017 to 2022: +8.1%
- County seat: Titusville
6. Lee County, FL

- FEMA hurricane risk index score: 99.78/100
- Total value of owner-occupied homes: $86.2 billion
- Population change due to net migration, 2017 to 2022: +10.5%
- County seat: Fort Myers
5. Hillsborough County, FL

- FEMA hurricane risk index score: 99.82/100
- Total value of owner-occupied homes: $125.5 billion
- Population change due to net migration, 2017 to 2022: +4.3%
- County seat: Tampa
4. Palm Beach County, FL

- FEMA hurricane risk index score: 99.87/100
- Total value of owner-occupied homes: $220.5 billion
- Population change due to net migration, 2017 to 2022: +3.3%
- County seat: West Palm Beach
3. Broward County, FL

- FEMA hurricane risk index score: 99.91/100
- Total value of owner-occupied homes: $199.6 billion
- Population change due to net migration, 2017 to 2022: +0.5%
- County seat: Fort Lauderdale
2. Miami-Dade County, FL

- FEMA hurricane risk index score: 99.96/100
- Total value of owner-occupied homes: $255.6 billion
- Population change due to net migration, 2017 to 2022: -1.0%
- County seat: Miami
1. Harris County, TX
- FEMA hurricane risk index score: 100.00/100
- Total value of owner-occupied homes: $306.2 billion
- Population change due to net migration, 2017 to 2022: +0.1%
- County seat: Houston
“The Next NVIDIA” Could Change Your Life
If you missed out on NVIDIA’s historic run, your chance to see life-changing profits from AI isn’t over.
The 24/7 Wall Street Analyst who first called NVIDIA’s AI-fueled rise in 2009 just published a brand-new research report named “The Next NVIDIA.”
Click here to download your FREE copy.
The post FEMA’s Hurricane Risk Index Score Is 100/100 for This Unexpected City appeared first on 24/7 Wall St..