Birmingham, Alabama began paying buskers and street performers $200 for a 2-hour street performance. Other cities have brought in jugglers, or more food trucks, or suddenly started having more frequent events or performances in public areas. The goal? To revitalize their downtown areas against a worsening phenomenon known as “dying downtowns.” For the past few years, the onset of remote work — and workers frequently leaving larger cities in search of smaller, more affordable areas — has contributed to the decline of traditional downtowns. What used to be the hub of employment, commerce, and entertainment has slowed. Workers not returning to the office has a significant effect on downtown economic health, as bars, restaurants, and other shops rely on these funds to keep them moving. In San Francisco, for example, 30% of retail space remains unfilled. Suddenly, more cities are trying to find ways to entice people back to these areas, but the efficacy of these efforts is still not well understood. (These are the fastest shrinking states in America.)
To identify areas hardest hit by disappearing or dying downtowns, 24/7 Wall St. reviewed five-year data on population change from the U.S. Census Bureau’s 2022 American Community Survey. We ranked cities based on the percentage change in population in downtown census tracts from 2012 to 2022. Downtown areas were defined as the census tracts that fall at least 50% within the 1.8-mile radius around a city hall. Non-downtown areas were defined as the census tracts that fall at least 50% within a city’s boundaries, yet less than 50% within the 1.8-mile radius around city hall. Boundary definitions are from the U.S. Census Bureau and are for 2022. Only principal cities of metropolitan statistical areas were considered. City hall coordinates as well as supplemental data on income are also from the Census Bureau. Read on to see what downtowns are slowly shrinking — and whether your area is affected.
Why This Matters
American downtowns and city centers have an overall impact on the health of the local economy. There are positive correlations between a thriving downtown, a strong and plentiful job market, higher property values, and more tax revenue. Furthermore, urban sprawl is reduced and people can rely on walking or public transportation to get to jobs, schools, parks, and restaurants. For the 40 cities on our list, the degeneration of downtown areas can have significantly detrimental effects on the city’s ability to thrive and support its citizens.
Here are 40 American cities with shrinking downtowns:
40. San Angelo, Texas
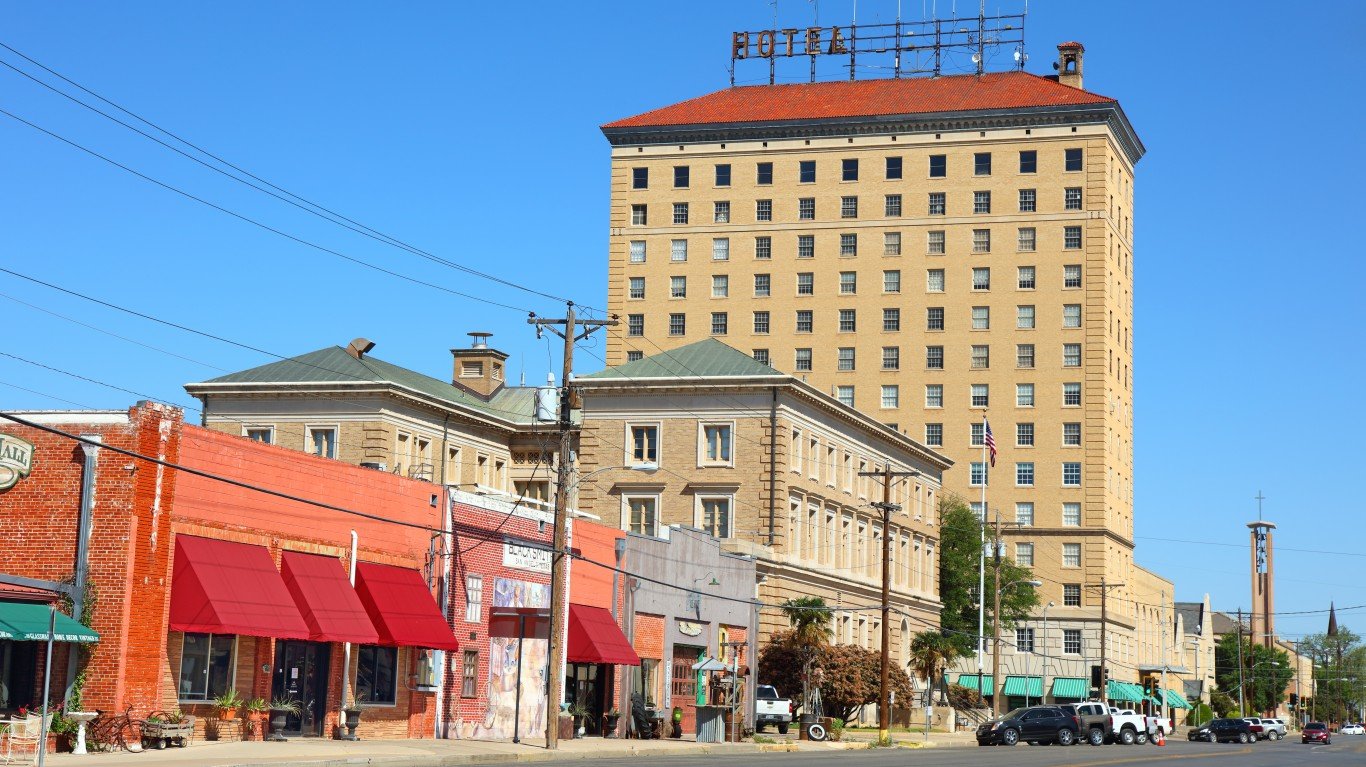
- Population change in downtown tracts from 2012 to 2022: -10.3%
- Population change of non-downtown tracts from 2012 to 2022: +8.7%
- Per capita income change in downtown tracts from 2012 to 2022: +21.3%
- Per capita income change in non-downtown tracts from 2012 to 2022: +15.5%
39. San Antonio, Texas
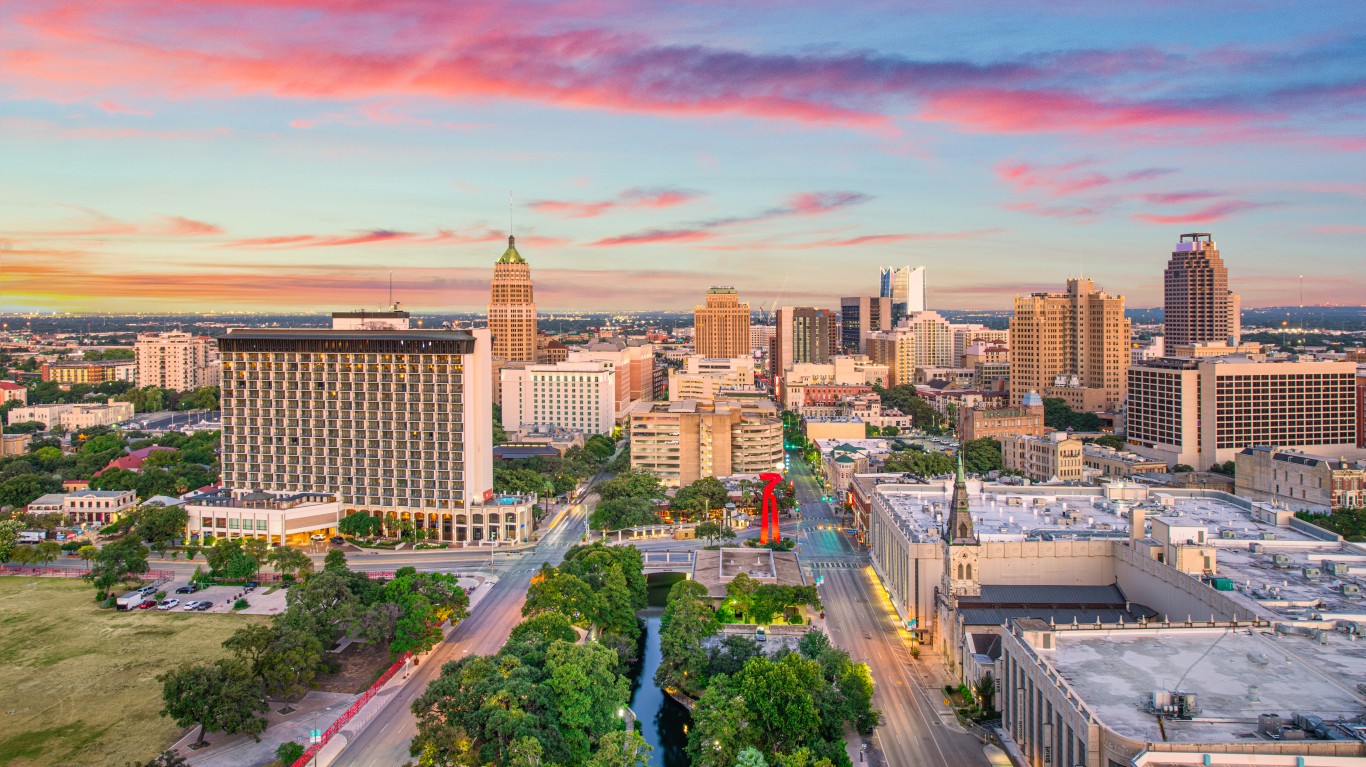
- Population change in downtown tracts from 2012 to 2022: -10.6%
- Population change of non-downtown tracts from 2012 to 2022: +7.5%
- Per capita income change in downtown tracts from 2012 to 2022: +28.5%
- Per capita income change in non-downtown tracts from 2012 to 2022: +8.0%
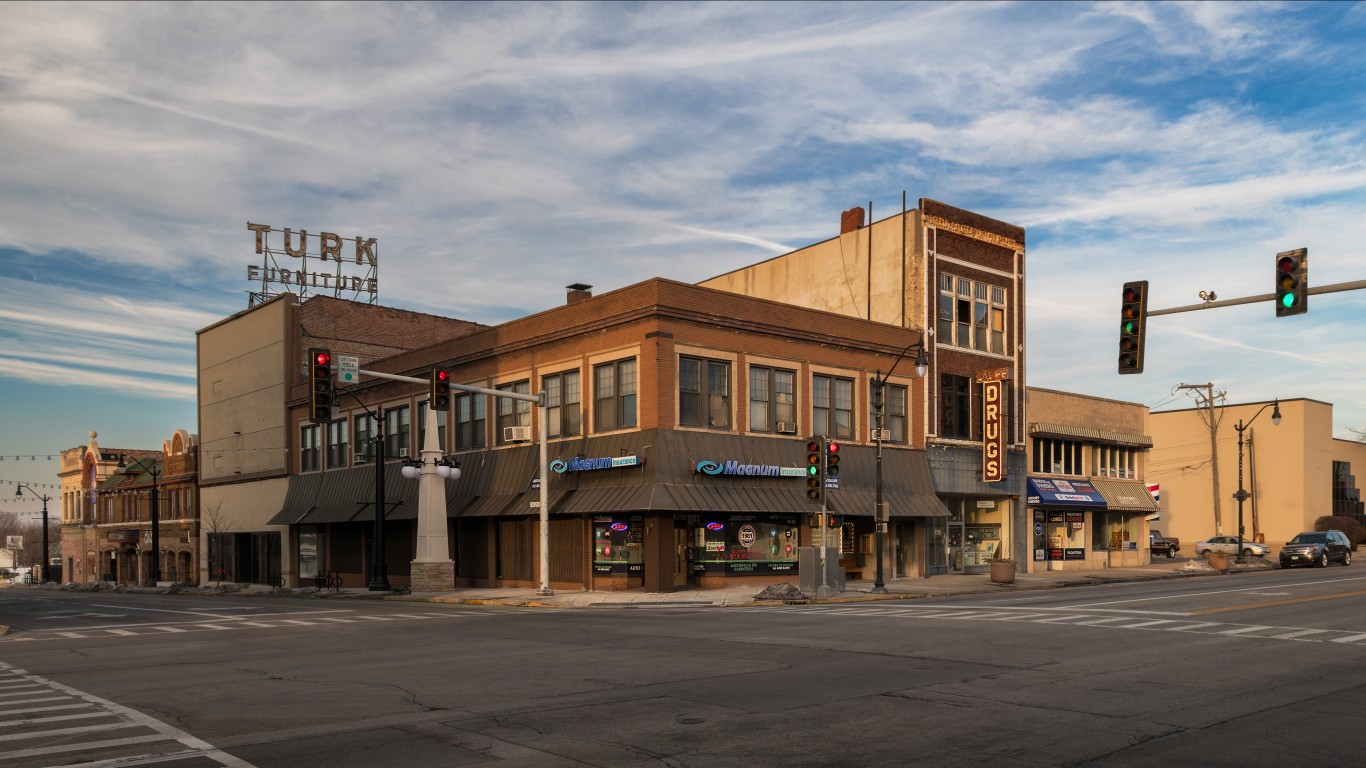
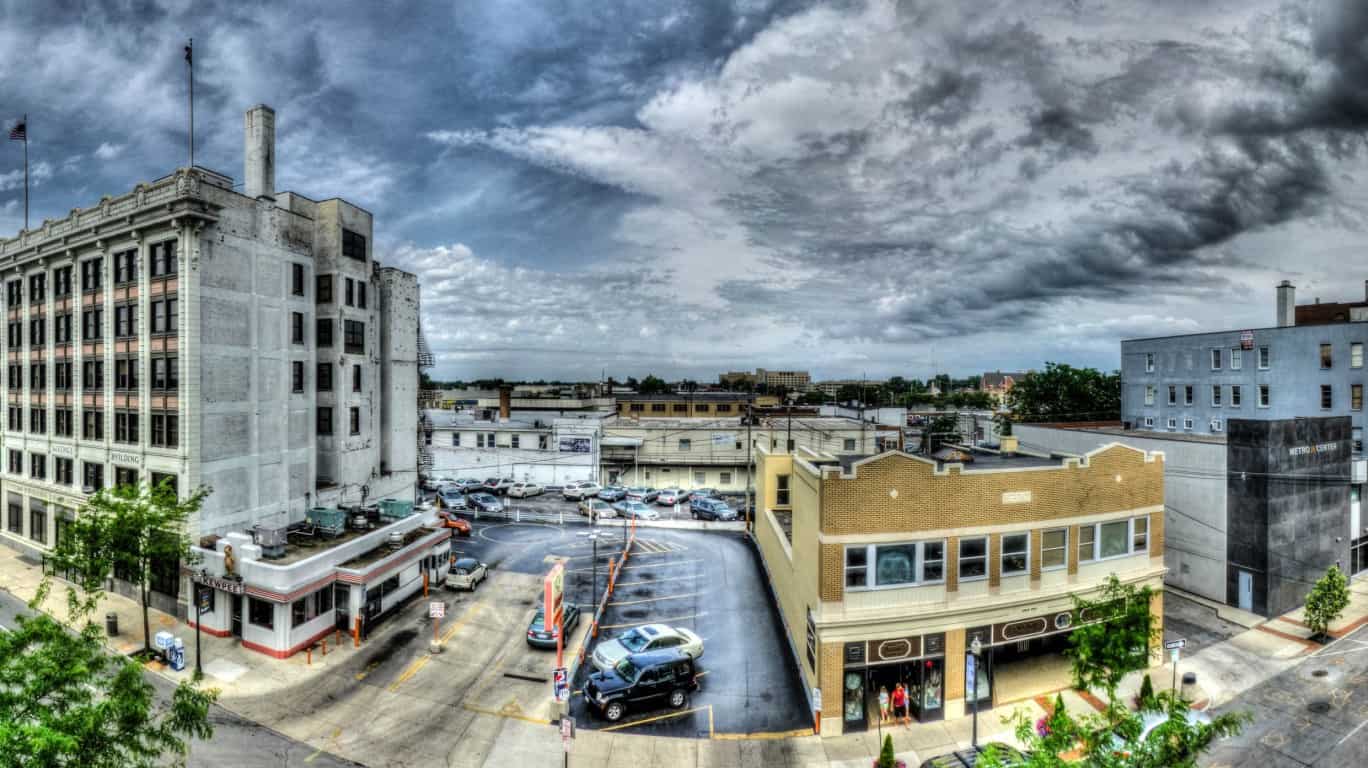
38. St. Joseph, Missouri
- Population change in downtown tracts from 2012 to 2022: -10.9%
- Population change of non-downtown tracts from 2012 to 2022: -1.7%
- Per capita income change in downtown tracts from 2012 to 2022: +9.1%
- Per capita income change in non-downtown tracts from 2012 to 2022: +11.5%
37. Springfield, Illinois

- Population change in downtown tracts from 2012 to 2022: -10.9%
- Population change of non-downtown tracts from 2012 to 2022: -2.0%
- Per capita income change in downtown tracts from 2012 to 2022: +9.5%
- Per capita income change in non-downtown tracts from 2012 to 2022: +8.2%
36. Youngstown, Ohio
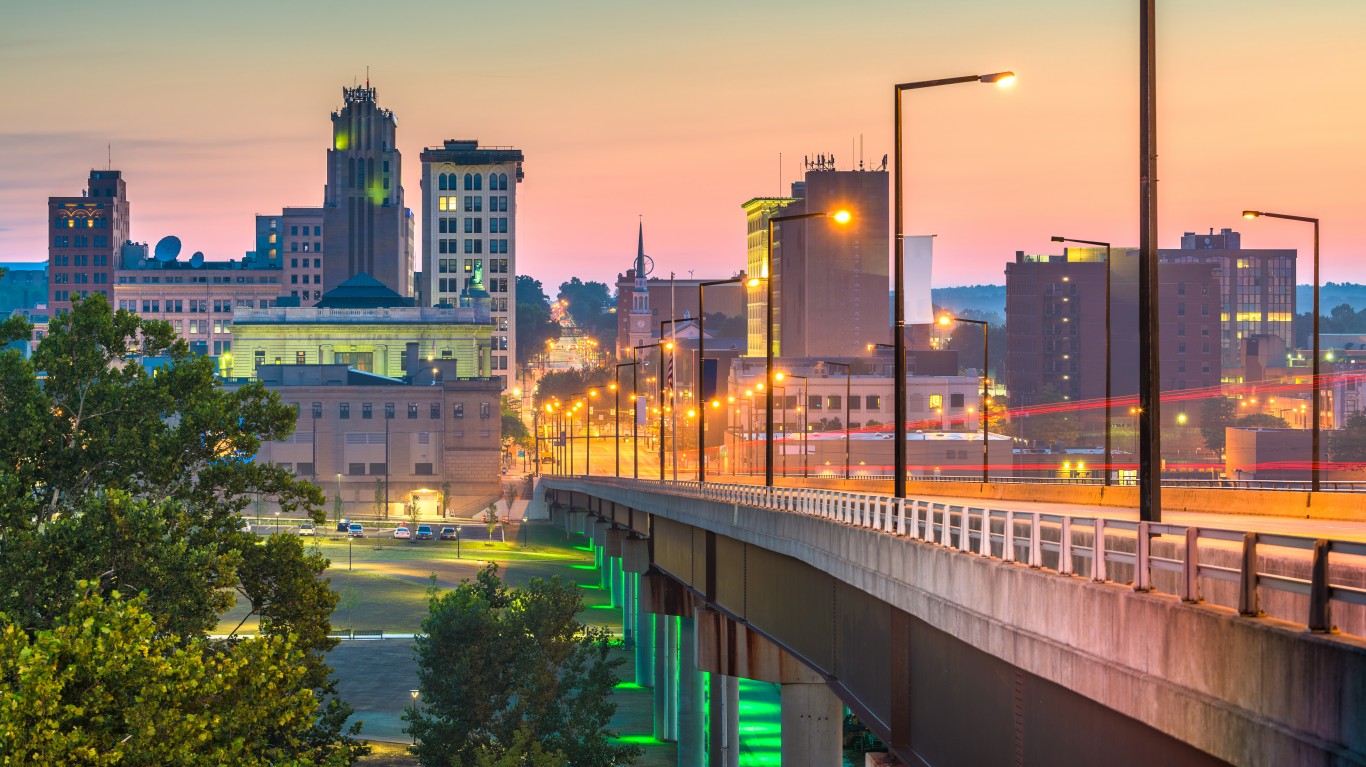
- Population change in downtown tracts from 2012 to 2022: -11.1%
- Population change of non-downtown tracts from 2012 to 2022: -7.4%
- Per capita income change in downtown tracts from 2012 to 2022: +21.5%
- Per capita income change in non-downtown tracts from 2012 to 2022: +2.2%
35. Canton, Ohio

- Population change in downtown tracts from 2012 to 2022: -11.3%
- Population change of non-downtown tracts from 2012 to 2022: -2.8%
- Per capita income change in downtown tracts from 2012 to 2022: +4.6%
- Per capita income change in non-downtown tracts from 2012 to 2022: +11.1%
34. Brownsville, Texas
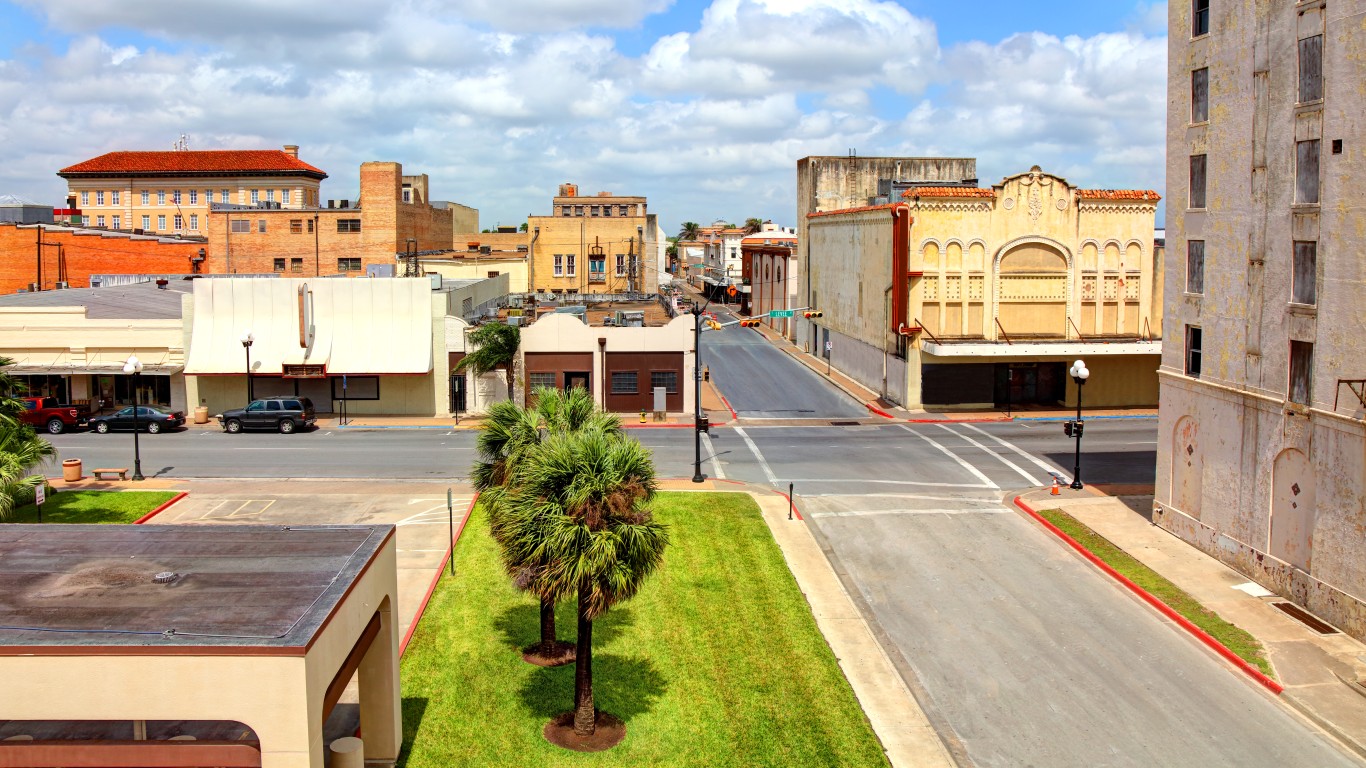
- Population change in downtown tracts from 2012 to 2022: -11.5%
- Population change of non-downtown tracts from 2012 to 2022: +0.6%
- Per capita income change in downtown tracts from 2012 to 2022: +11.5%
- Per capita income change in non-downtown tracts from 2012 to 2022: +9.8%
33. Johnstown, Pennsylvania
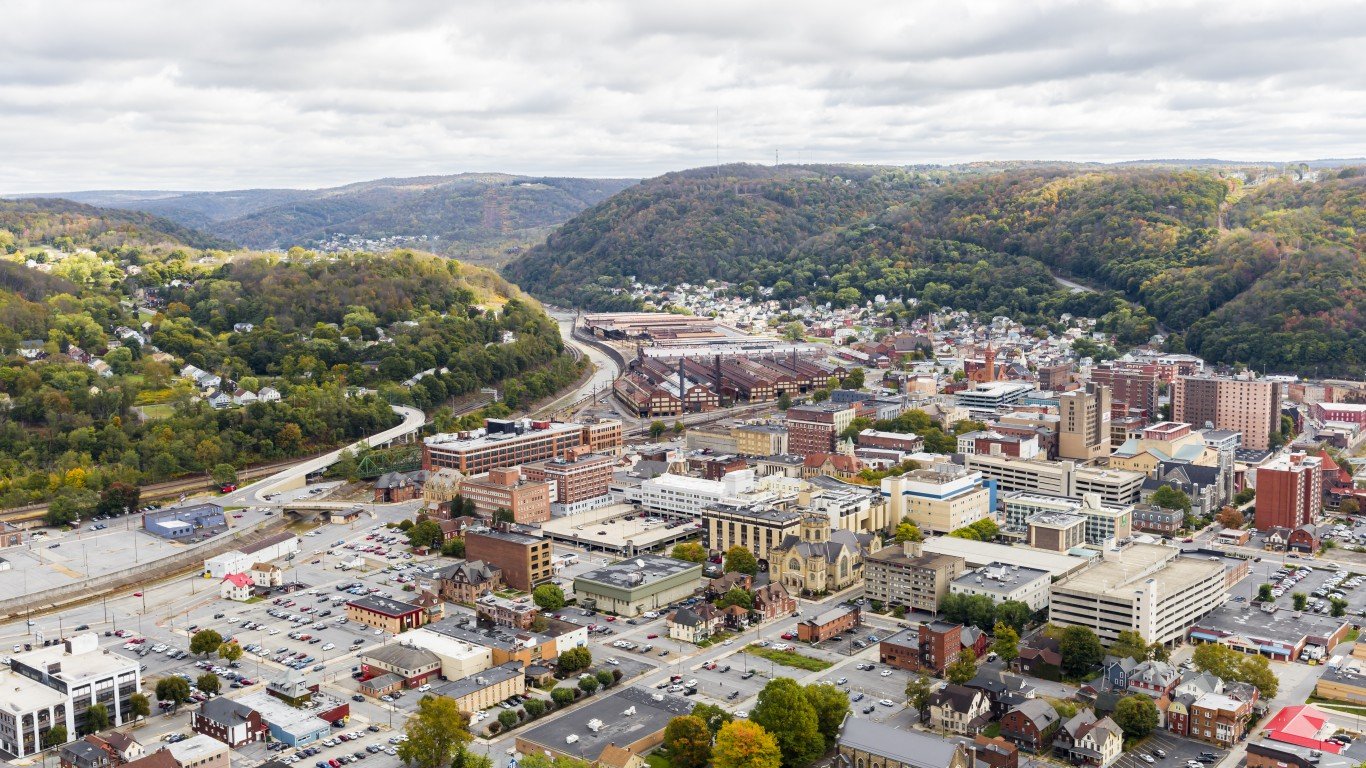
- Population change in downtown tracts from 2012 to 2022: -11.6%
- Population change of non-downtown tracts from 2012 to 2022: -12.4%
- Per capita income change in downtown tracts from 2012 to 2022: +23.9%
- Per capita income change in non-downtown tracts from 2012 to 2022: -1.5%
32. Amarillo, Texas
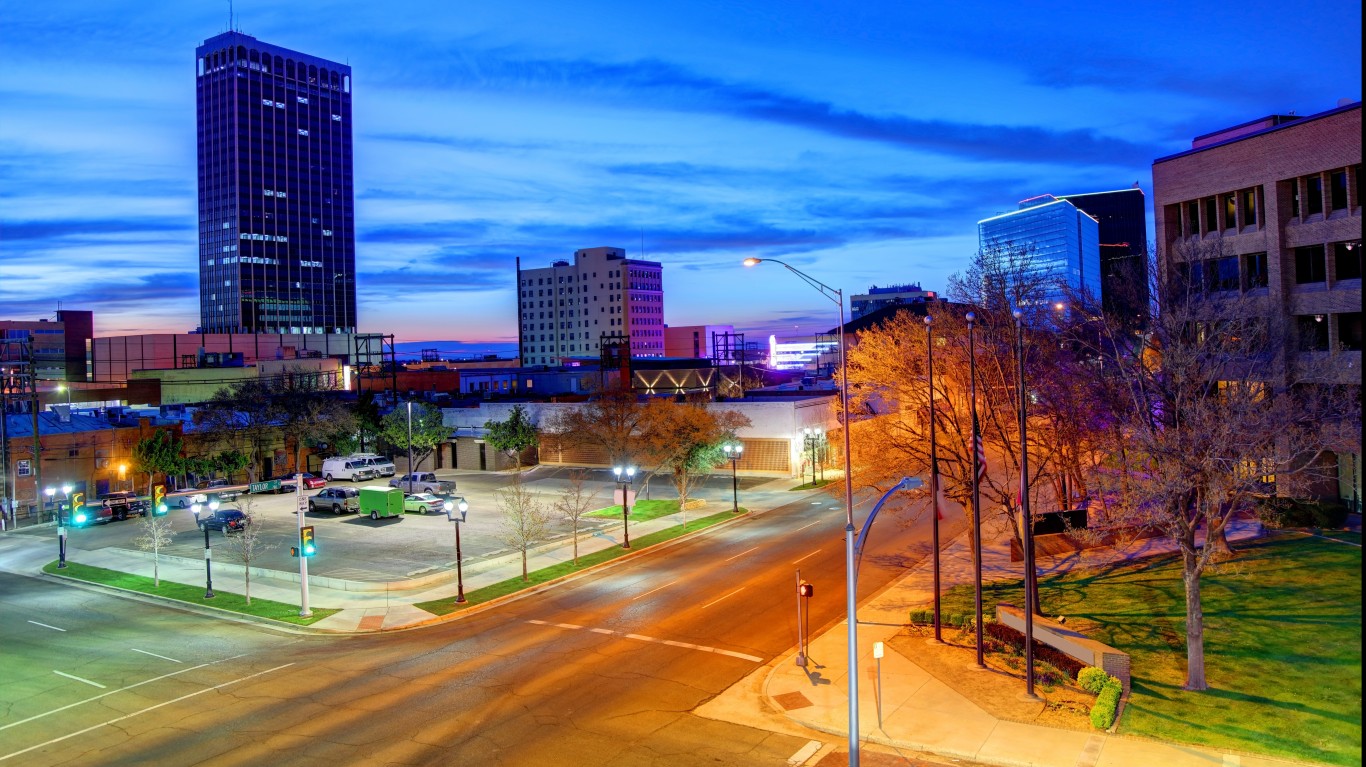
- Population change in downtown tracts from 2012 to 2022: -11.6%
- Population change of non-downtown tracts from 2012 to 2022: +1.8%
- Per capita income change in downtown tracts from 2012 to 2022: +14.1%
- Per capita income change in non-downtown tracts from 2012 to 2022: +6.2%
31. Hattiesburg, Mississippi

- Population change in downtown tracts from 2012 to 2022: -11.7%
- Population change of non-downtown tracts from 2012 to 2022: +9.2%
- Per capita income change in downtown tracts from 2012 to 2022: +21.2%
- Per capita income change in non-downtown tracts from 2012 to 2022: +0.8%
30. Valdosta, Georgia

- Population change in downtown tracts from 2012 to 2022: -12.6%
- Population change of non-downtown tracts from 2012 to 2022: +4.5%
- Per capita income change in downtown tracts from 2012 to 2022: +26.0%
- Per capita income change in non-downtown tracts from 2012 to 2022: +5.0%
29. El Paso, Texas
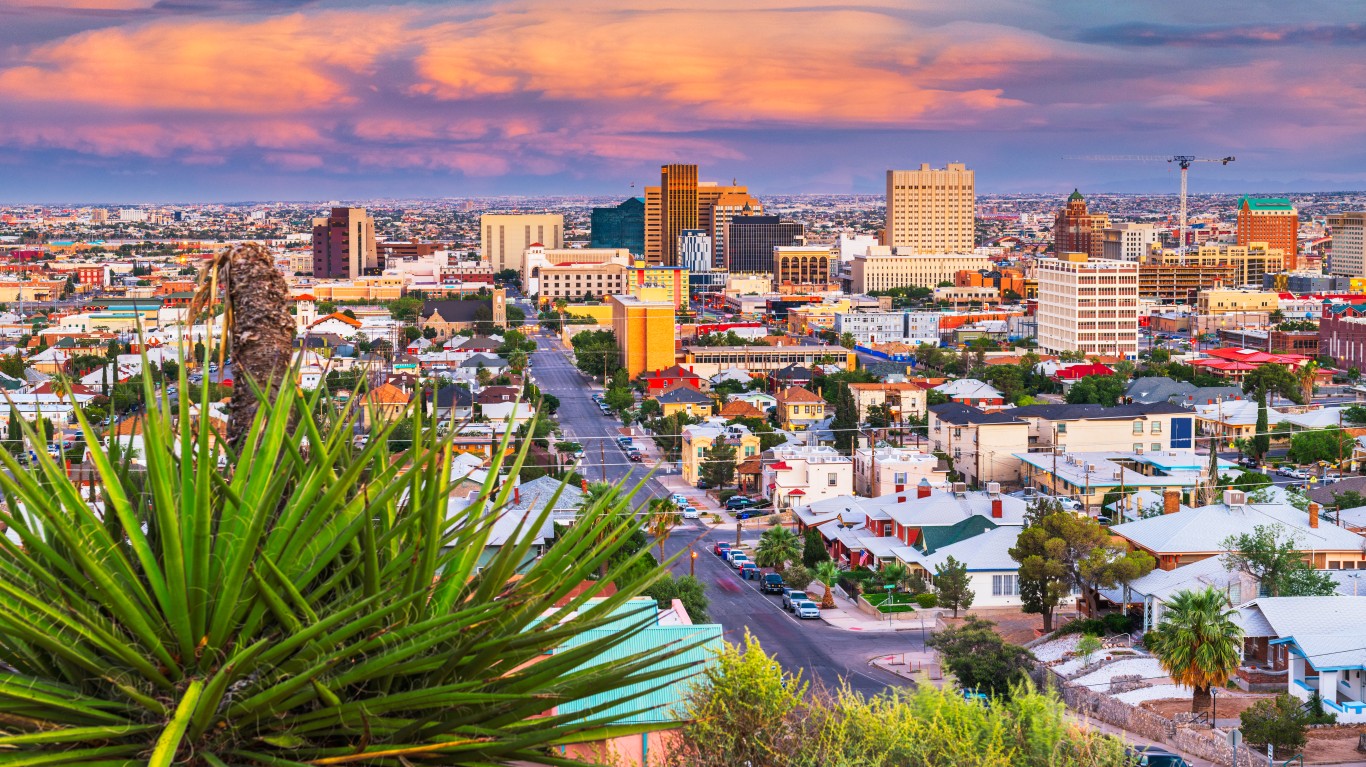
- Population change in downtown tracts from 2012 to 2022: -12.7%
- Population change of non-downtown tracts from 2012 to 2022: -3.2%
- Per capita income change in downtown tracts from 2012 to 2022: +17.9%
- Per capita income change in non-downtown tracts from 2012 to 2022: +8.5%
28. Jackson, Mississippi
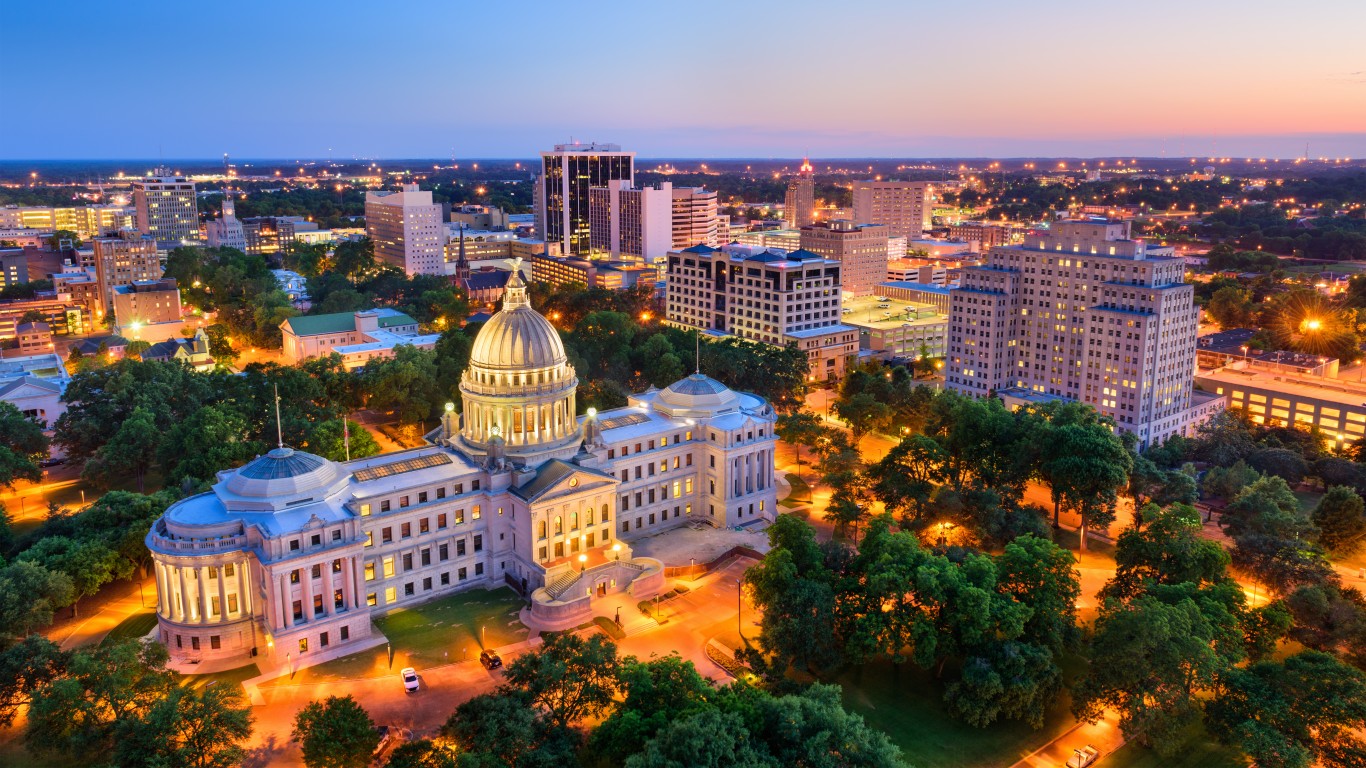
- Population change in downtown tracts from 2012 to 2022: -13.2%
- Population change of non-downtown tracts from 2012 to 2022: -12.6%
- Per capita income change in downtown tracts from 2012 to 2022: +33.1%
- Per capita income change in non-downtown tracts from 2012 to 2022: +5.4%
27. Casper, Wyoming
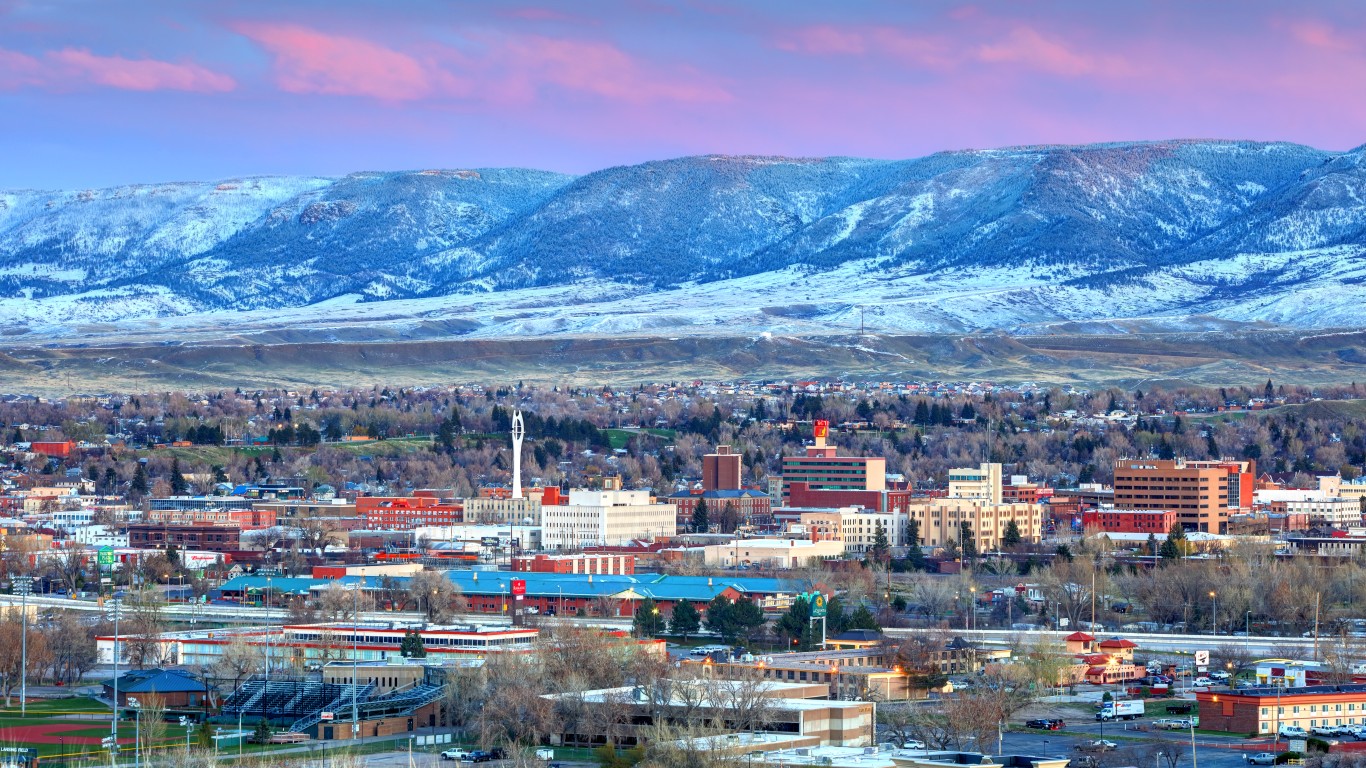
- Population change in downtown tracts from 2012 to 2022: -13.2%
- Population change of non-downtown tracts from 2012 to 2022: +1.5%
- Per capita income change in downtown tracts from 2012 to 2022: +11.6%
- Per capita income change in non-downtown tracts from 2012 to 2022: -3.6%
26. Gadsden, Alabama
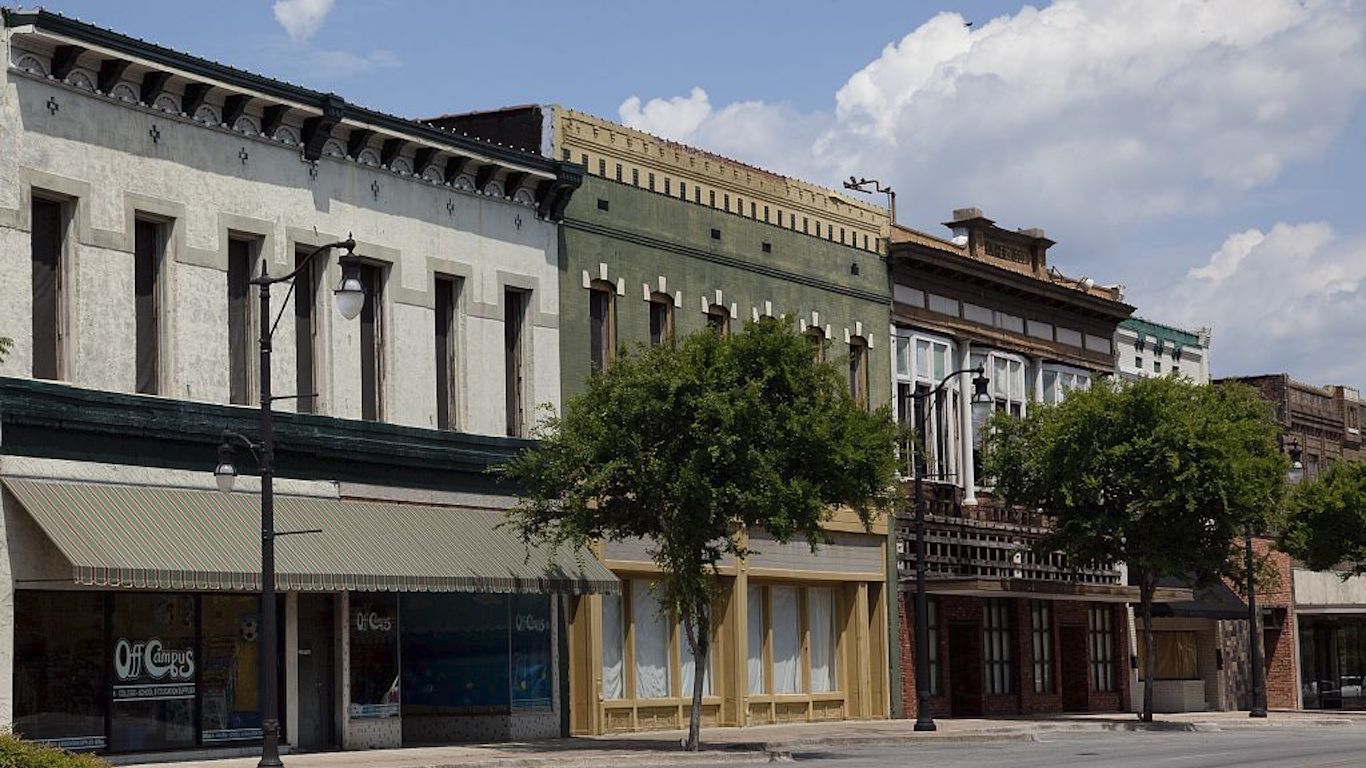
- Population change in downtown tracts from 2012 to 2022: -13.3%
- Population change of non-downtown tracts from 2012 to 2022: -6.4%
- Per capita income change in downtown tracts from 2012 to 2022: +5.2%
- Per capita income change in non-downtown tracts from 2012 to 2022: +7.4%
25. Abilene, Texas
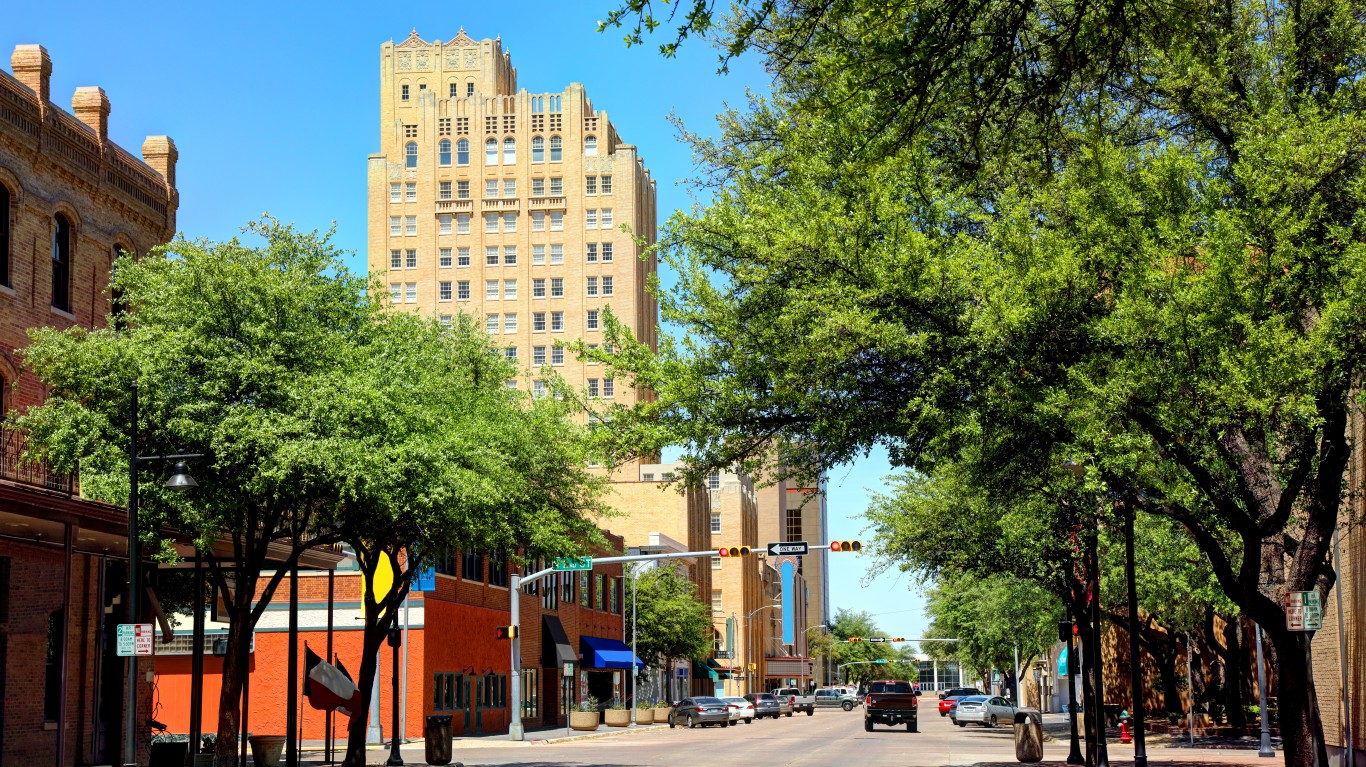
- Population change in downtown tracts from 2012 to 2022: -13.3%
- Population change of non-downtown tracts from 2012 to 2022: +3.3%
- Per capita income change in downtown tracts from 2012 to 2022: +4.8%
- Per capita income change in non-downtown tracts from 2012 to 2022: +7.5%
24. Cumberland, Maryland
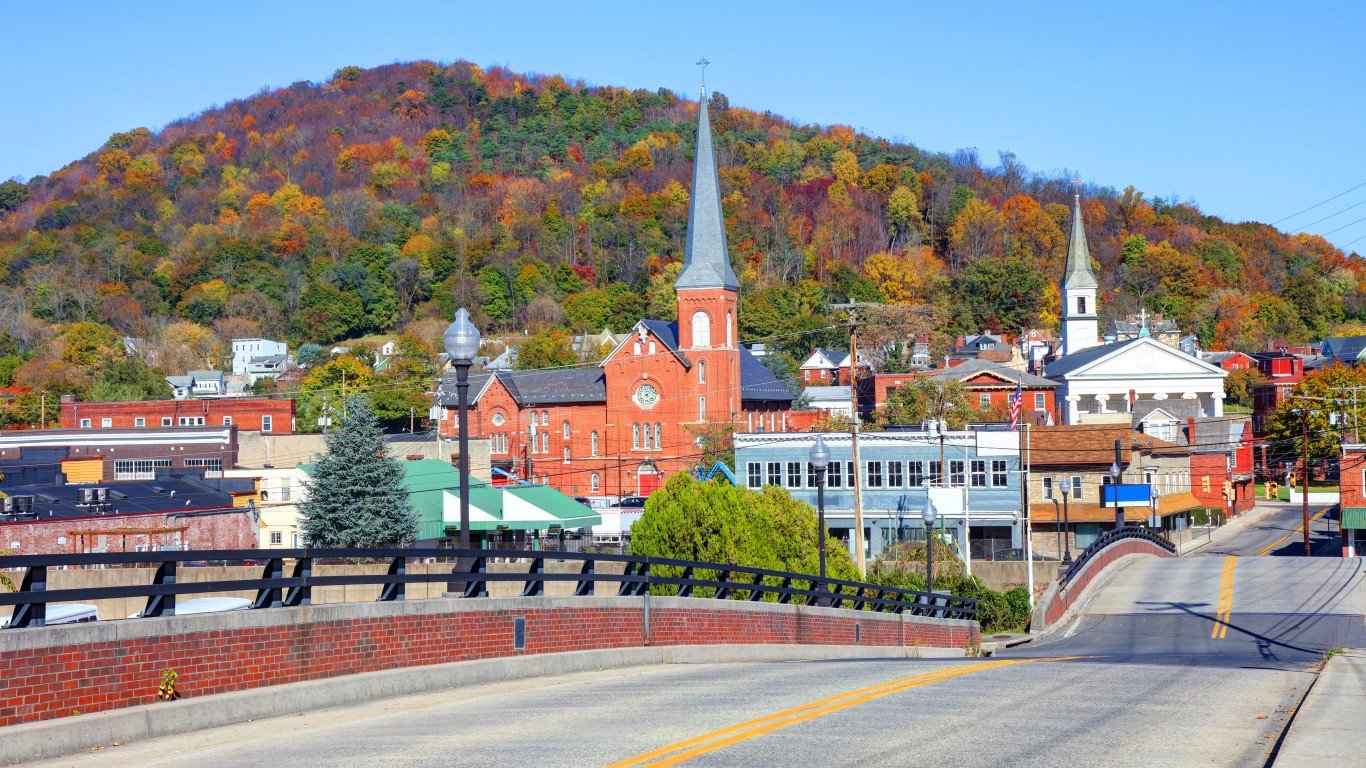
- Population change in downtown tracts from 2012 to 2022: -13.4%
- Population change of non-downtown tracts from 2012 to 2022: -7.4%
- Per capita income change in downtown tracts from 2012 to 2022: +5.1%
- Per capita income change in non-downtown tracts from 2012 to 2022: +14.8%
23. Panama City, Florida
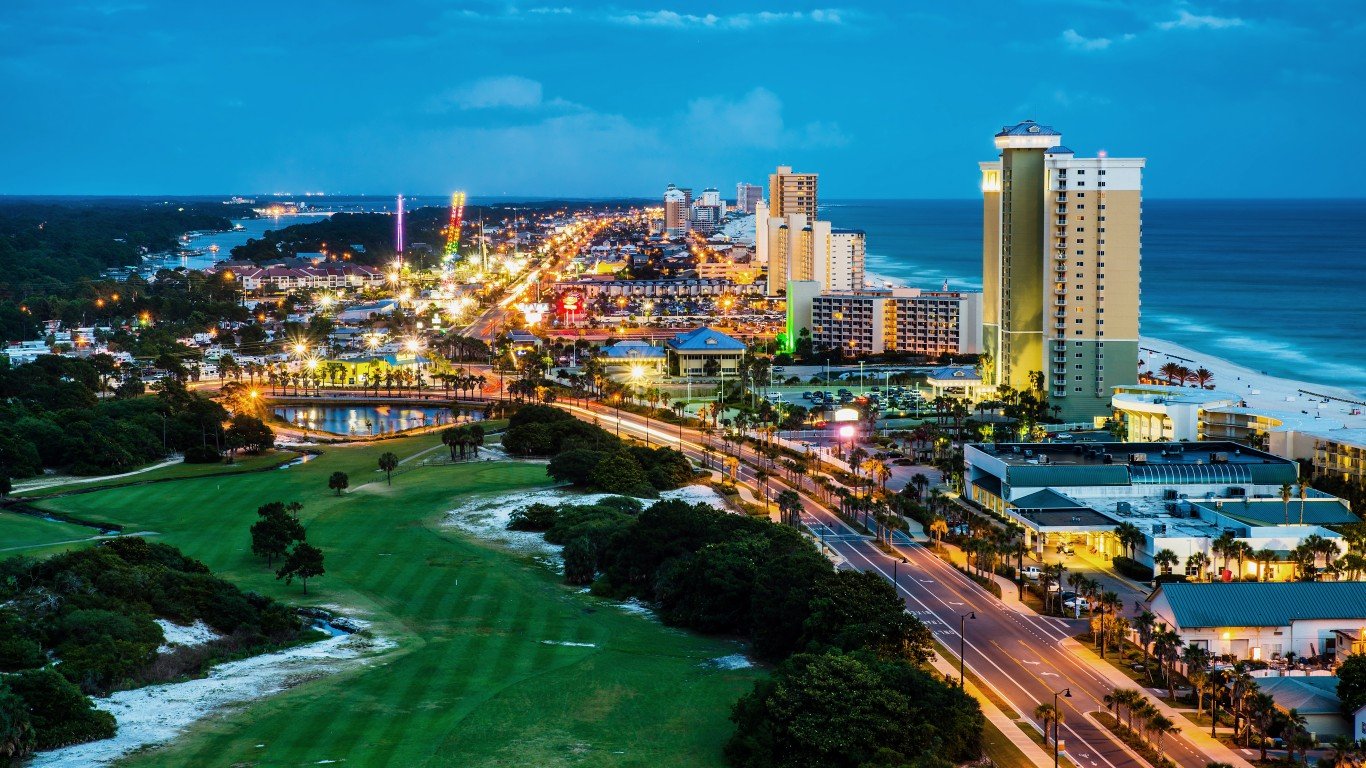
- Population change in downtown tracts from 2012 to 2022: -13.8%
- Population change of non-downtown tracts from 2012 to 2022: -7.9%
- Per capita income change in downtown tracts from 2012 to 2022: +20.6%
- Per capita income change in non-downtown tracts from 2012 to 2022: +17.1%
22. Decatur, Illinois

- Population change in downtown tracts from 2012 to 2022: -14.7%
- Population change of non-downtown tracts from 2012 to 2022: -7.4%
- Per capita income change in downtown tracts from 2012 to 2022: +9.4%
- Per capita income change in non-downtown tracts from 2012 to 2022: +6.2%
21. Kankakee, Illinois
- Population change in downtown tracts from 2012 to 2022: -14.9%
- Population change of non-downtown tracts from 2012 to 2022: +3.6%
- Per capita income change in downtown tracts from 2012 to 2022: +19.4%
- Per capita income change in non-downtown tracts from 2012 to 2022: +2.7%
20. Naples, Florida

- Population change in downtown tracts from 2012 to 2022: -15.0%
- Population change of non-downtown tracts from 2012 to 2022: +3.3%
- Per capita income change in downtown tracts from 2012 to 2022: +31.1%
- Per capita income change in non-downtown tracts from 2012 to 2022: +29.3%
19. Laredo, Texas
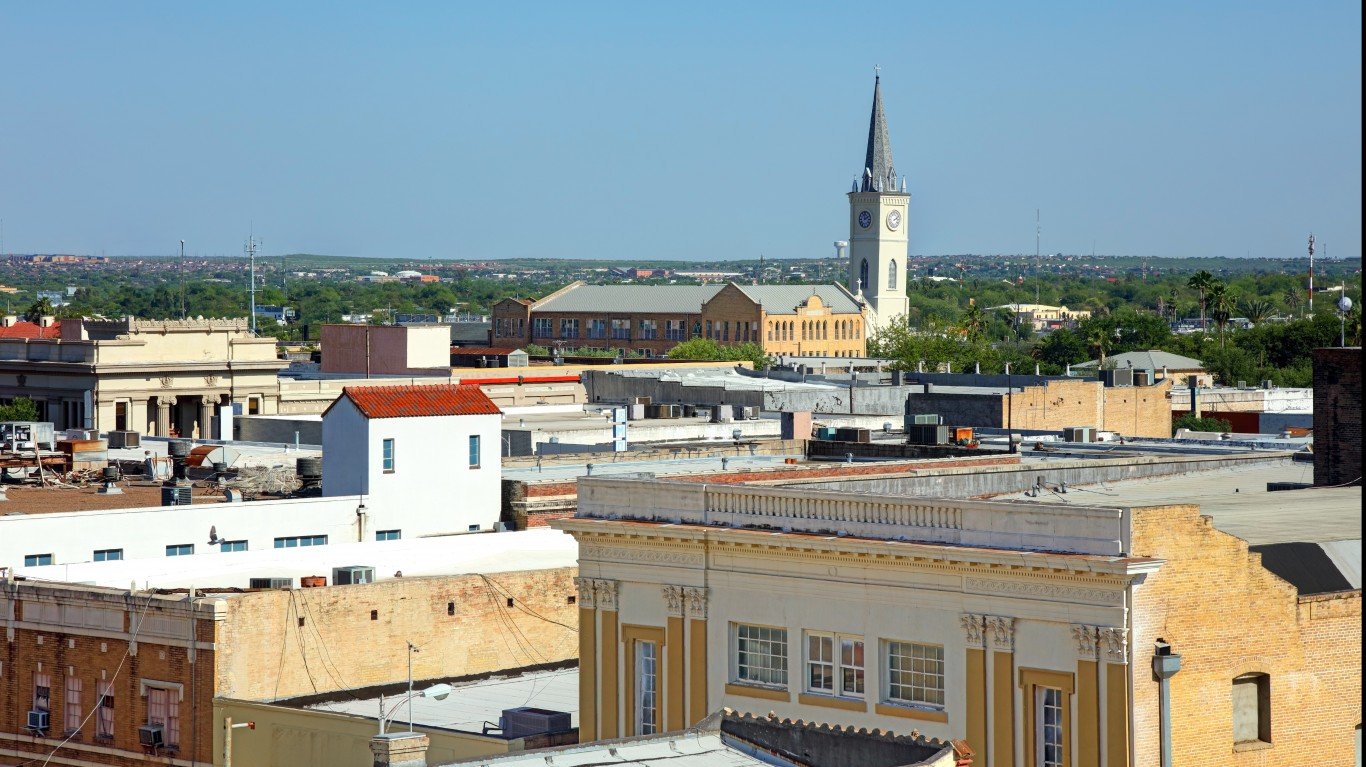
- Population change in downtown tracts from 2012 to 2022: -15.4%
- Population change of non-downtown tracts from 2012 to 2022: +5.4%
- Per capita income change in downtown tracts from 2012 to 2022: +27.8%
- Per capita income change in non-downtown tracts from 2012 to 2022: +22.2%
18. Evansville, Indiana
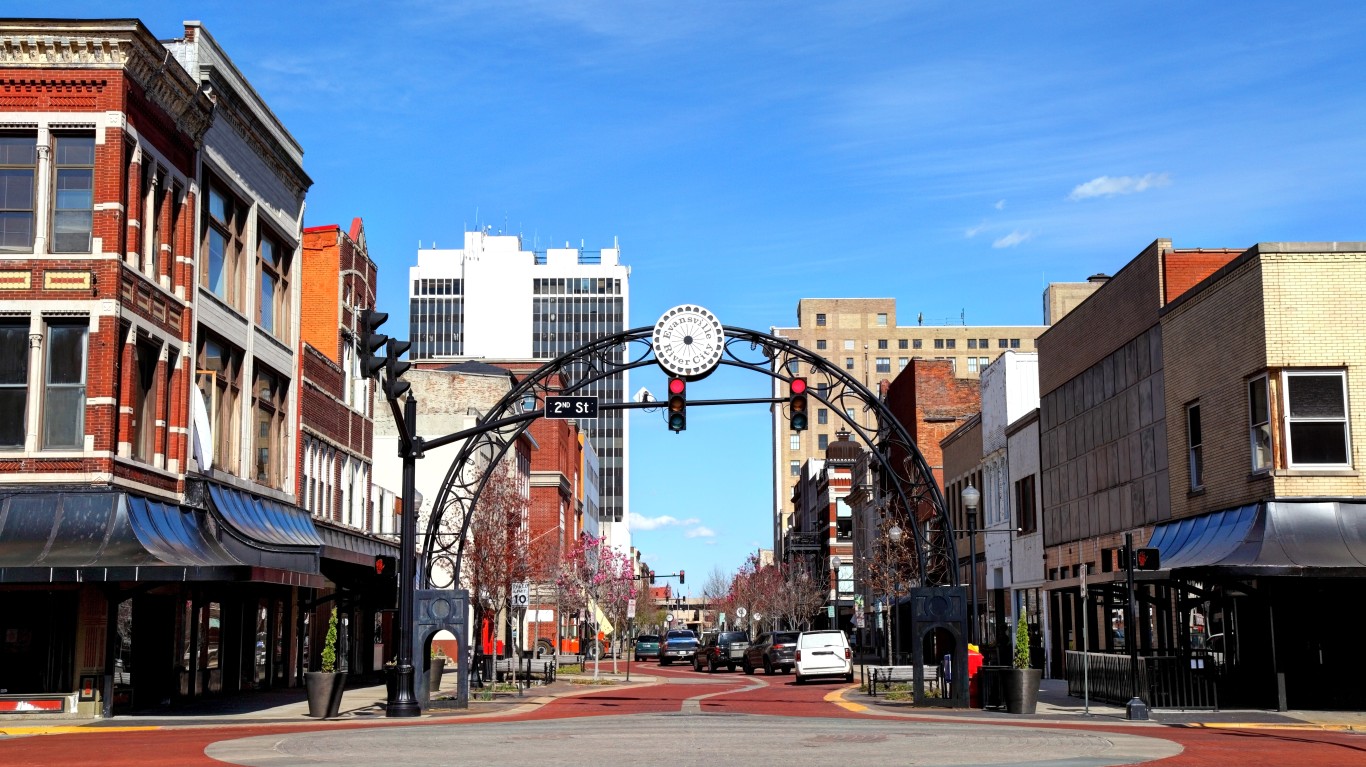
- Population change in downtown tracts from 2012 to 2022: -15.6%
- Population change of non-downtown tracts from 2012 to 2022: +0.2%
- Per capita income change in downtown tracts from 2012 to 2022: +10.5%
- Per capita income change in non-downtown tracts from 2012 to 2022: +8.6%
17. Lima, Ohio
- Population change in downtown tracts from 2012 to 2022: -16.0%
- Population change of non-downtown tracts from 2012 to 2022: +8.3%
- Per capita income change in downtown tracts from 2012 to 2022: +17.7%
- Per capita income change in non-downtown tracts from 2012 to 2022: -1.3%
16. Flint, Michigan
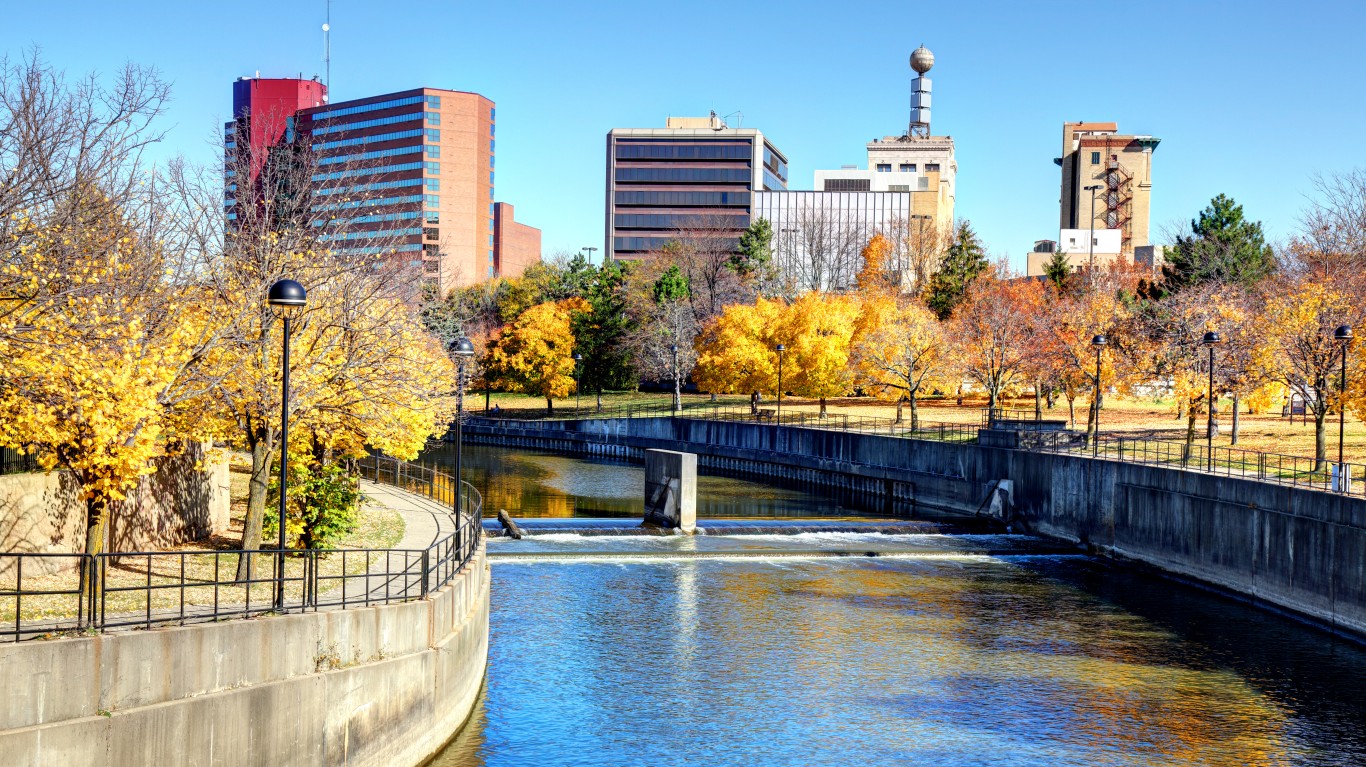
- Population change in downtown tracts from 2012 to 2022: -16.9%
- Population change of non-downtown tracts from 2012 to 2022: -22.0%
- Per capita income change in downtown tracts from 2012 to 2022: +19.1%
- Per capita income change in non-downtown tracts from 2012 to 2022: +7.1%
15. Yuma, Arizona
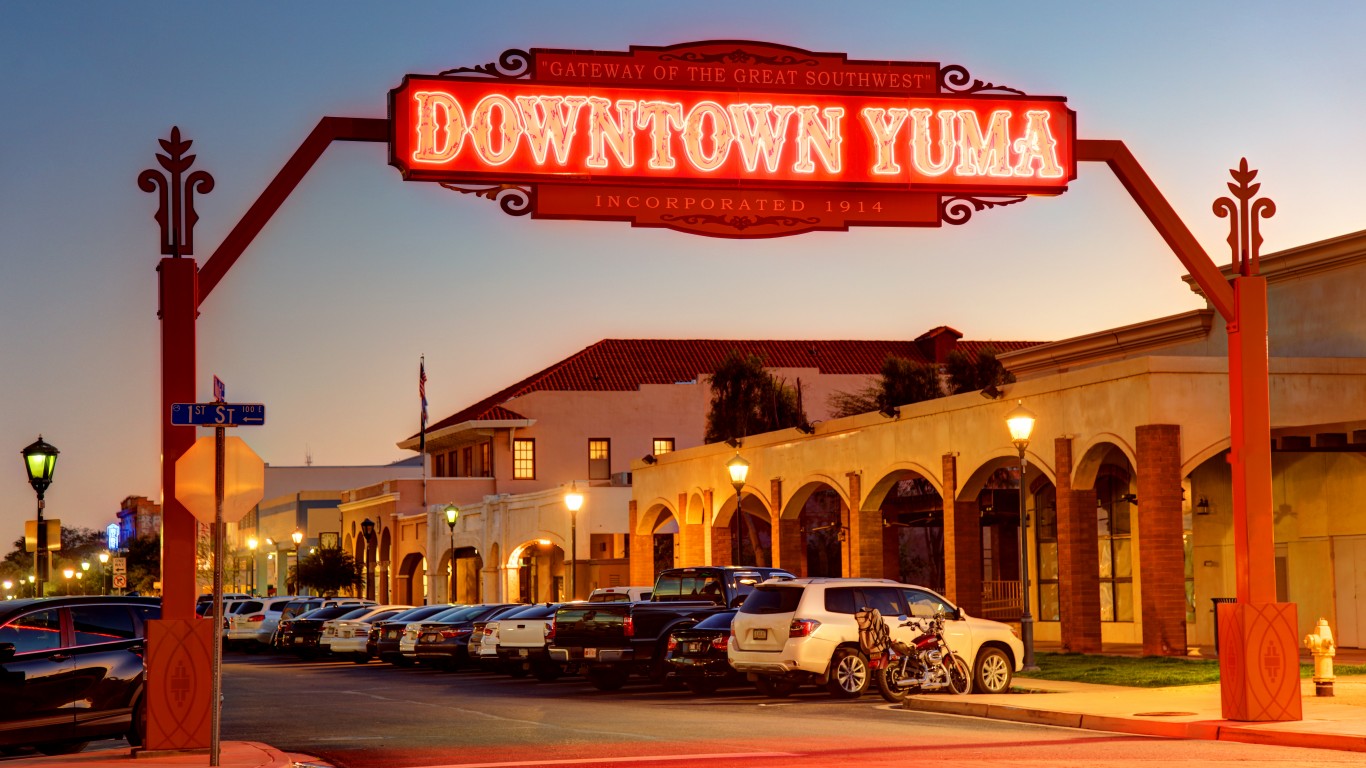
- Population change in downtown tracts from 2012 to 2022: -17.0%
- Population change of non-downtown tracts from 2012 to 2022: -5.4%
- Per capita income change in downtown tracts from 2012 to 2022: +23.6%
- Per capita income change in non-downtown tracts from 2012 to 2022: +19.6%
14. Bangor, Maine
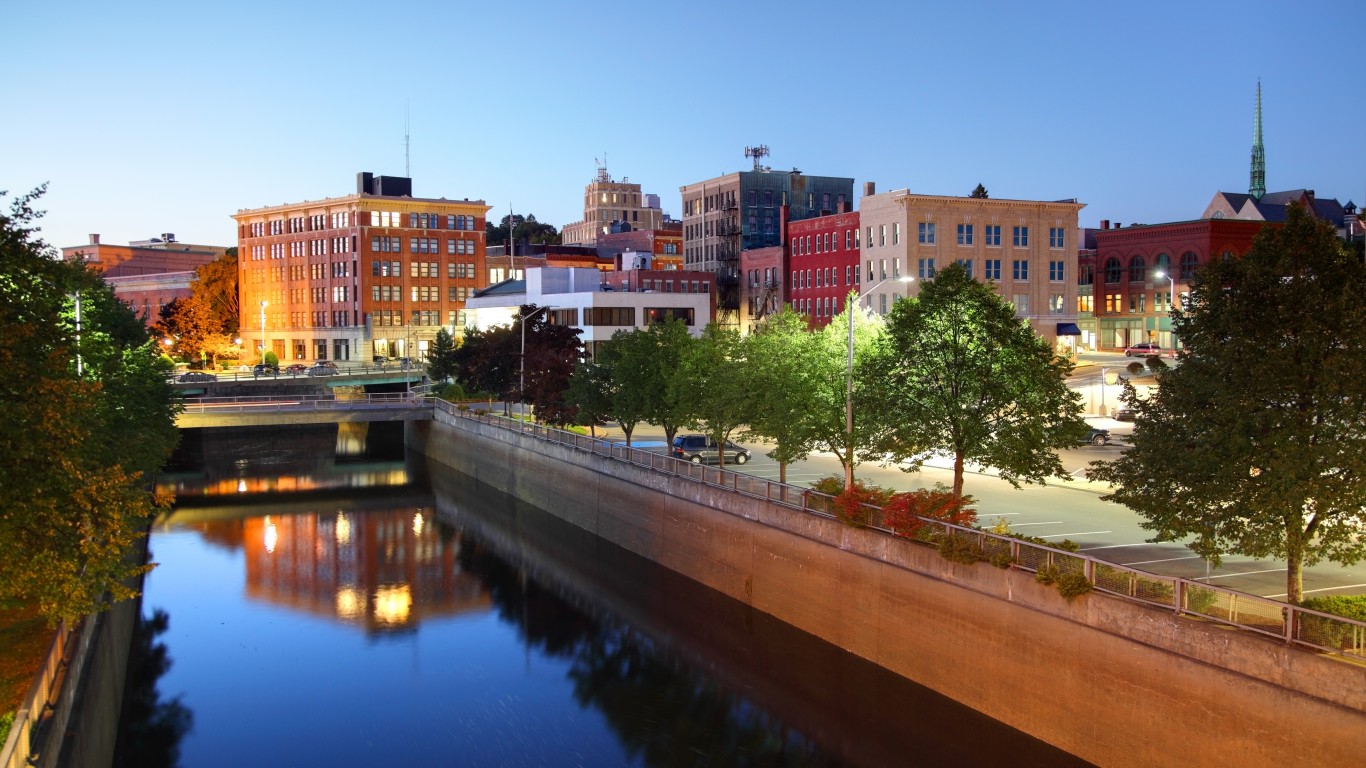
- Population change in downtown tracts from 2012 to 2022: -17.2%
- Population change of non-downtown tracts from 2012 to 2022: +4.4%
- Per capita income change in downtown tracts from 2012 to 2022: +25.7%
- Per capita income change in non-downtown tracts from 2012 to 2022: +16.7%
13. Victoria, Texas
- Population change in downtown tracts from 2012 to 2022: -17.8%
- Population change of non-downtown tracts from 2012 to 2022: +5.7%
- Per capita income change in downtown tracts from 2012 to 2022: -6.3%
- Per capita income change in non-downtown tracts from 2012 to 2022: +2.1%
12. Topeka, Kansas
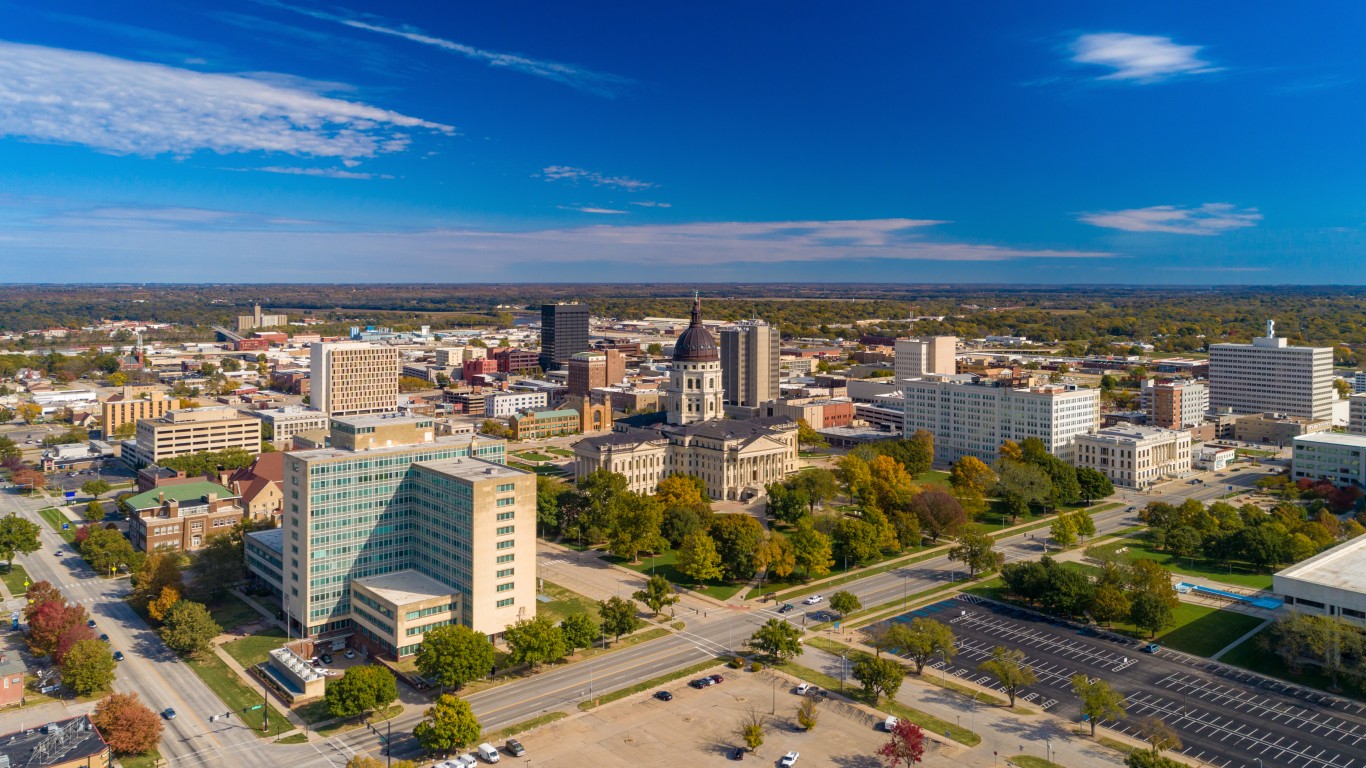
- Population change in downtown tracts from 2012 to 2022: -18.4%
- Population change of non-downtown tracts from 2012 to 2022: +3.2%
- Per capita income change in downtown tracts from 2012 to 2022: +33.2%
- Per capita income change in non-downtown tracts from 2012 to 2022: +5.0%
11. Savannah, Georgia
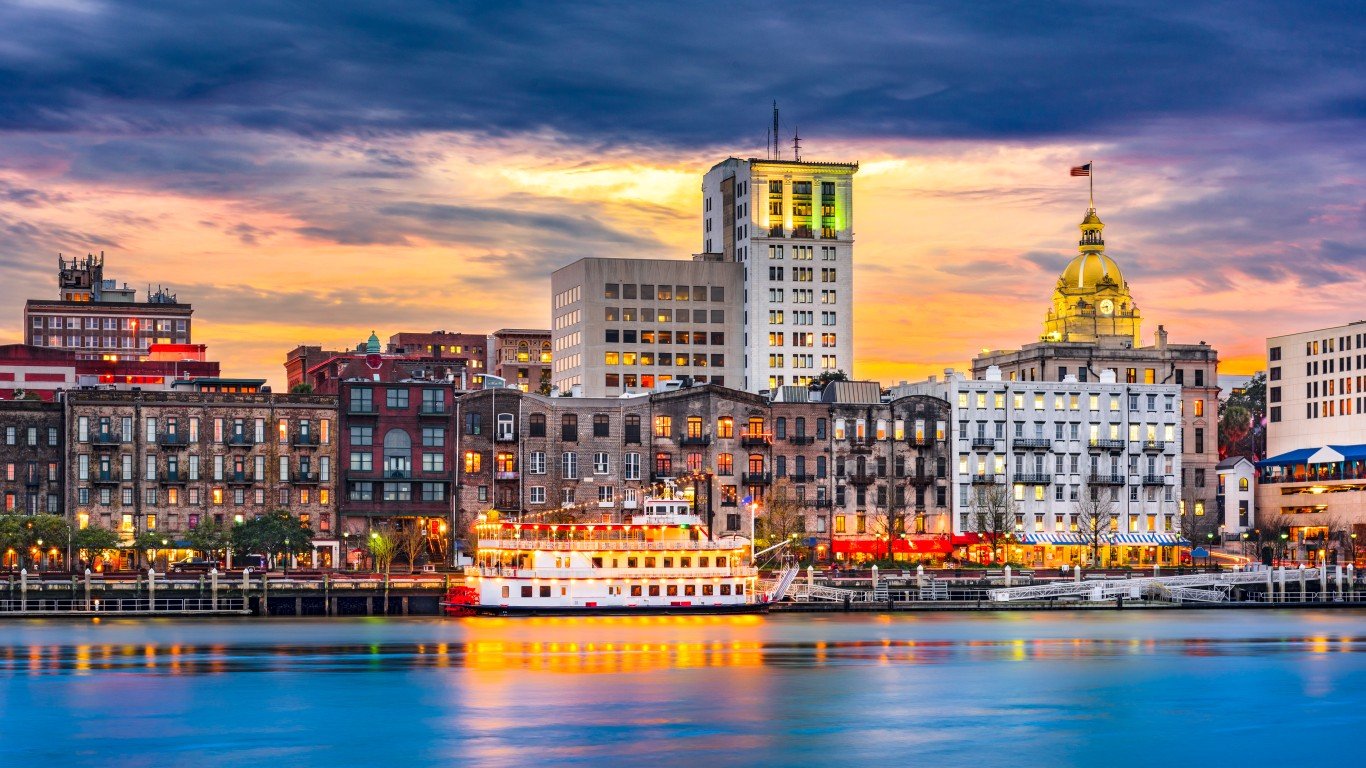
- Population change in downtown tracts from 2012 to 2022: -18.4%
- Population change of non-downtown tracts from 2012 to 2022: +1.8%
- Per capita income change in downtown tracts from 2012 to 2022: +76.9%
- Per capita income change in non-downtown tracts from 2012 to 2022: +15.2%
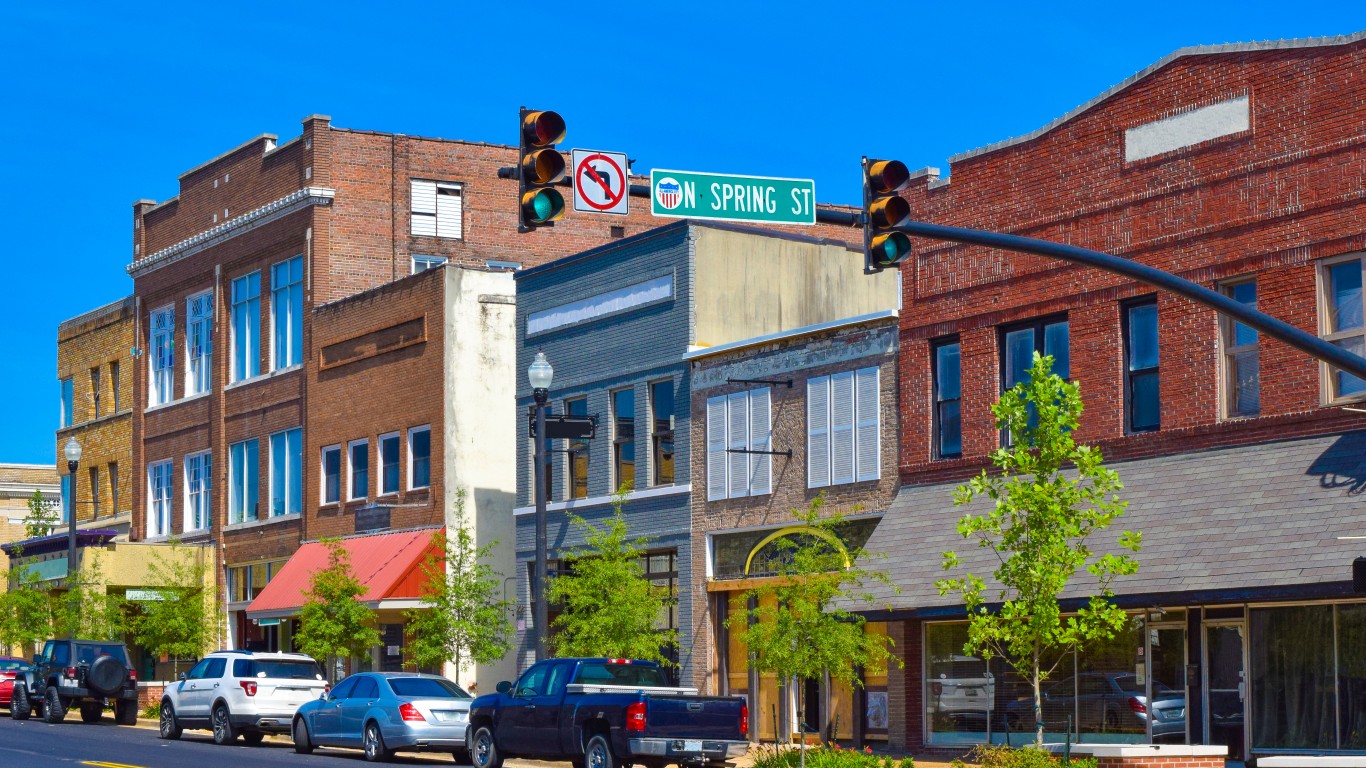
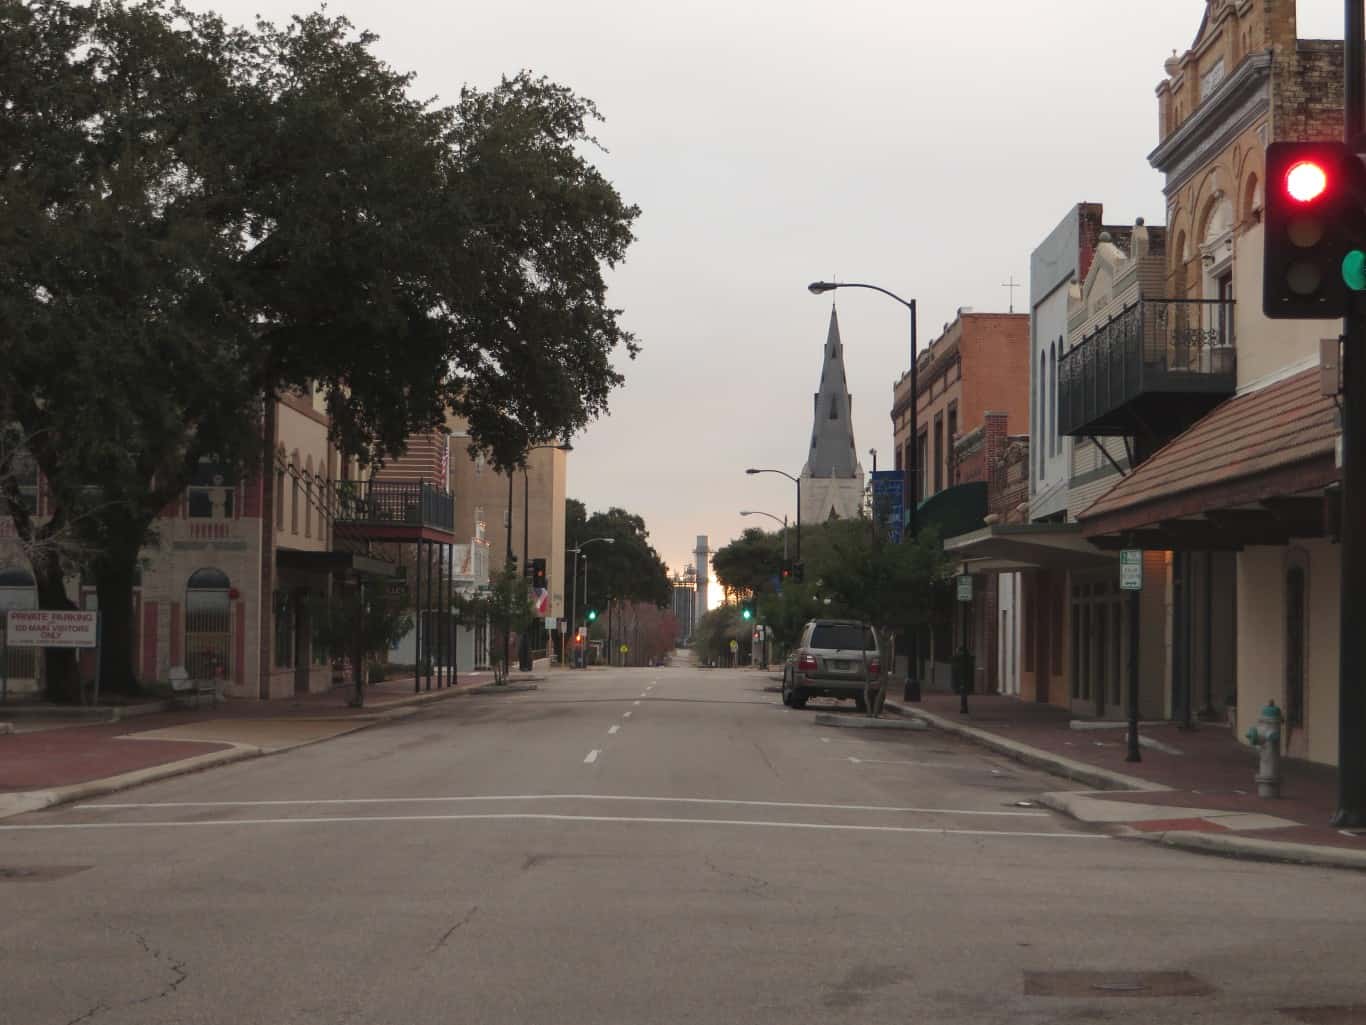
10. Texarkana, Texas
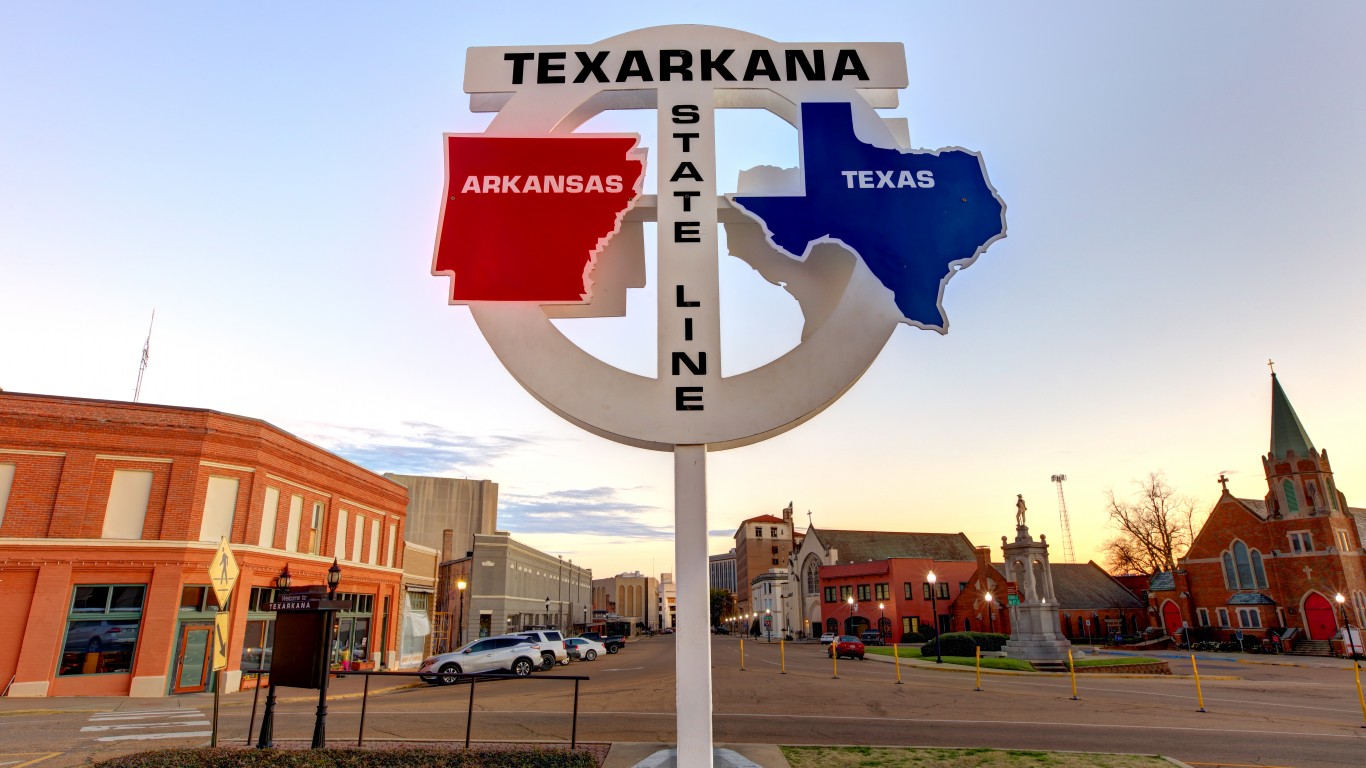
- Population change in downtown tracts from 2012 to 2022: -19.9%
- Population change of non-downtown tracts from 2012 to 2022: -2.2%
- Per capita income change in downtown tracts from 2012 to 2022: +28.7%
- Per capita income change in non-downtown tracts from 2012 to 2022: +1.3%
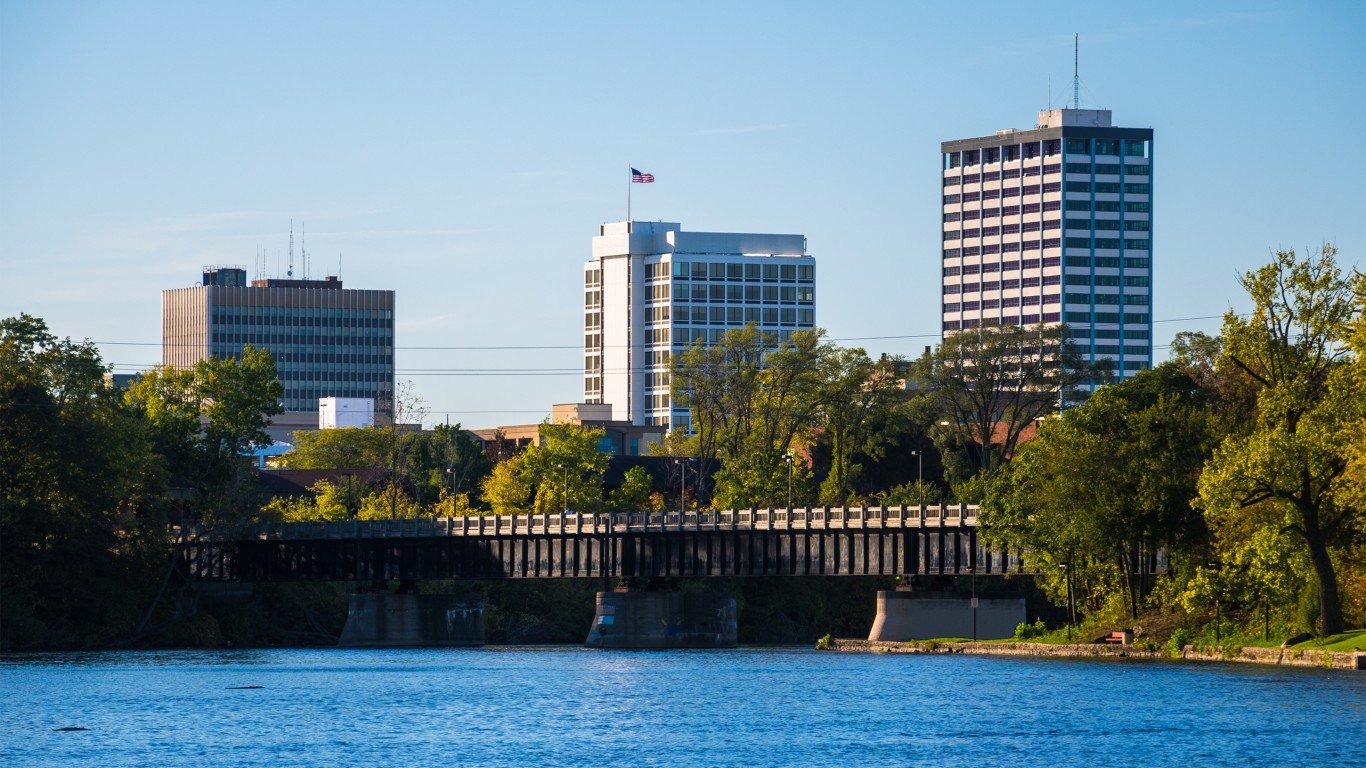
9. Saginaw, Michigan
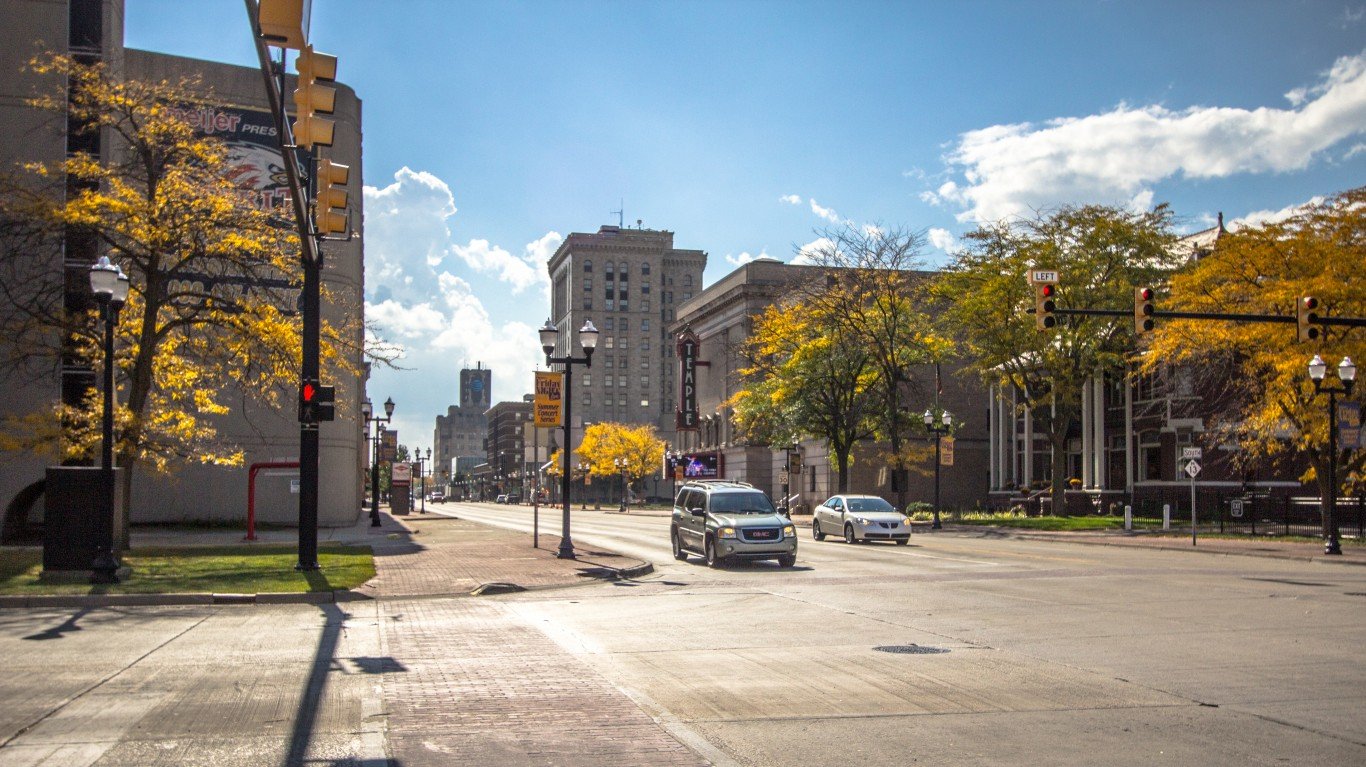
- Population change in downtown tracts from 2012 to 2022: -20.2%
- Population change of non-downtown tracts from 2012 to 2022: -11.8%
- Per capita income change in downtown tracts from 2012 to 2022: +26.4%
- Per capita income change in non-downtown tracts from 2012 to 2022: -0.6%
8. Sumter, South Carolina

- Population change in downtown tracts from 2012 to 2022: -21.0%
- Population change of non-downtown tracts from 2012 to 2022: +9.6%
- Per capita income change in downtown tracts from 2012 to 2022: -7.5%
- Per capita income change in non-downtown tracts from 2012 to 2022: -9.5%
7. Shreveport, Louisiana
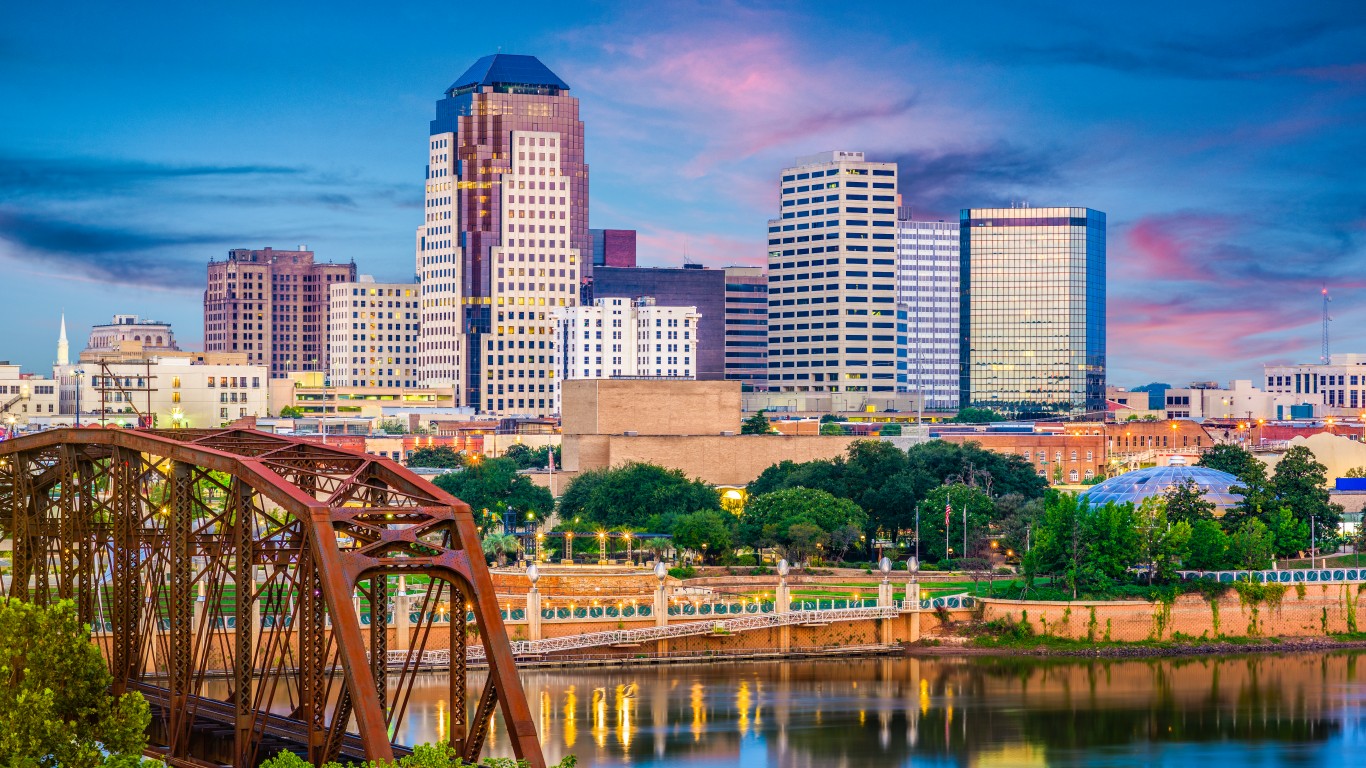
- Population change in downtown tracts from 2012 to 2022: -21.0%
- Population change of non-downtown tracts from 2012 to 2022: -8.9%
- Per capita income change in downtown tracts from 2012 to 2022: +92.2%
- Per capita income change in non-downtown tracts from 2012 to 2022: -1.2%
6. Alexandria, Louisiana
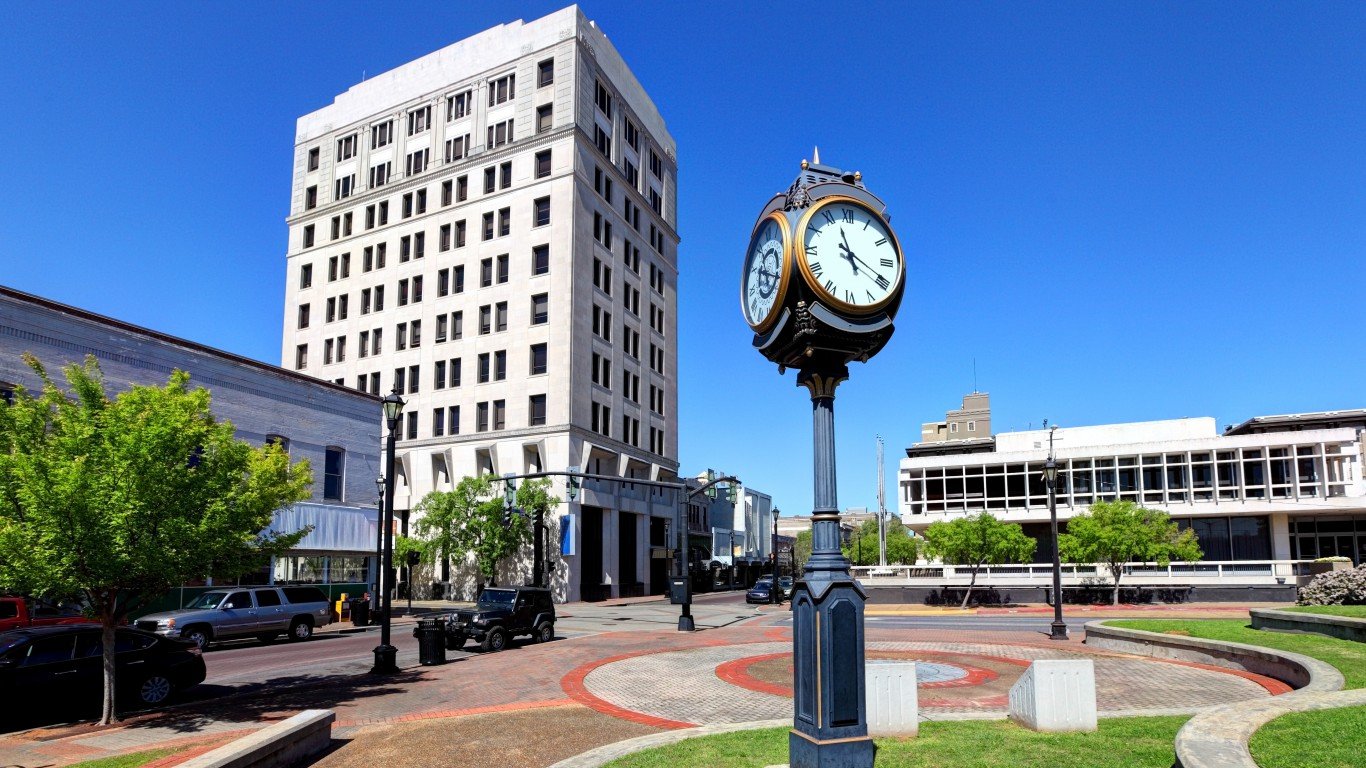
- Population change in downtown tracts from 2012 to 2022: -21.3%
- Population change of non-downtown tracts from 2012 to 2022: -1.0%
- Per capita income change in downtown tracts from 2012 to 2022: +29.3%
- Per capita income change in non-downtown tracts from 2012 to 2022: -10.3%
5. Anniston, Alabama
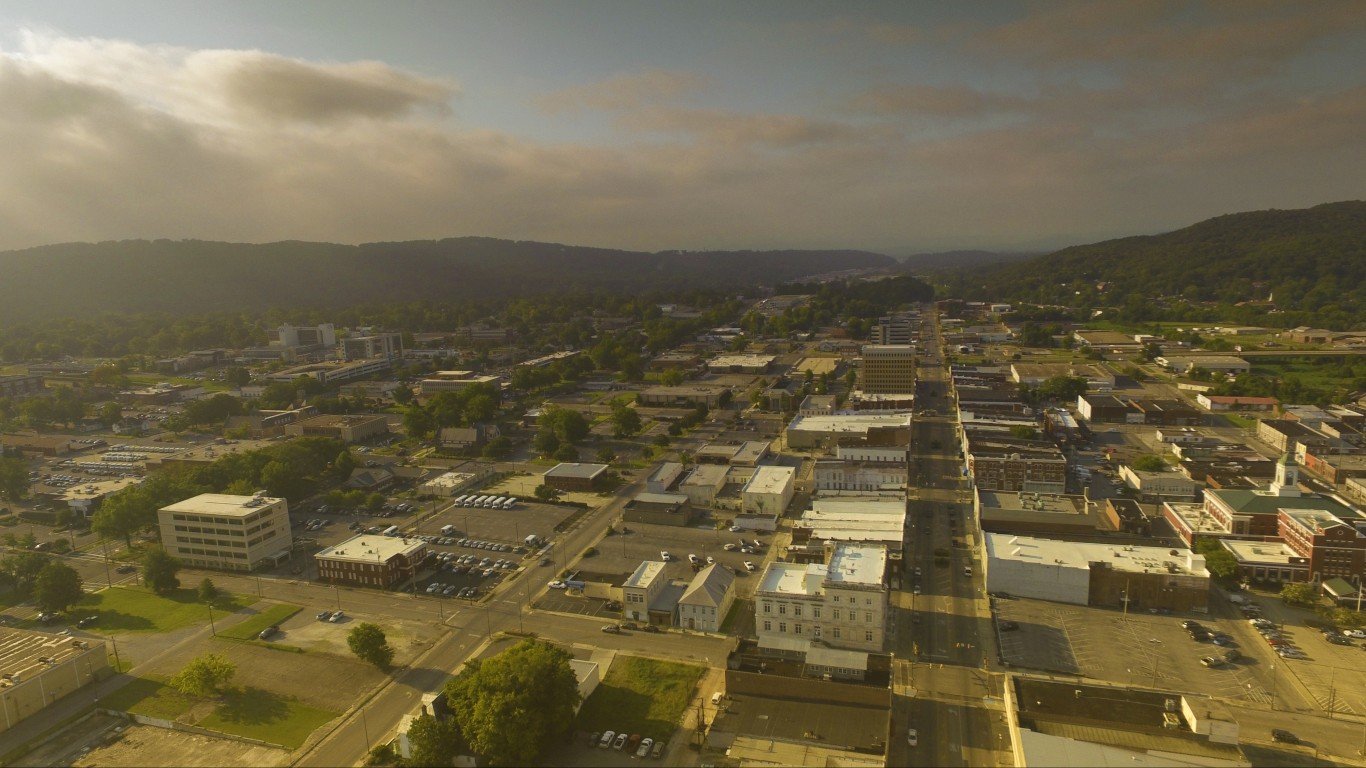
- Population change in downtown tracts from 2012 to 2022: -22.2%
- Population change of non-downtown tracts from 2012 to 2022: +5.9%
- Per capita income change in downtown tracts from 2012 to 2022: +10.5%
- Per capita income change in non-downtown tracts from 2012 to 2022: +4.9%
4. Birmingham, Alabama

- Population change in downtown tracts from 2012 to 2022: -22.5%
- Population change of non-downtown tracts from 2012 to 2022: -9.6%
- Per capita income change in downtown tracts from 2012 to 2022: +28.7%
- Per capita income change in non-downtown tracts from 2012 to 2022: +15.6%
3. Columbus, Georgia
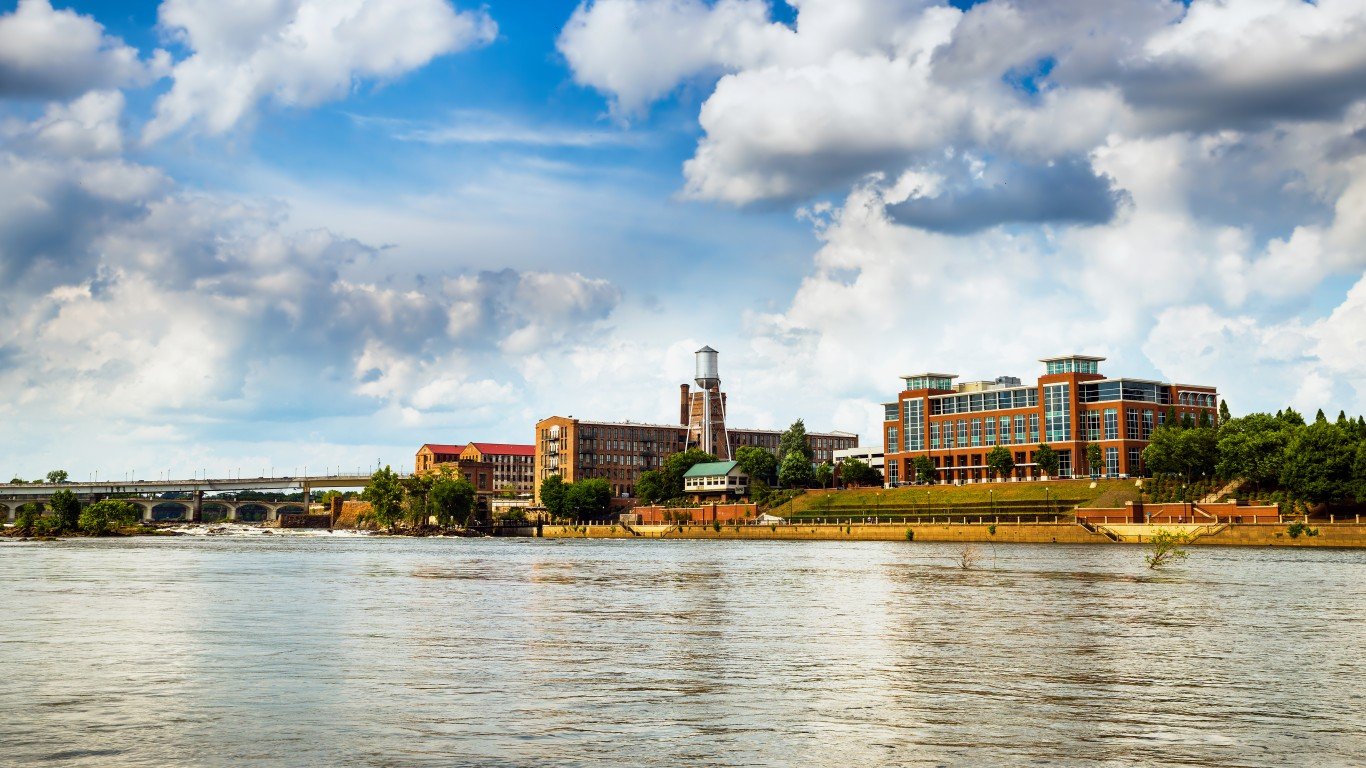
- Population change in downtown tracts from 2012 to 2022: -25.4%
- Population change of non-downtown tracts from 2012 to 2022: +3.6%
- Per capita income change in downtown tracts from 2012 to 2022: +41.4%
- Per capita income change in non-downtown tracts from 2012 to 2022: +1.0%
2. Pine Bluff, Arkansas
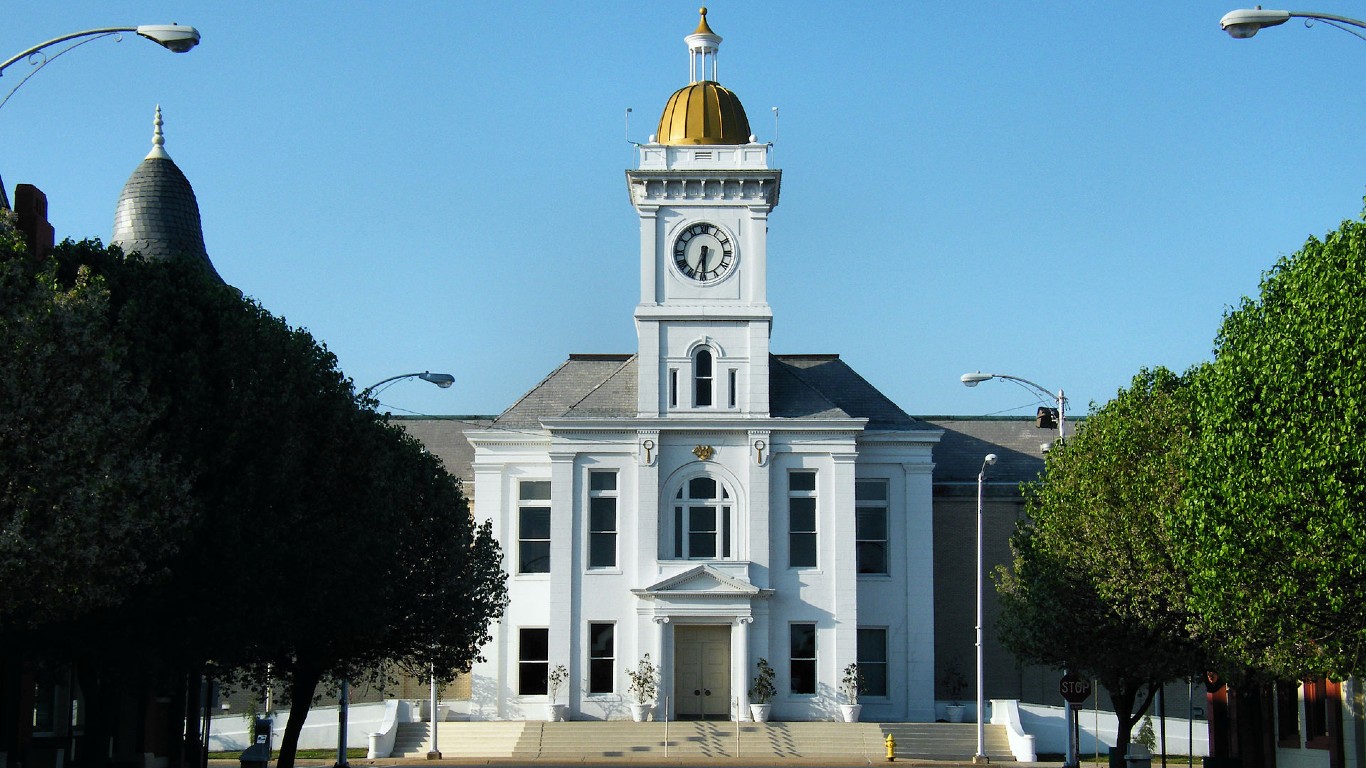
- Population change in downtown tracts from 2012 to 2022: -30.5%
- Population change of non-downtown tracts from 2012 to 2022: -10.0%
- Per capita income change in downtown tracts from 2012 to 2022: +19.1%
- Per capita income change in non-downtown tracts from 2012 to 2022: +1.4%
1. Albany, Georgia
- Population change in downtown tracts from 2012 to 2022: -39.3%
- Population change of non-downtown tracts from 2012 to 2022: -4.0%
- Per capita income change in downtown tracts from 2012 to 2022: +23.7%
- Per capita income change in non-downtown tracts from 2012 to 2022: +1.9%
Want to Retire Early? Start Here (Sponsor)
Want retirement to come a few years earlier than you’d planned? Or are you ready to retire now, but want an extra set of eyes on your finances?
Now you can speak with up to 3 financial experts in your area for FREE. By simply clicking here you can begin to match with financial professionals who can help you build your plan to retire early. And the best part? The first conversation with them is free.
Click here to match with up to 3 financial pros who would be excited to help you make financial decisions.
The post Residents Are Fleeing From These City Centers appeared first on 24/7 Wall St..