More than 60 years have passed since President Lyndon Johnson declared war on poverty, and yet, poverty remains endemic in the United States. In any given year over the last three decades, anywhere from 31.6 million to 48.8 million Americans were living below the poverty line. Over that period, the annual U.S. poverty rate climbed as high as 15.9%, and never fell below 11.3%.
The effects of poverty extend far beyond economics. According to the latest Pulse Survey from the U.S. Census Bureau, 38% of American adults earning less than $25,000 reported feeling depressed or hopeless on most days, compared to 17% of all adults. Additionally, 27% of adults in the lowest income bracket reported not having enough to eat within the last week, three times the food insufficiency rate among all adults.
In most of the country, including Massachusetts, the U.S. Department of Health and Human Services sets the poverty line at an annual income of $15,060 for individuals and $31,200 for a family of four. In Massachusetts, 9.9% of the population live below these thresholds — and in many towns across the state, the poverty rate is far higher.
Using five-year estimates from the Census’ 2022 American Community Survey, 24/7 Wall St. identified the towns in Massachusetts with the highest poverty rates. We considered all places — including cities, towns, and unincorporated communities — with populations between 5,000 and 50,000. Because the presence of colleges and universities can distort economic realities in a given area, places where 20% or more of the population are enrolled in a post-secondary institution were excluded from analysis.
Among the 21 places on this list, poverty rates range from 10.1% to 26.0%, and in all but two of these places, the typical household earns less than the statewide median household income of $96,505.
Widespread financial hardship in these areas is partially attributable to a lack of economic opportunity. In most places on this list, the five-year average unemployment rate is higher than the comparable 5.3% jobless rate across Massachusetts.
Incomes and job security tend to rise with educational attainment. According to the Bureau of Labor Statistics, the typical worker with a bachelor’s degree earns 66% more than those with no more than a high school diploma. Additionally, workers with only a high school education are far more likely to be unemployed than college graduates. In nearly every town on this list, the share of adults with a bachelor’s degree is below the 45.9% statewide bachelor’s degree attainment rate.
Why It Matters

The United States is, in many ways, the center of gravity of the global economy. The U.S. dollar has been the world’s leading reserve currency since the end of World War II, and American gross domestic product accounts for over a quarter of economic activity worldwide. Despite these advantages, more than one in every 10 Americans have been living below the poverty line for decades. For those facing serious financial hardship, the effects are far reaching. Poverty can negatively impact mental health, social relationships, and life expectancy.
21. Milford
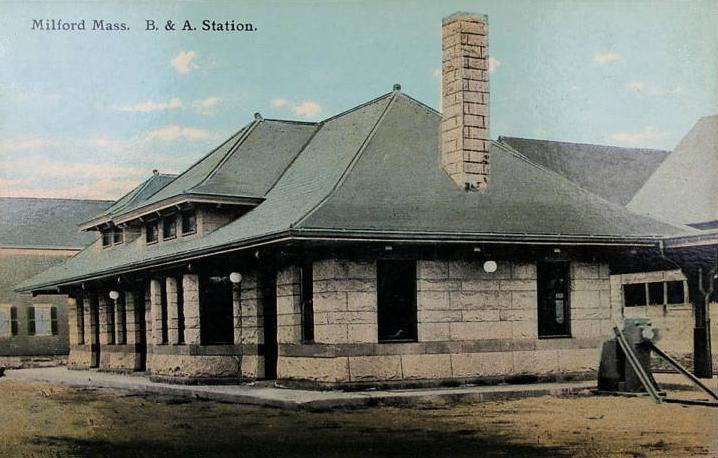
- Poverty rate: 10.1%
- Median household income: $89,608
- 5-yr. avg. unemployment rate: 5.9%
- Adults with a bachelor’s degree or higher: 32.1%
- Population: 27,569
20. Beverly
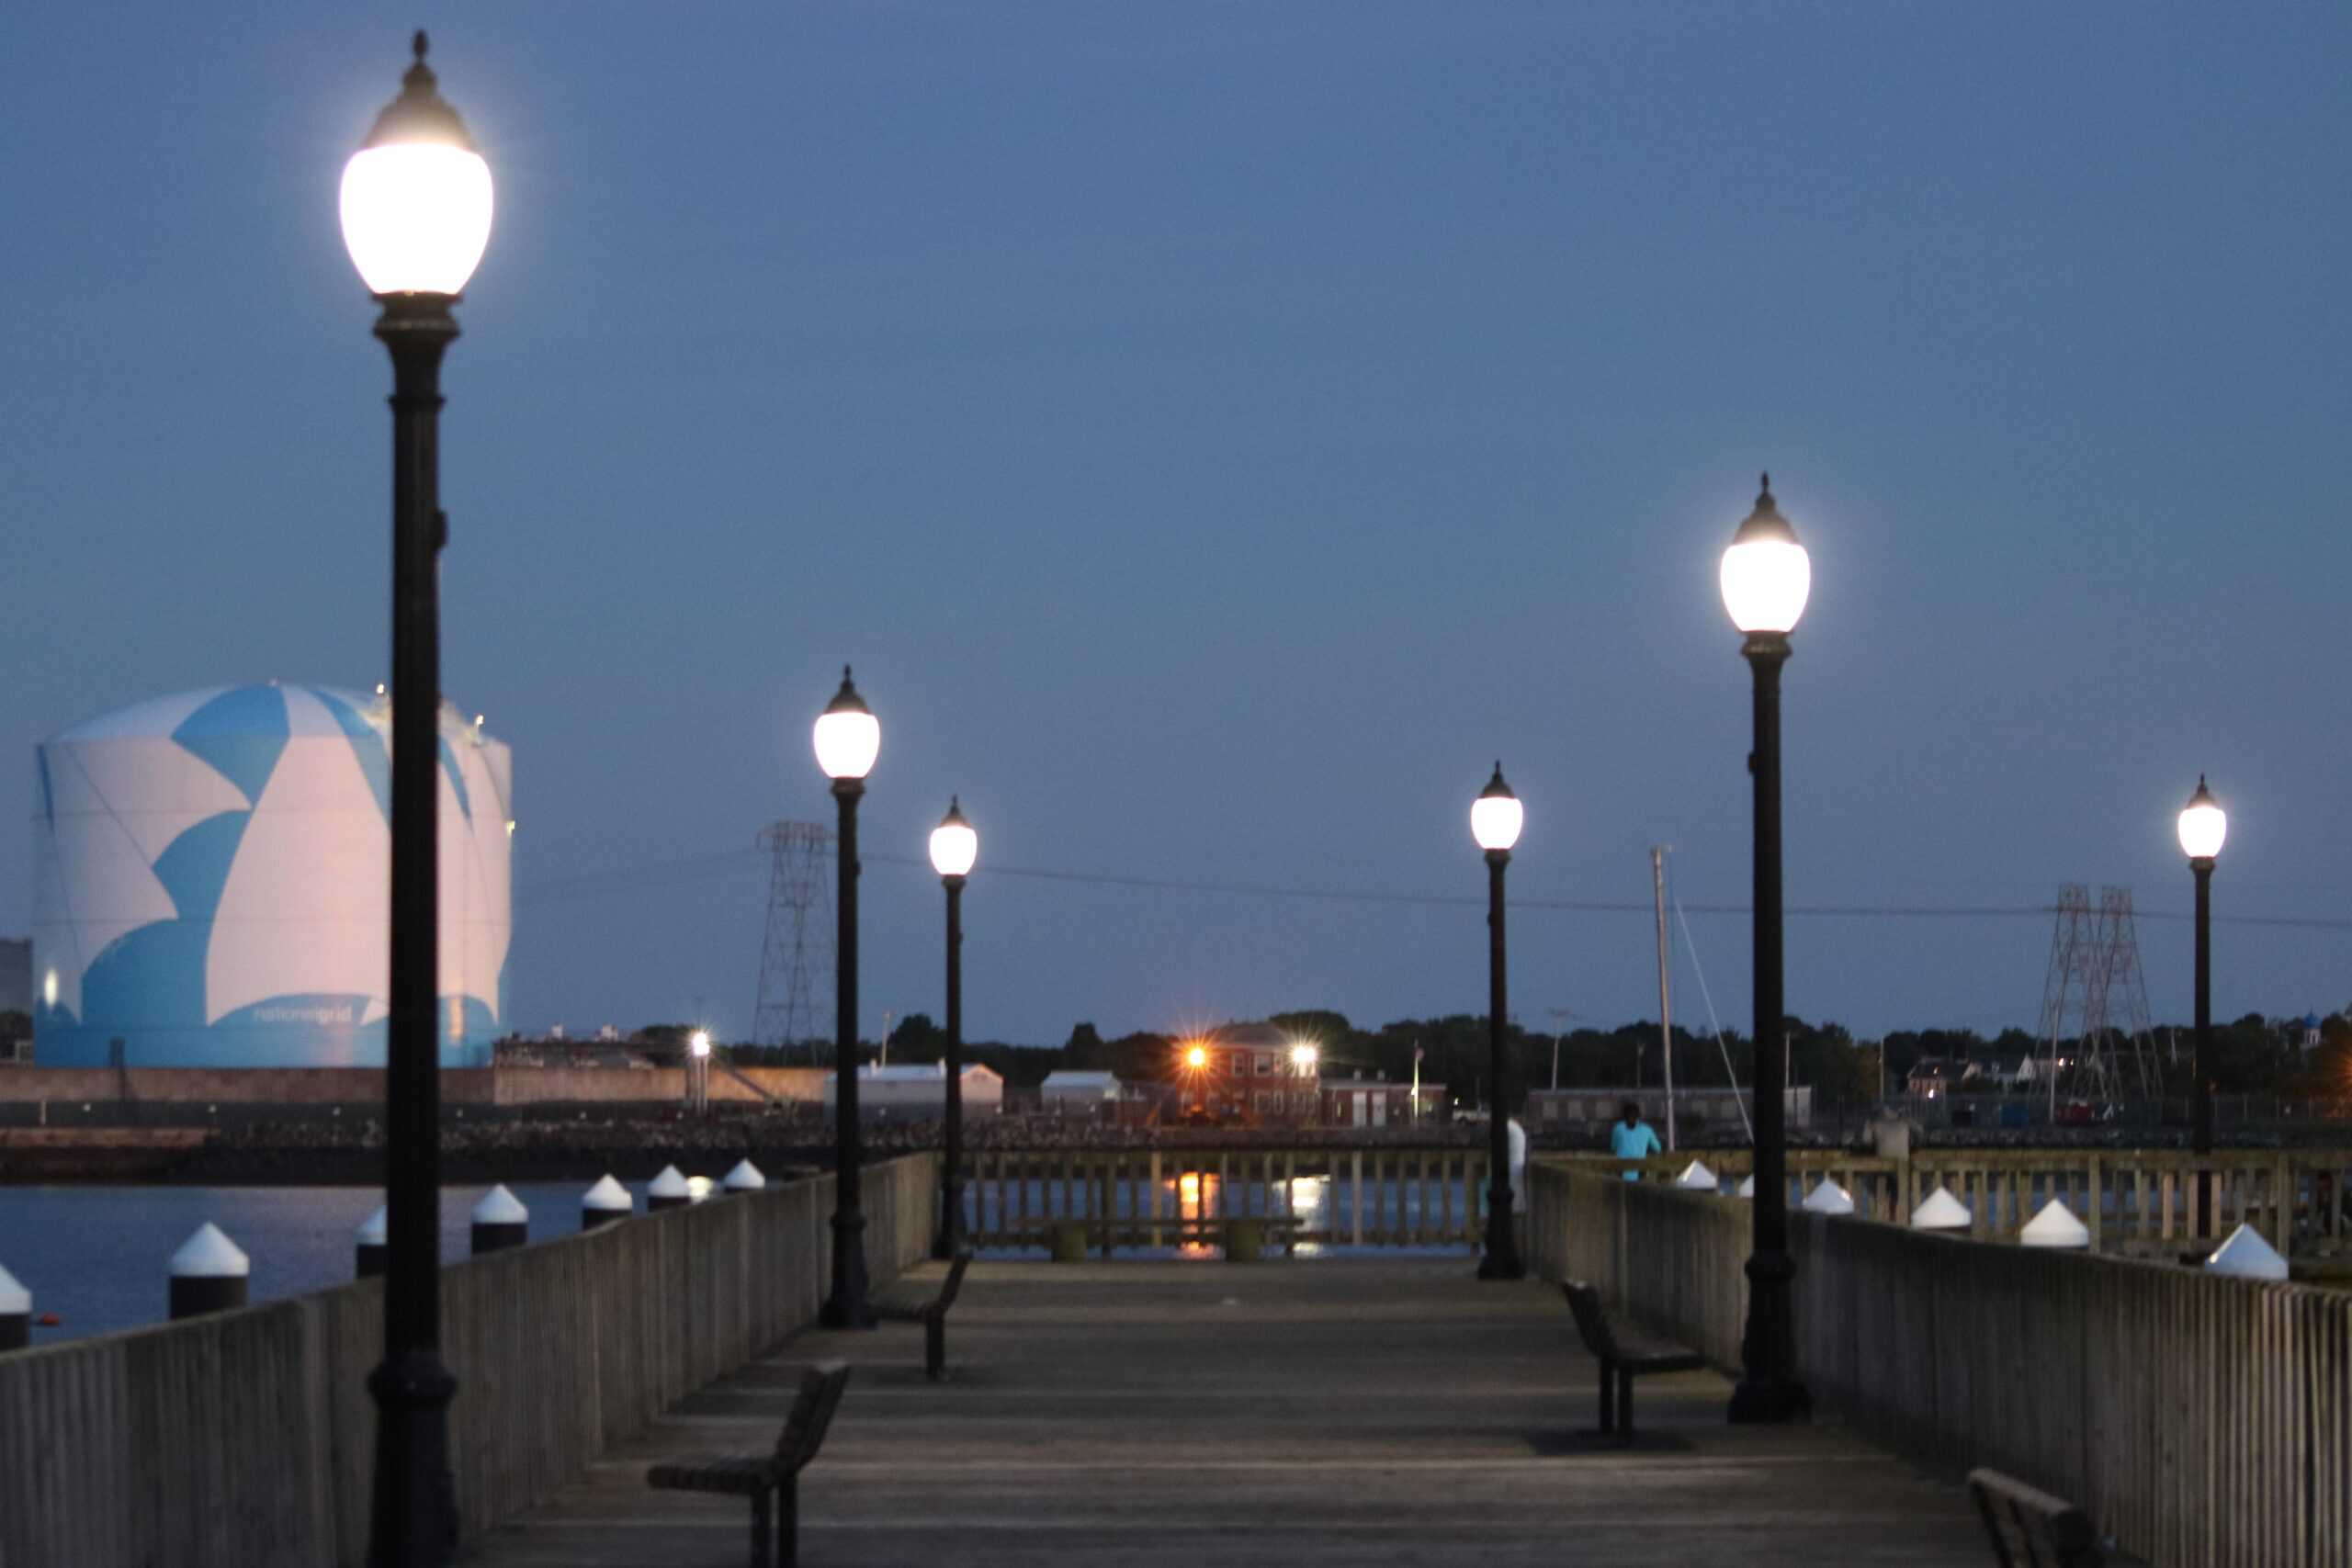
- Poverty rate: 10.5%
- Median household income: $99,525
- 5-yr. avg. unemployment rate: 3.3%
- Adults with a bachelor’s degree or higher: 52.4%
- Population: 42,414
19. West Springfield Town
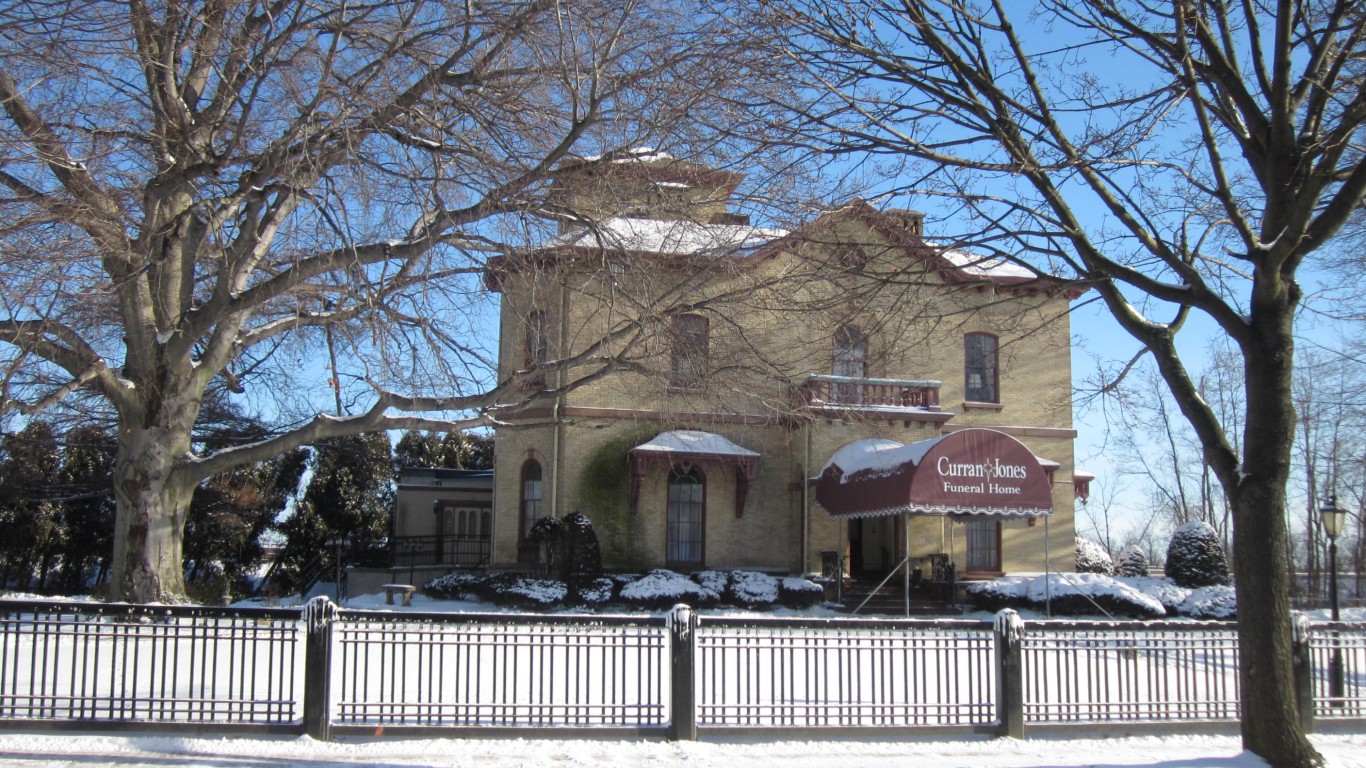
- Poverty rate: 10.5%
- Median household income: $67,297
- 5-yr. avg. unemployment rate: 5.8%
- Adults with a bachelor’s degree or higher: 36.5%
- Population: 28,755
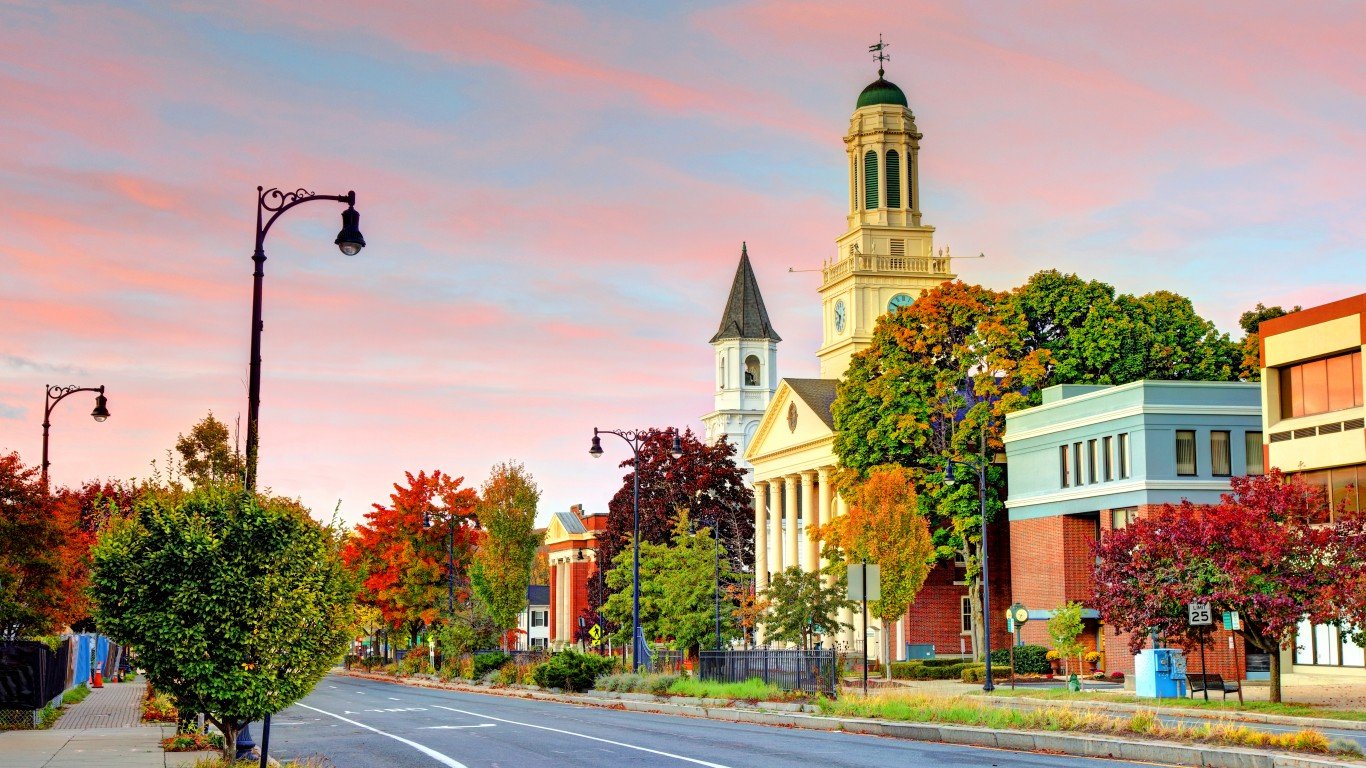
18. Gloucester

- Poverty rate: 10.8%
- Median household income: $84,465
- 5-yr. avg. unemployment rate: 5.8%
- Adults with a bachelor’s degree or higher: 39.6%
- Population: 29,830
17. Northampton

- Poverty rate: 11.3%
- Median household income: $80,981
- 5-yr. avg. unemployment rate: 5.6%
- Adults with a bachelor’s degree or higher: 62.9%
- Population: 28,245
16. Athol

- Poverty rate: 13.3%
- Median household income: $62,962
- 5-yr. avg. unemployment rate: 8.1%
- Adults with a bachelor’s degree or higher: 21.0%
- Population: 9,148
15. Salem

- Poverty rate: 13.7%
- Median household income: $79,196
- 5-yr. avg. unemployment rate: 5.0%
- Adults with a bachelor’s degree or higher: 48.2%
- Population: 44,541
14. Pittsfield
- Poverty rate: 13.8%
- Median household income: $66,859
- 5-yr. avg. unemployment rate: 7.1%
- Adults with a bachelor’s degree or higher: 34.2%
- Population: 43,730
13. Fitchburg

- Poverty rate: 13.9%
- Median household income: $65,963
- 5-yr. avg. unemployment rate: 7.6%
- Adults with a bachelor’s degree or higher: 23.7%
- Population: 41,621
12. Everett
- Poverty rate: 14.4%
- Median household income: $77,796
- 5-yr. avg. unemployment rate: 6.5%
- Adults with a bachelor’s degree or higher: 23.6%
- Population: 48,685
11. Middleborough Center

- Poverty rate: 14.7%
- Median household income: $79,811
- 5-yr. avg. unemployment rate: 3.7%
- Adults with a bachelor’s degree or higher: 29.0%
- Population: 7,807
10. Gardner

- Poverty rate: 14.8%
- Median household income: $56,974
- 5-yr. avg. unemployment rate: 6.4%
- Adults with a bachelor’s degree or higher: 19.4%
- Population: 21,090
9. Raynham Center
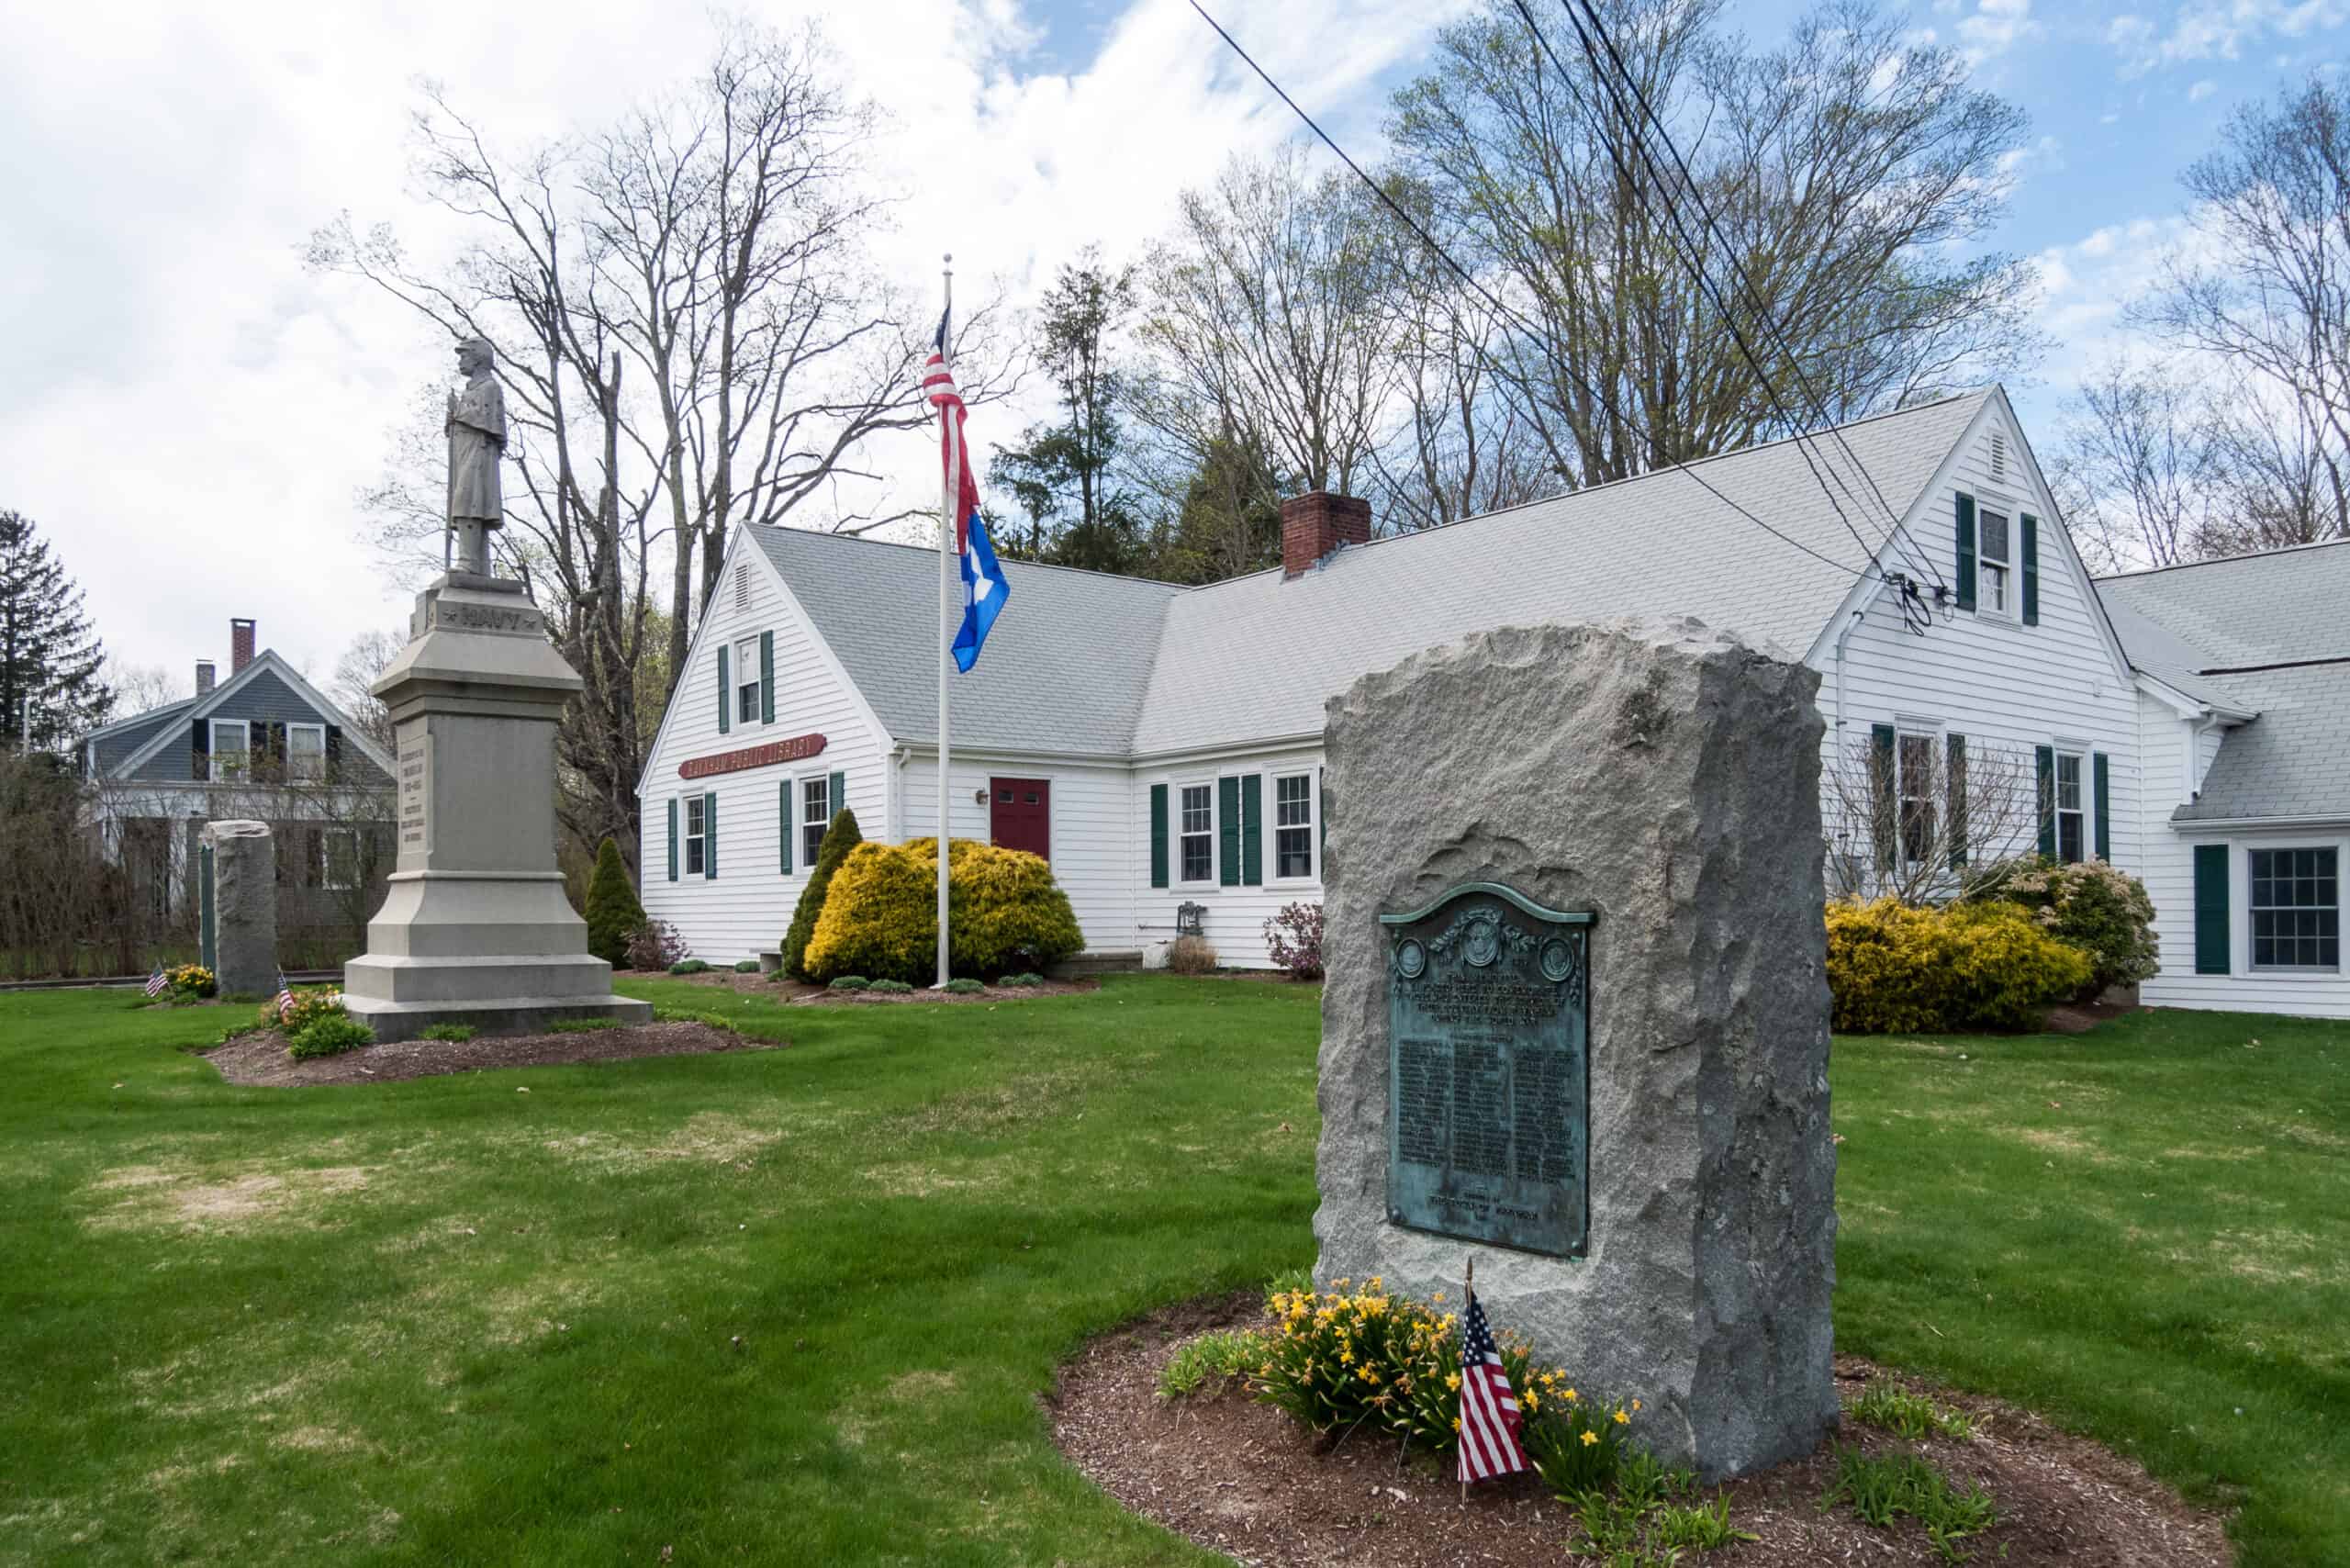
- Poverty rate: 14.9%
- Median household income: $98,984
- 5-yr. avg. unemployment rate: 7.4%
- Adults with a bachelor’s degree or higher: 32.6%
- Population: 5,074
8. North Adams
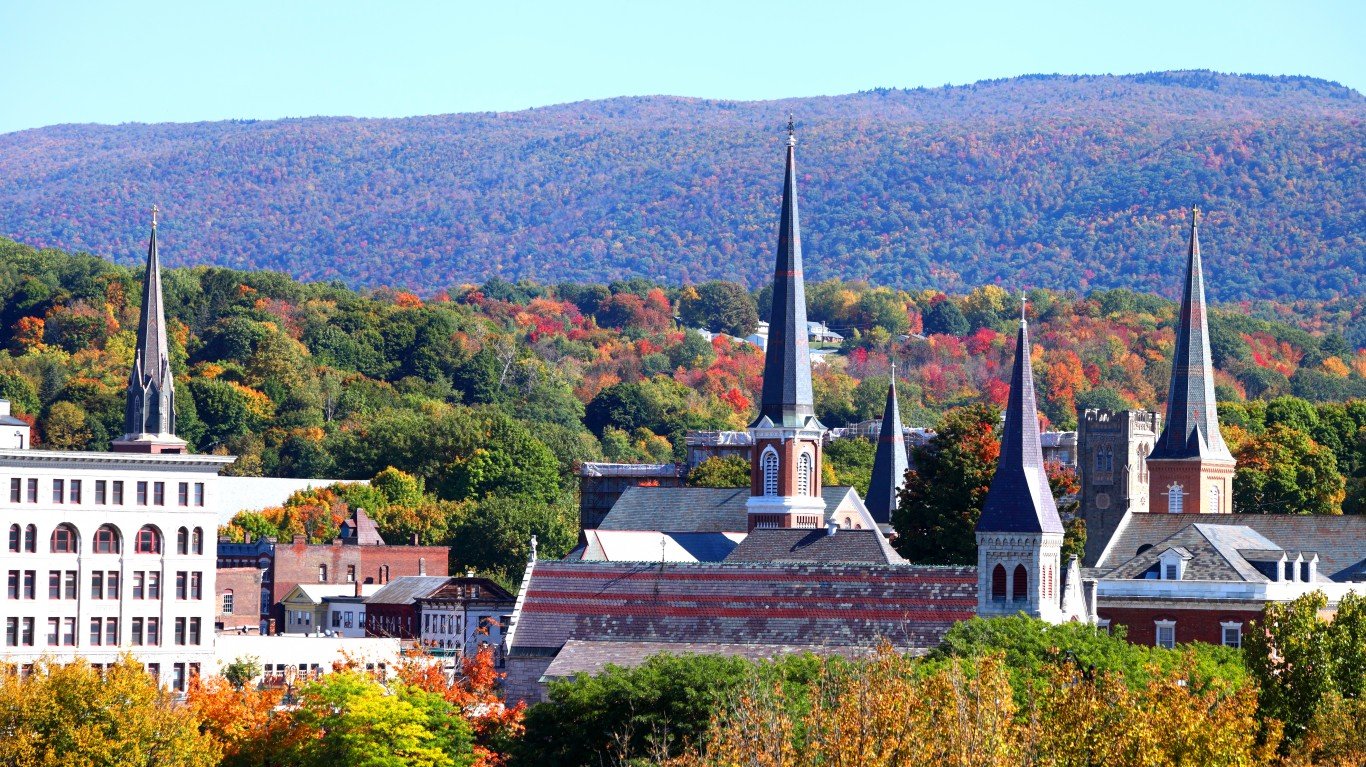
- Poverty rate: 15.1%
- Median household income: $49,525
- 5-yr. avg. unemployment rate: 5.0%
- Adults with a bachelor’s degree or higher: 26.3%
- Population: 12,937
7. Ware
- Poverty rate: 15.4%
- Median household income: $44,107
- 5-yr. avg. unemployment rate: 12.3%
- Adults with a bachelor’s degree or higher: 18.8%
- Population: 6,253
6. Greenfield

- Poverty rate: 15.5%
- Median household income: $53,149
- 5-yr. avg. unemployment rate: 5.4%
- Adults with a bachelor’s degree or higher: 37.0%
- Population: 17,674
5. Adams
- Poverty rate: 16.6%
- Median household income: $49,077
- 5-yr. avg. unemployment rate: 6.2%
- Adults with a bachelor’s degree or higher: 25.6%
- Population: 5,722
4. Southbridge Town
- Poverty rate: 17.9%
- Median household income: $55,182
- 5-yr. avg. unemployment rate: 9.1%
- Adults with a bachelor’s degree or higher: 17.0%
- Population: 17,669
3. Webster
- Poverty rate: 18.0%
- Median household income: $59,375
- 5-yr. avg. unemployment rate: 9.7%
- Adults with a bachelor’s degree or higher: 19.5%
- Population: 12,264
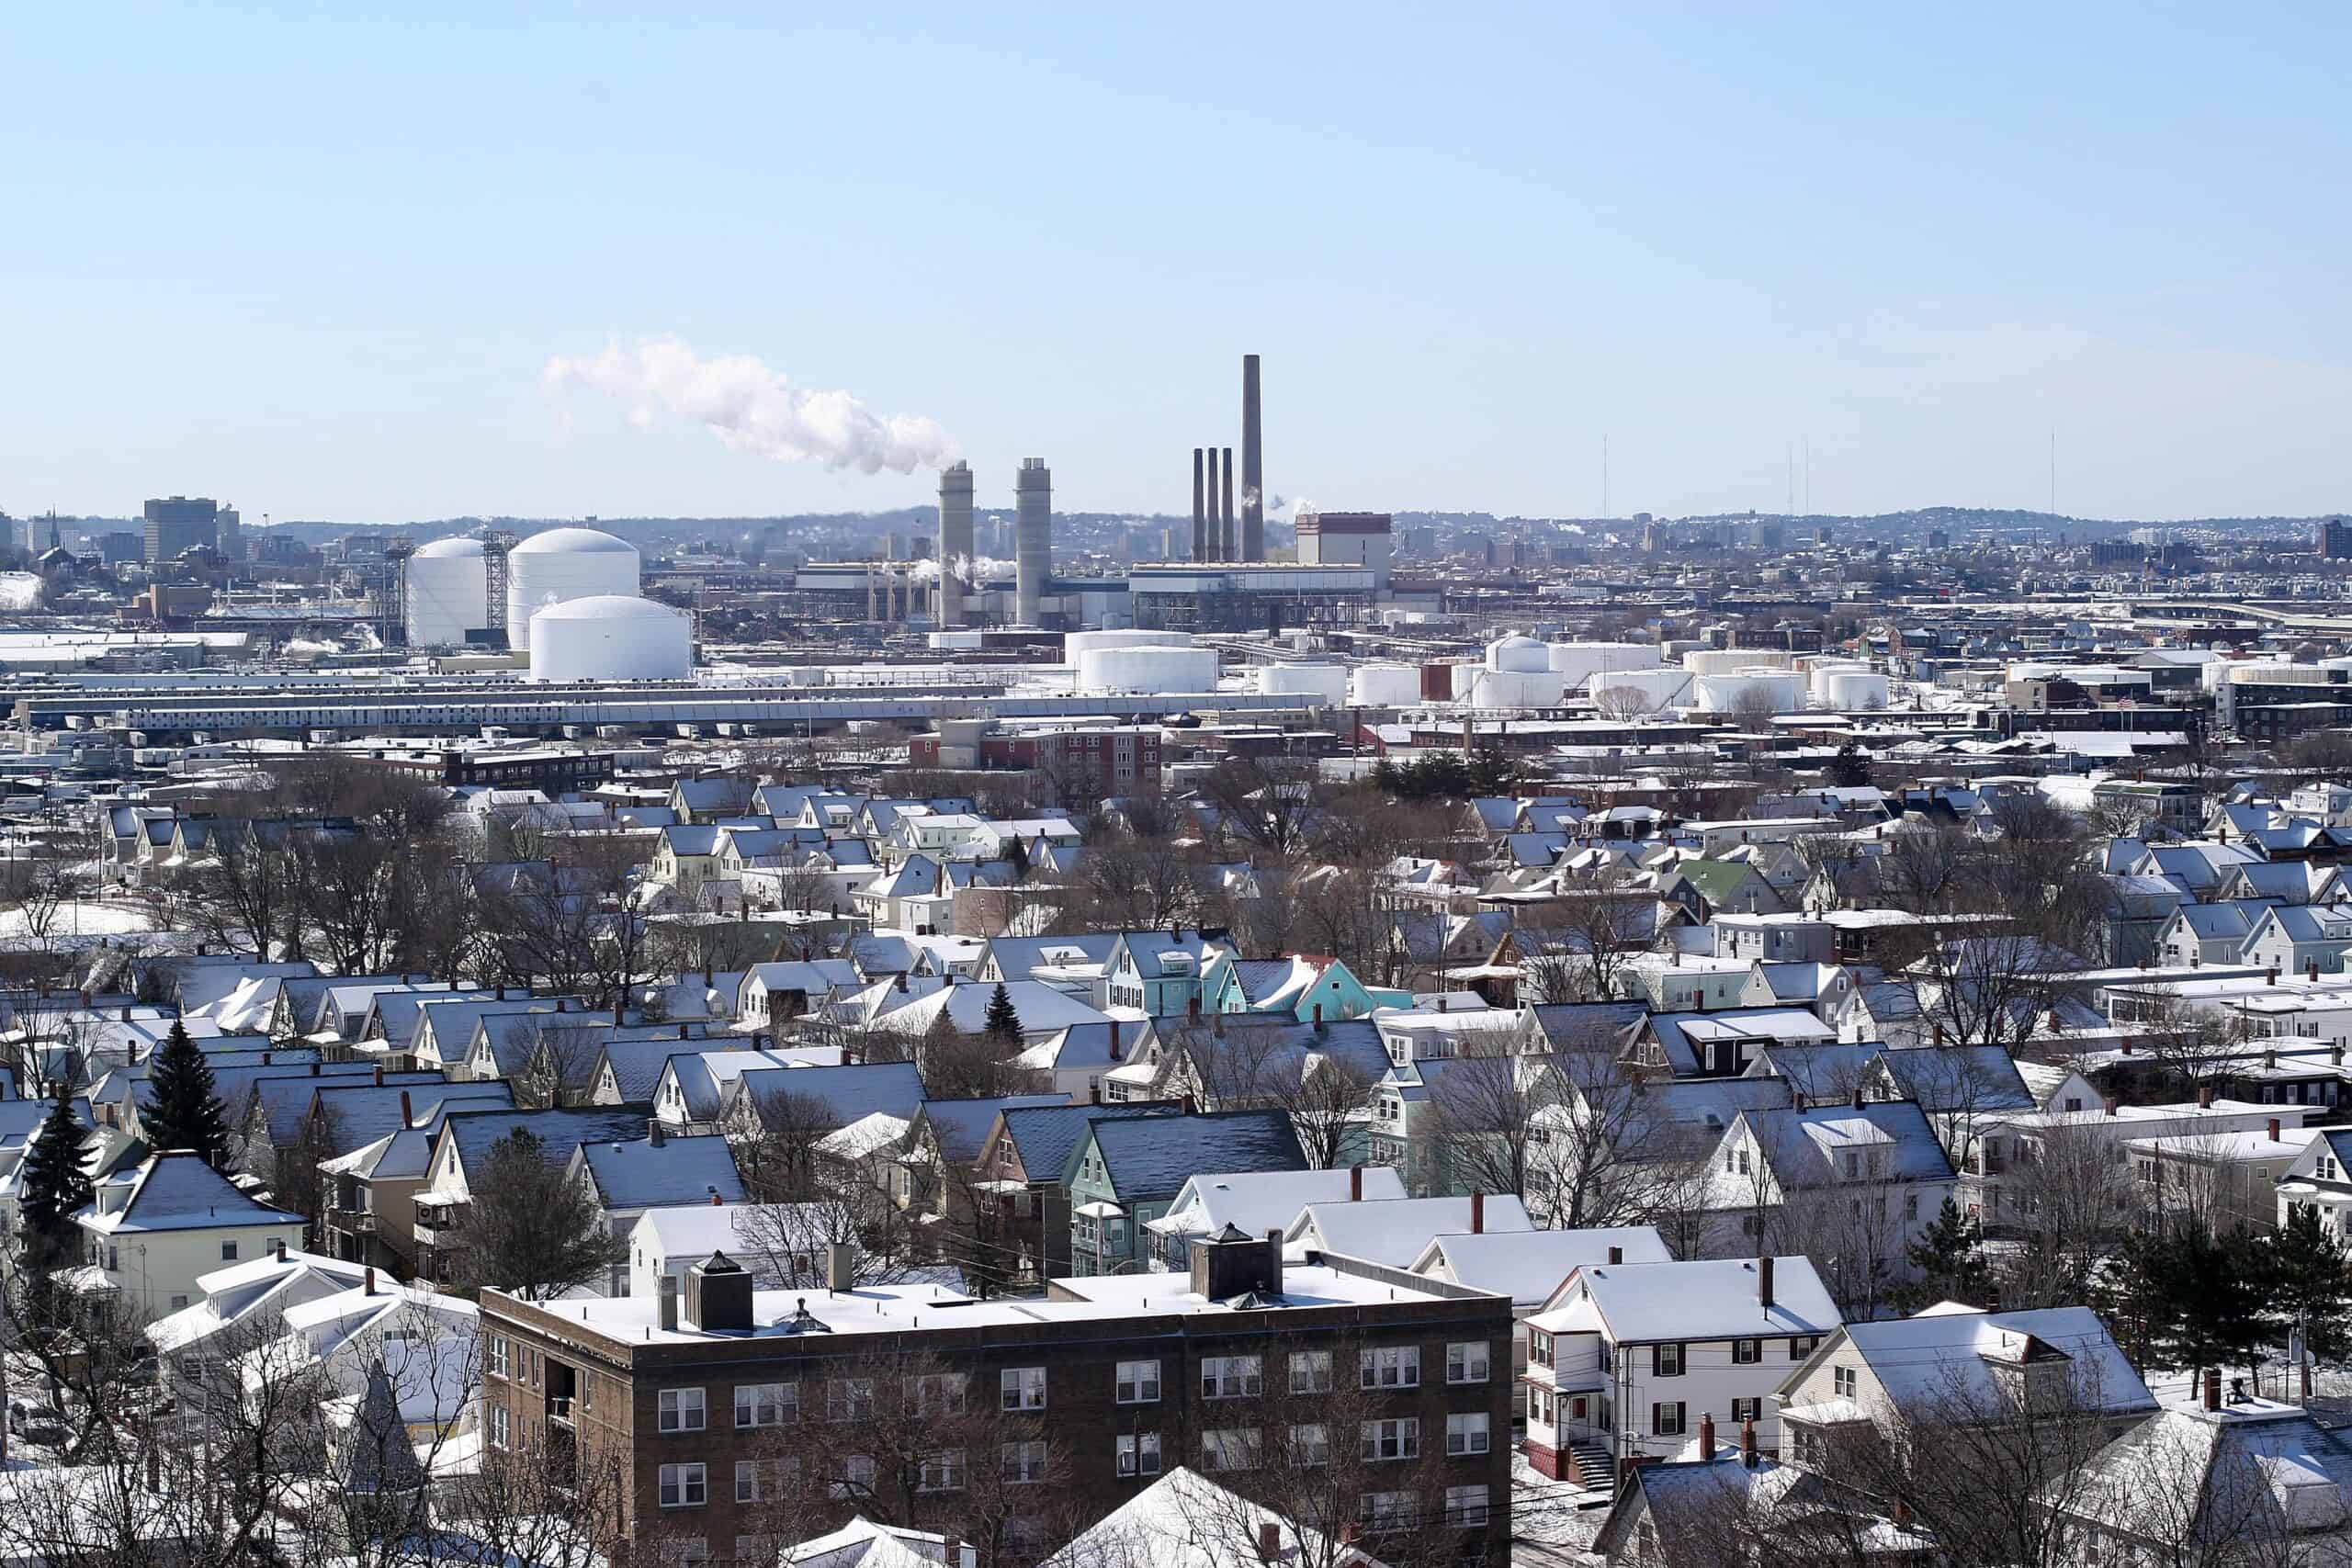
2. Chelsea

- Poverty rate: 21.4%
- Median household income: $71,051
- 5-yr. avg. unemployment rate: 8.9%
- Adults with a bachelor’s degree or higher: 21.6%
- Population: 39,890
1. Holyoke
- Poverty rate: 26.0%
- Median household income: $49,007
- 5-yr. avg. unemployment rate: 6.8%
- Adults with a bachelor’s degree or higher: 22.2%
- Population: 38,210
| Rank | Place | Poverty rate (%) | Median household income ($) | Unemployment rate (%) | Adults with a bachelor’s degree or higher (%) | Total population |
|---|---|---|---|---|---|---|
| 1 | Holyoke, Massachusetts | 26.0 | 49,007 | 6.8 | 22.2 | 38,210 |
| 2 | Chelsea, Massachusetts | 21.4 | 71,051 | 8.9 | 21.6 | 39,890 |
| 3 | Webster, Massachusetts | 18.0 | 59,375 | 9.7 | 19.5 | 12,264 |
| 4 | Southbridge Town, Massachusetts | 17.9 | 55,182 | 9.1 | 17.0 | 17,669 |
| 5 | Adams, Massachusetts | 16.6 | 49,077 | 6.2 | 25.6 | 5,722 |
| 6 | Greenfield, Massachusetts | 15.5 | 53,149 | 5.4 | 37.0 | 17,674 |
| 7 | Ware, Massachusetts | 15.4 | 44,107 | 12.3 | 18.8 | 6,253 |
| 8 | North Adams, Massachusetts | 15.1 | 49,525 | 5.0 | 26.3 | 12,937 |
| 9 | Raynham Center, Massachusetts | 14.9 | 98,984 | 7.4 | 32.6 | 5,074 |
| 10 | Gardner, Massachusetts | 14.8 | 56,974 | 6.4 | 19.4 | 21,090 |
| 11 | Middleborough Center, Massachusetts | 14.7 | 79,811 | 3.7 | 29.0 | 7,807 |
| 12 | Everett, Massachusetts | 14.4 | 77,796 | 6.5 | 23.6 | 48,685 |
| 13 | Fitchburg, Massachusetts | 13.9 | 65,963 | 7.6 | 23.7 | 41,621 |
| 14 | Pittsfield, Massachusetts | 13.8 | 66,859 | 7.1 | 34.2 | 43,730 |
| 15 | Salem, Massachusetts | 13.7 | 79,196 | 5.0 | 48.2 | 44,541 |
| 16 | Athol, Massachusetts | 13.3 | 62,962 | 8.1 | 21.0 | 9,148 |
| 17 | Northampton, Massachusetts | 11.3 | 80,981 | 5.6 | 62.9 | 28,245 |
| 18 | Gloucester, Massachusetts | 10.8 | 84,465 | 5.8 | 39.6 | 29,830 |
| 19 | West Springfield Town, Massachusetts | 10.5 | 67,297 | 5.8 | 36.5 | 28,755 |
| 20 | Beverly, Massachusetts | 10.5 | 99,525 | 3.3 | 52.4 | 42,414 |
| 21 | Milford, Massachusetts | 10.1 | 89,608 | 5.9 | 32.1 | 27,569 |
Sponsored: Want to Retire Early? Start Here
Want retirement to come a few years earlier than you’d planned? Orare you ready to retire now, but want an extra set of eyes on your finances?
Now you can speak with up to 3 financial experts in your area for FREE. By simply clicking here you can begin to match with financial professionals who can help you build your plan to retire early. And the best part? The first conversation with them is free.
Click here to match with up to 3 financial pros who would be excited to help you make financial decisions.
The post Towns in Massachusetts With the Worst Poverty appeared first on 24/7 Wall St..