Traditionally, the American middle class has enough disposable income that they can afford some luxuries like dining out, going on vacation, and having enough left over for savings and retirement. However, across the country, with the changing income spectrum needed to meet the middle-class benchmark, some middle-class families may no longer be able to afford extra luxuries.
Using area data from the U.S. Census Bureau’s 2022 American Community Survey, 24/7 Wall St. identified the city with the poorest middle class in each state.
Let’s take a closer look.
Why We’re Writing About Middle-Class Incomes

The middle class has long been considered a version of the American dream. With inflation rising, but wages staying the same, middle-class households find themselves less financially secure than even their parent’s generations. Looking at how middle-class incomes differ across the country helps you understand the trends in your state.
Here is the city with the poorest middle class in every state:
Alabama: Anniston-Oxford

Anniston-Oxford (one of the 12 metro areas in Alabama) has an average household income range among the middle 20% of earners of $40,807 to $64,348 with an average of $51,947. This is lower than the state as a whole at $46,221 to $75,810 with an average of $60,096. The median income among all households in the city is $52,819 (Alabama: $59,674) and 21.1% of adults hold a bachelor’s degree or higher (Alabama: 28.8%).
Alaska: Fairbanks

Fairbanks (one of the two metro areas in Alaska) has an average household income range among the middle 20% of earners of $67,387 to $101,414 with an average of $83,132. This is lower than the state as a whole at $70,740 to $106,786 with an average of $88,121. The median income among all households in the city is $83,519 (Alaska: $88,121) and 26.5% of adults hold a bachelor’s degree or higher (Alaska: 30.6%).
Arizona: Yuma

Yuma (one of the seven metro areas in Arizona) has an average household income range among the middle 20% of earners of $43,894 to $66,198 with an average of $54,680. This is lower than the state as a whole at $59,413 – $92,087 with an average of $74,923. The median income among all households in the city is $53,994 (Arizona: $74,568) and 16.6% of adults hold a bachelor’s degree or higher (Arizona: 33.0%).
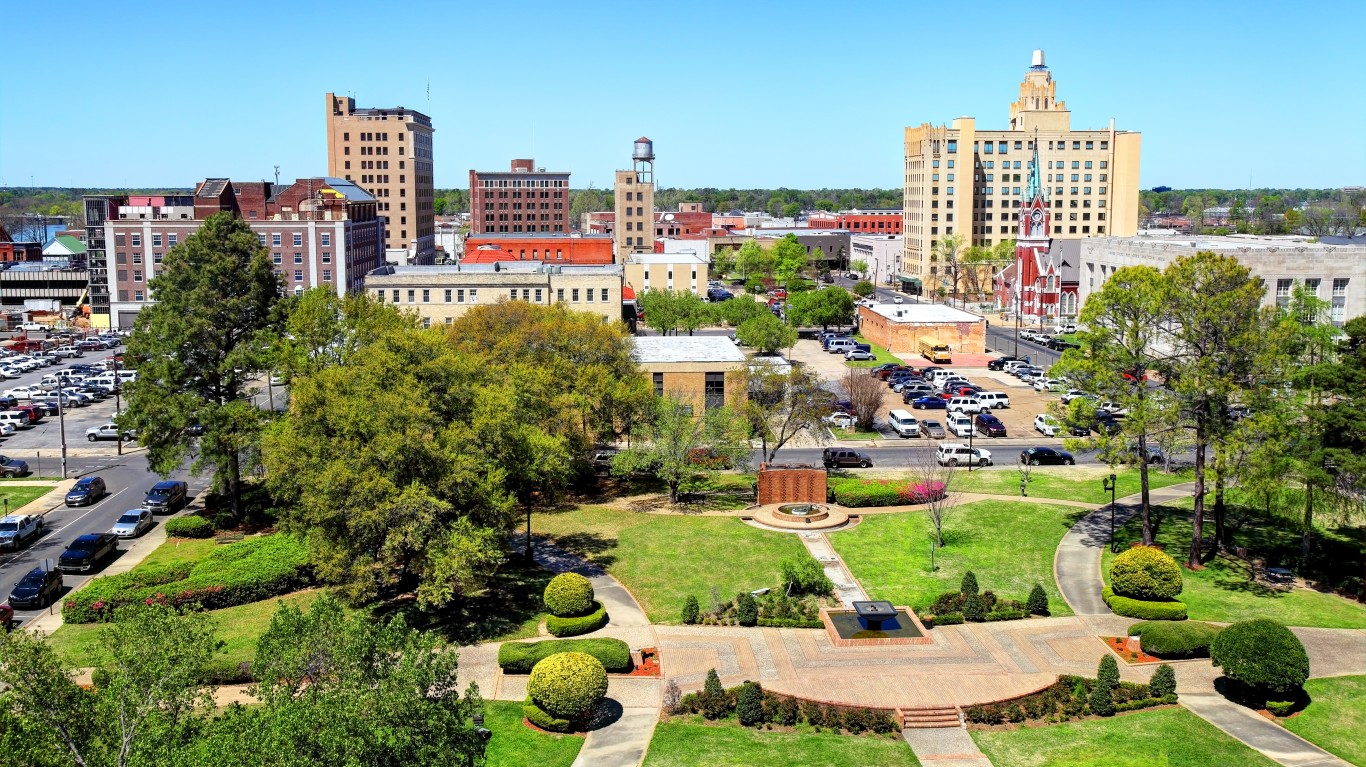
Arkansas: Pine Bluff

Pine Bluff (one of the six metro areas in Arkansas) has an average household income range among the middle 20% of earners of $34,082 – $57,693 with an average of $44,319. This is lower than the state as a whole at $43,623 – $69,297 with an average of $55,886. The median income among all households in the city is $44,263 (Arkansas: $55,432) and 19.1% of adults hold a bachelor’s degree or higher (Arkansas: 25.4%).
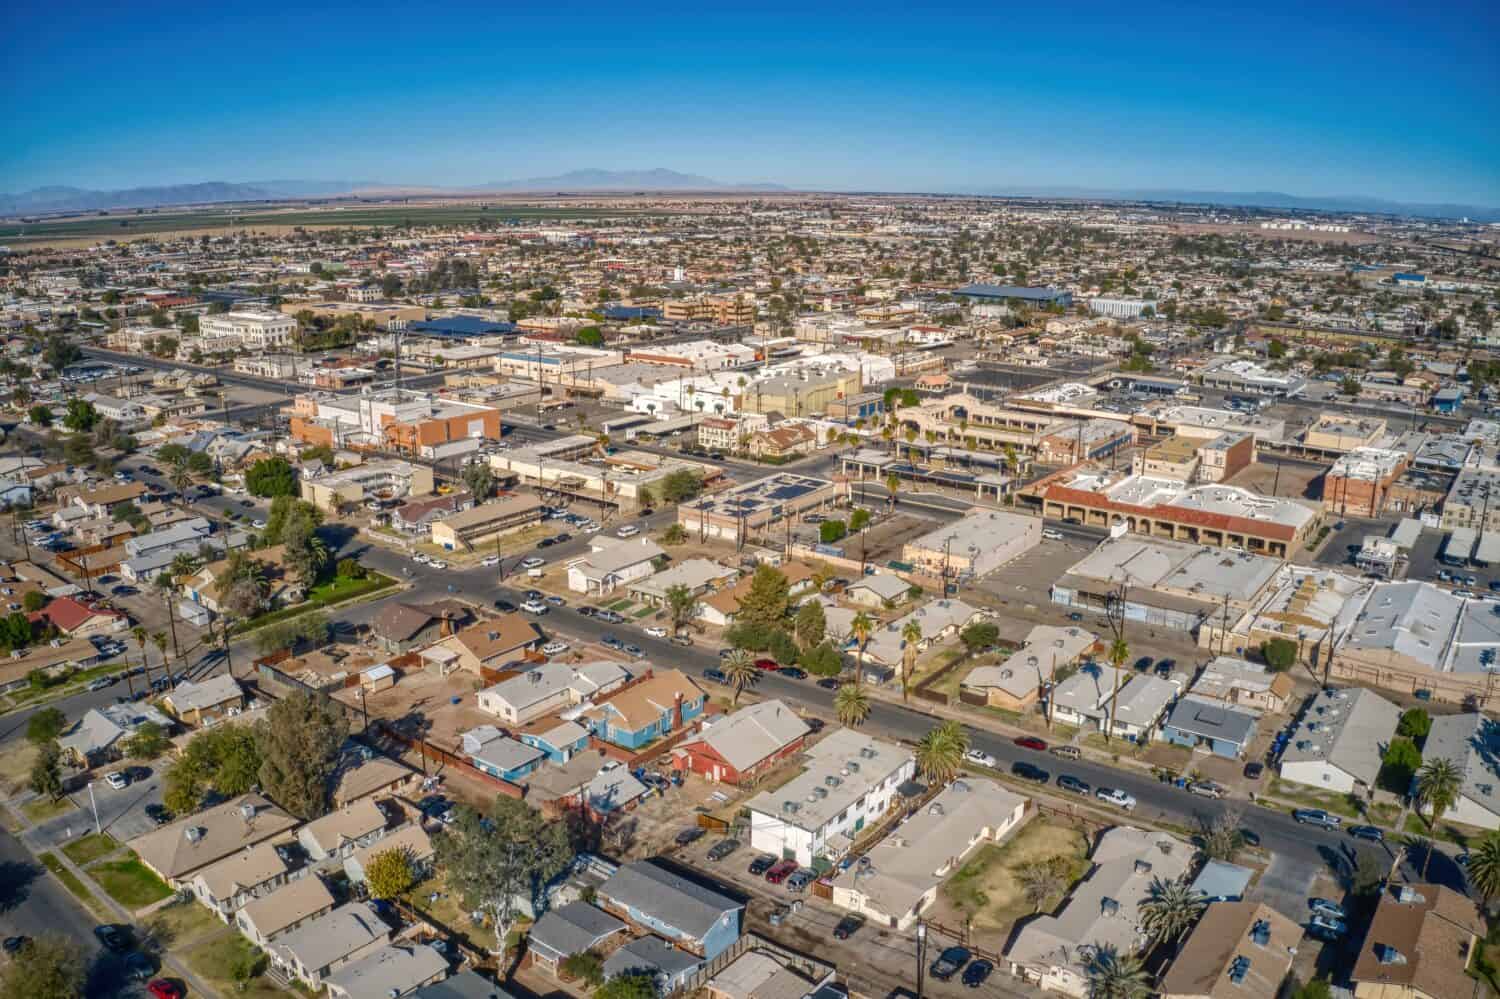
California: El Centro
Colorado: Pueblo

Pueblo (one of the seven metro areas in Colorado) has an average household income range among the middle 20% of earners of $47,506 – $72,682 with an average of $59,288. This is lower than the state as a whole at $71,401 – $108,616 with an average of $89,472. The median income among all households in the city is $58,723 (Colorado: $89,302) and 23.8% of adults hold a bachelor’s degree or higher (Colorado: 45.9%).
Connecticut: New Haven-Milford

New Haven-Milford (one of the four metro areas in Connecticut) has an average household income range among the middle 20% of earners of $62,877 – $102,968 with an average of $82,146. This is lower than the state as a whole at $69,974 – $110,671 with an average of $89,379. The median income among all households in the city is $81,998 (Connecticut: $88,429) and 36.8% of adults hold a bachelor’s degree or higher (Connecticut: 41.9%).
Delaware: Dover

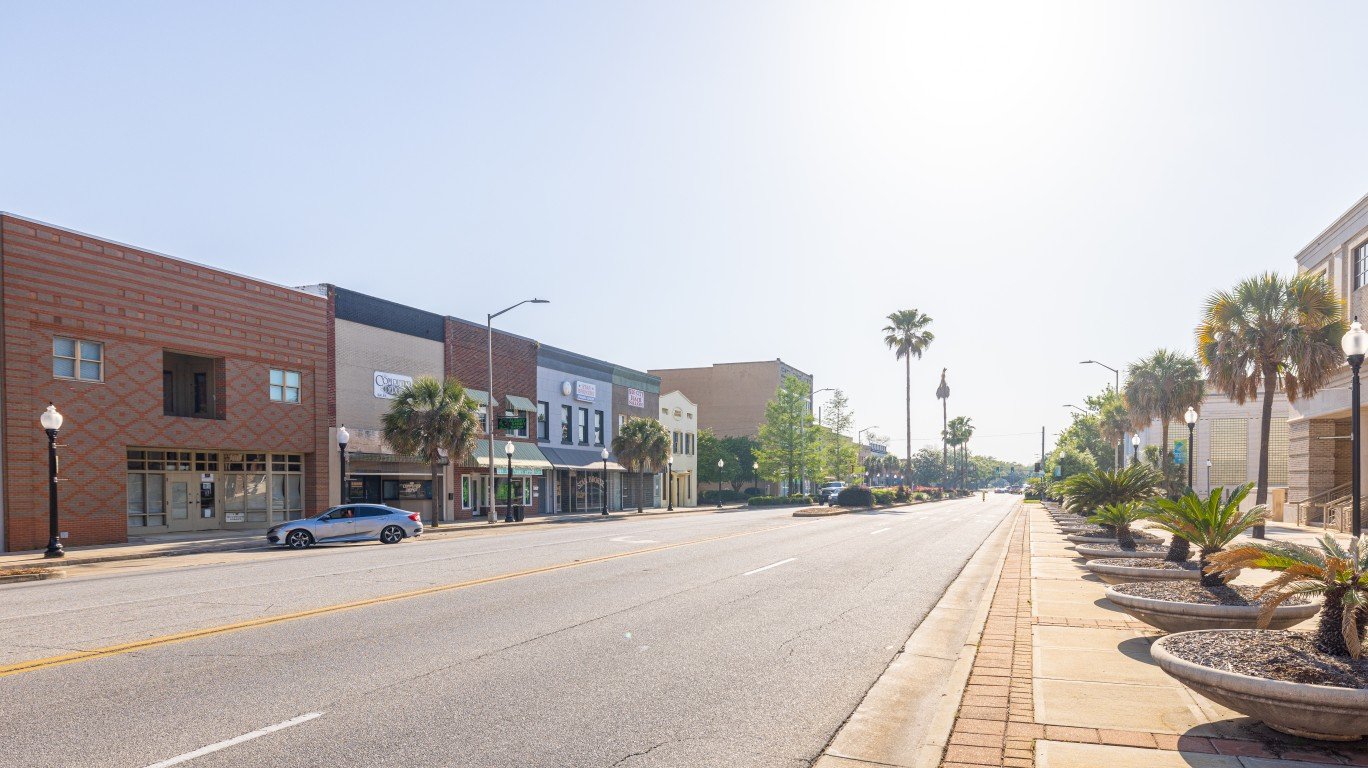
Florida: Homosassa Springs

Homosassa Springs (one of 22 metro areas in Florida) has an average household income range among the middle 20% of earners of $40,920 – $62,305 with an average of $51,453. This is lower than the state as a whole at $54,733 – $86,103 with an average of $69,655. The median income among all households in the city is $51,532 (Florida: $69,303) and 19.4% of adults hold a bachelor’s degree or higher (Florida: 34.3%).
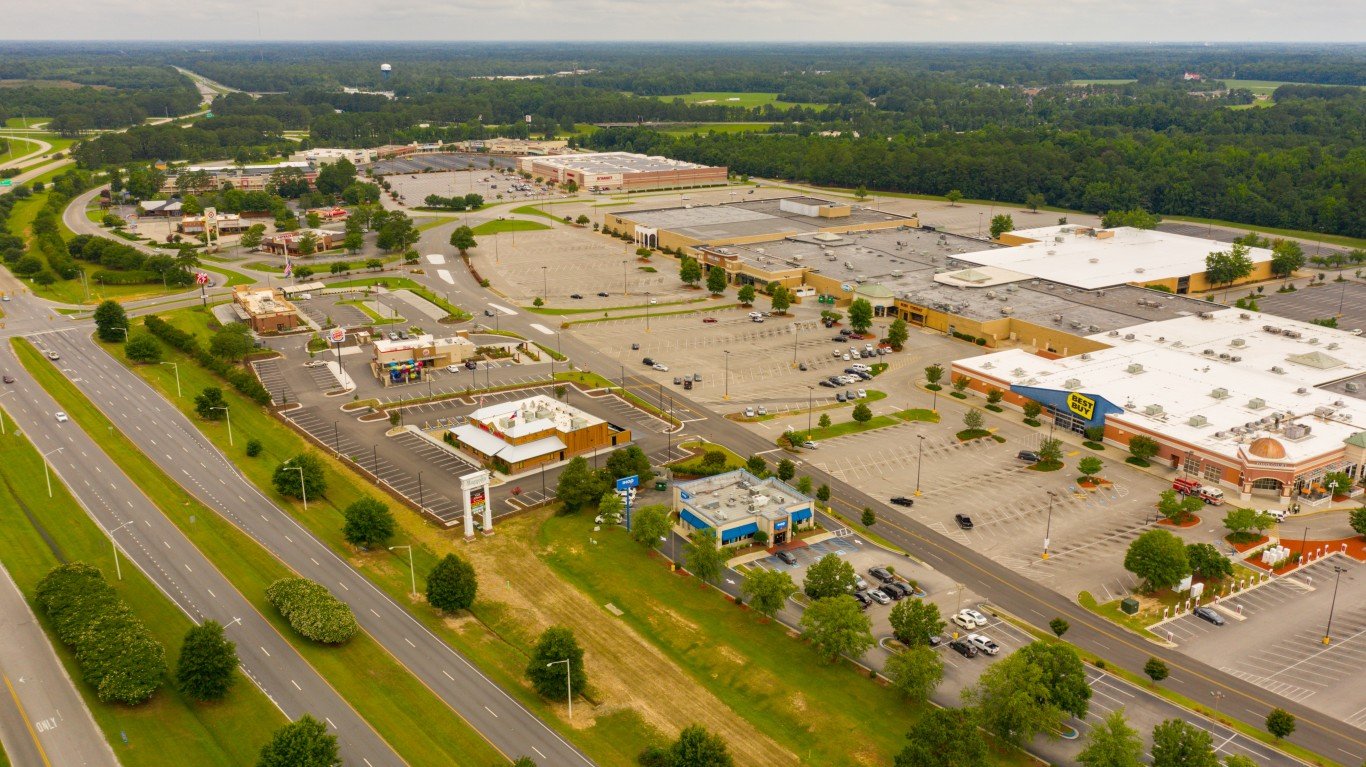
Georgia: Albany
Albany (one of 14 metro areas in Georgia) has an average household income range among the middle 20% of earners of $37,119 – $62,632 with an average of $49,188. This is lower than the state as a whole at $57,501 – $90,252 with an average of $73,022. The median income among all households in the city is $48,376 (Georgia: $72,837) and 22.0% of adults hold a bachelor’s degree or higher (Georgia: 34.7%).
Hawaii: Kahului-Wailuku-Lahaina

Kahului-Wailuku-Lahaina (one of two metro areas in Hawaii) has an average household income range among the middle 20% of earners of $78,443 – $114,903 with an average of $96,161. The state as a whole has a range of $72,639 – $112,336 with an average of $92,546. The median income among all households in the city is $94,760 (Hawaii: $92,458) and 29.0% of adults hold a bachelor’s degree or higher (Hawaii: 35.4%).
Idaho: Pocatello

Pocatello (one of six metro areas in Idaho) has an average household income range among the middle 20% of earners of $47,845 – $76,305 with an average of $62,525. This is lower than the state as a whole at $57,929 – $87,185 with an average of $72,449. The median income among all households in the city is $61,566 (Idaho: $72,785) and 29.0% of adults hold a bachelor’s degree or higher (Idaho: 32.3%).
Illinois: Danville

Danville (one of 10 metro areas in Illinois) has an average household income range among the middle 20% of earners of $42,854 – $64,800 with an average of $51,935. This is lower than the state as a whole at $60,436 – $95,801 with an average of $77,144. The median income among all households in the city is $51,515 (Illinois: $76,708) and 15.5% of adults hold a bachelor’s degree or higher (Illinois: 37.7%).
Indiana: Muncie
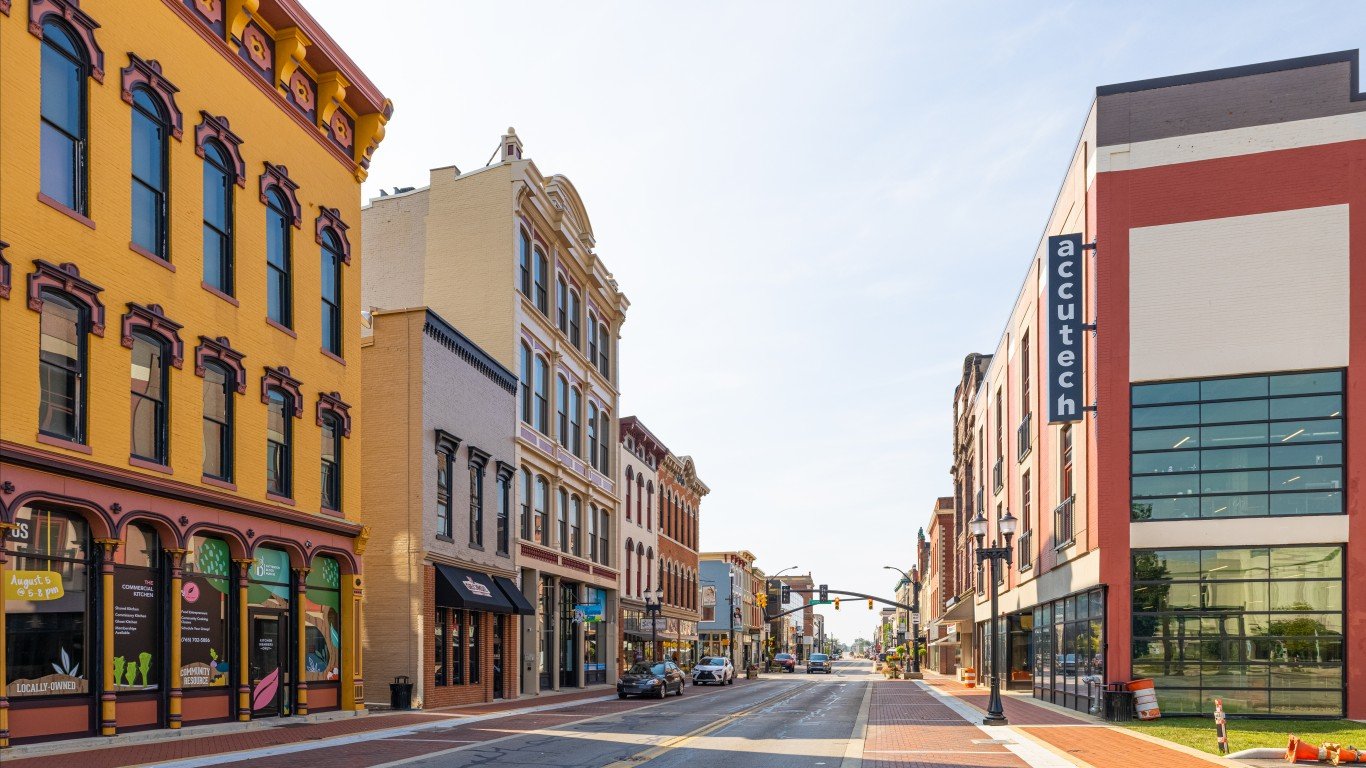
Muncie (one of 12 metro areas in Indiana) has an average household income range among the middle 20% of earners of $42,081 – $68,218 with an average of $54,578. This is lower than the state as a whole at $52,940 – $82,716 with an average of $67,195. The median income among all households in the city is $54,087 (Indiana: $66,785) and 26.7% of adults hold a bachelor’s degree or higher (Indiana: 29.6%).
Iowa: Waterloo-Cedar Falls

Kansas: Manhattan
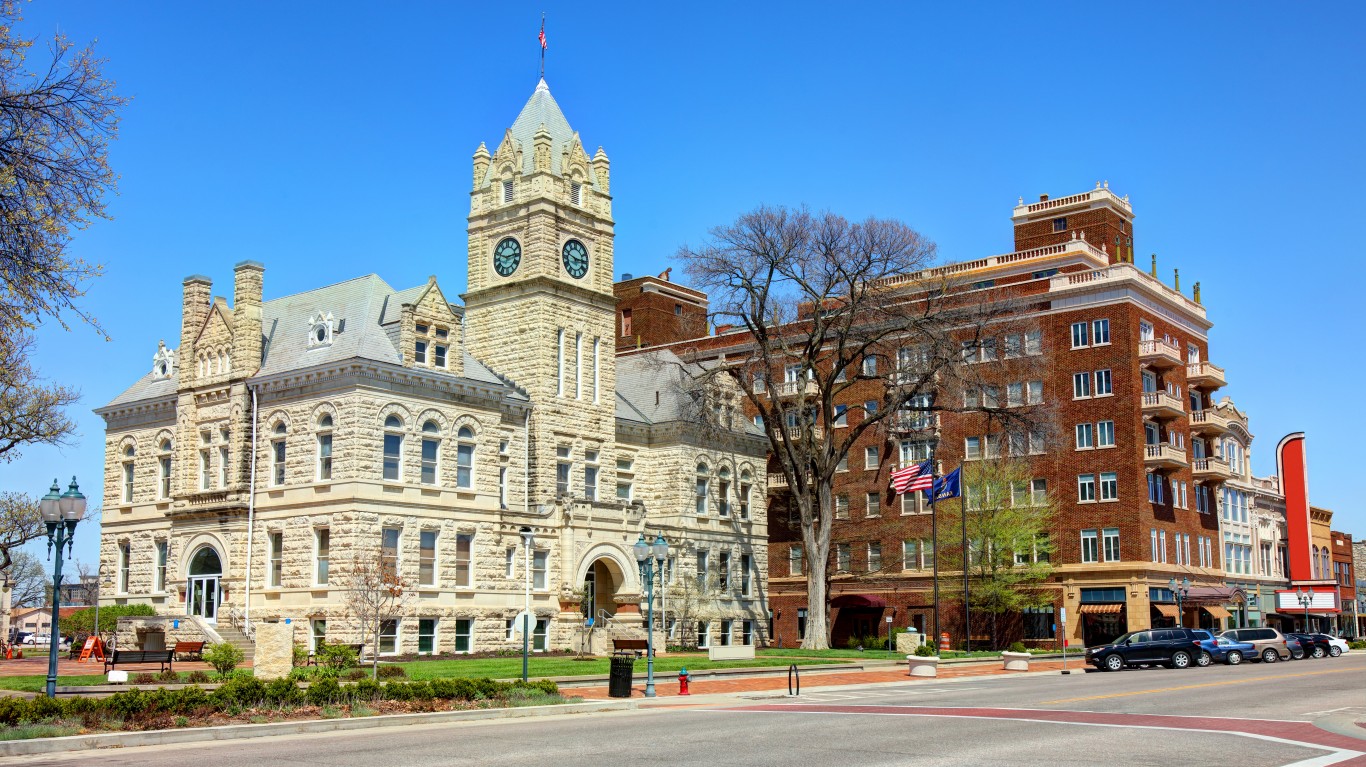
Manhattan (one of four metro areas in Kansas) has an average household income range among the middle 20% of earners of $49,024 – $72,604 with an average of $59,963. This is lower than the state as a whole at $54,481 – $85,353 with an average of $69,149. The median income among all households in the city is $58,723 (Kansas: $68,925) and 38.3% of adults hold a bachelor’s degree or higher (Kansas: 35.6%).
Kentucky: Bowling Green
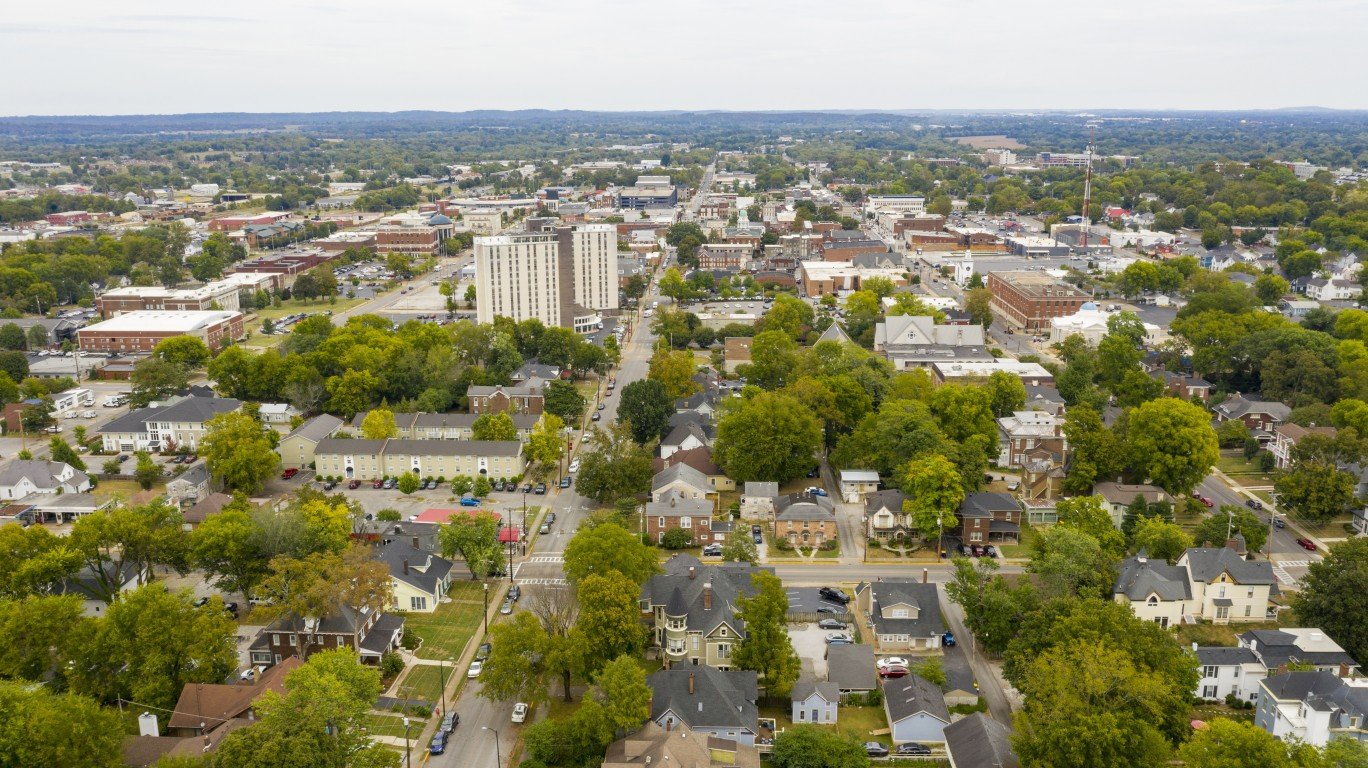
Bowling Green (one of five metro areas in Kentucky) has an average household income range among the middle 20% of earners of $46,819 – $72,973 with an average of $59,554. This is lower than the state as a whole at $46,152 – $74,488 with an average of $59,612. The median income among all households in the city is $59,629 (Kentucky: $59,341) and 27.5% of adults hold a bachelor’s degree or higher (Kentucky: 27.9%).
Louisiana: Monroe
Monroe (one of nine metro areas in Louisiana) has an average household income range among the middle 20% of earners of $33,341 – $59,692 with an average of $44,531. This is lower than the state as a whole at $42,829 – $71,364 with an average of $56,007. The median income among all households in the city is $44,507 (Louisiana: $55,416) and 25.3% of adults hold a bachelor’s degree or higher (Louisiana: 27.1%).
Maine: Bangor

Bangor (one of three metro areas in Maine) has an average household income range among the middle 20% of earners of $47,314 – $76,833 with an average of $61,163. This is lower than the state as a whole at $55,291 – $86,020 with an average of $69,962. The median income among all households in the city is $61,134 (Maine: $69,543) and 27.5% of adults hold a bachelor’s degree or higher (Maine: 36.1%).
Maryland: Cumberland

Cumberland (one of five metro areas in Maryland) has an average household income range among the middle 20% of earners of $37,630 – $67,152 with an average of $54,045. This is lower than the state as a whole at $75,460 – $117,911 with an average of $95,560. The median income among all households in the city is $54,618 (Maryland: $94,991) and 24.7% of adults hold a bachelor’s degree or higher (Maryland: 43.8%).
Massachusetts: Springfield

Springfield (one of five metro areas in Massachusetts) has an average household income range among the middle 20% of earners of $51,910 – $85,350 with an average of $68,621. This is lower than the state as a whole at $72,967 – $119,408 with an average of $94,908. The median income among all households in the city is $68,400 (Massachusetts: $94,488) and 36.1% of adults hold a bachelor’s degree or higher (Massachusetts: 46.6%).
Michigan: Saginaw
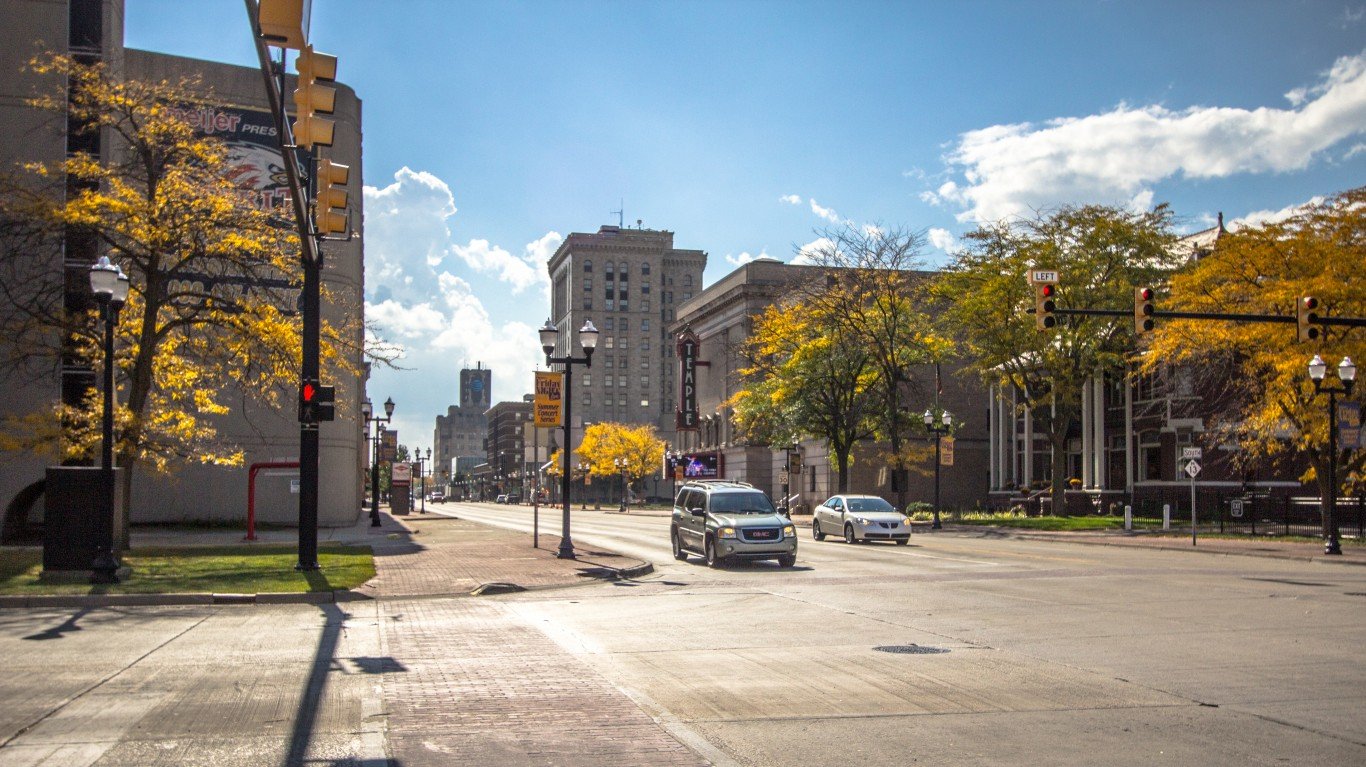
Saginaw (one of 14 metro areas in Michigan) has an average household income range among the middle 20% of earners of $44,401 – $67,738 with an average of $54,676. This is lower than the state as a whole at $53,112 – $83,938 with an average of $67,641. The median income among all households in the city is $53,646 (Michigan: $66,986) and 24.6% of adults hold a bachelor’s degree or higher (Michigan: 32.1%).
Minnesota: Duluth

Duluth (one of five metro areas in Minnesota) has an average household income range among the middle 20% of earners of $51,686 – $82,574 with an average of $66,194. This is lower than the state as a whole at $65,973 – $101,320 with an average of $82,872. The median income among all households in the city is $65,963 (Minnesota: $82,338) and 30.0% of adults hold a bachelor’s degree or higher (Minnesota: 39.1%).
Mississippi: Hattiesburg

Hattiesburg (one of three metro areas in Mississippi) has an average household income range among the middle 20% of earners of $42,807 – $65,423 with an average of $54,503. The state as a whole has a range of $40,913 – $65,726 with an average of $52,845. The median income among all households in the city is $54,560 (Mississippi: $52,719) and 29.3% of adults hold a bachelor’s degree or higher (Mississippi: 24.8%).
Missouri: Joplin
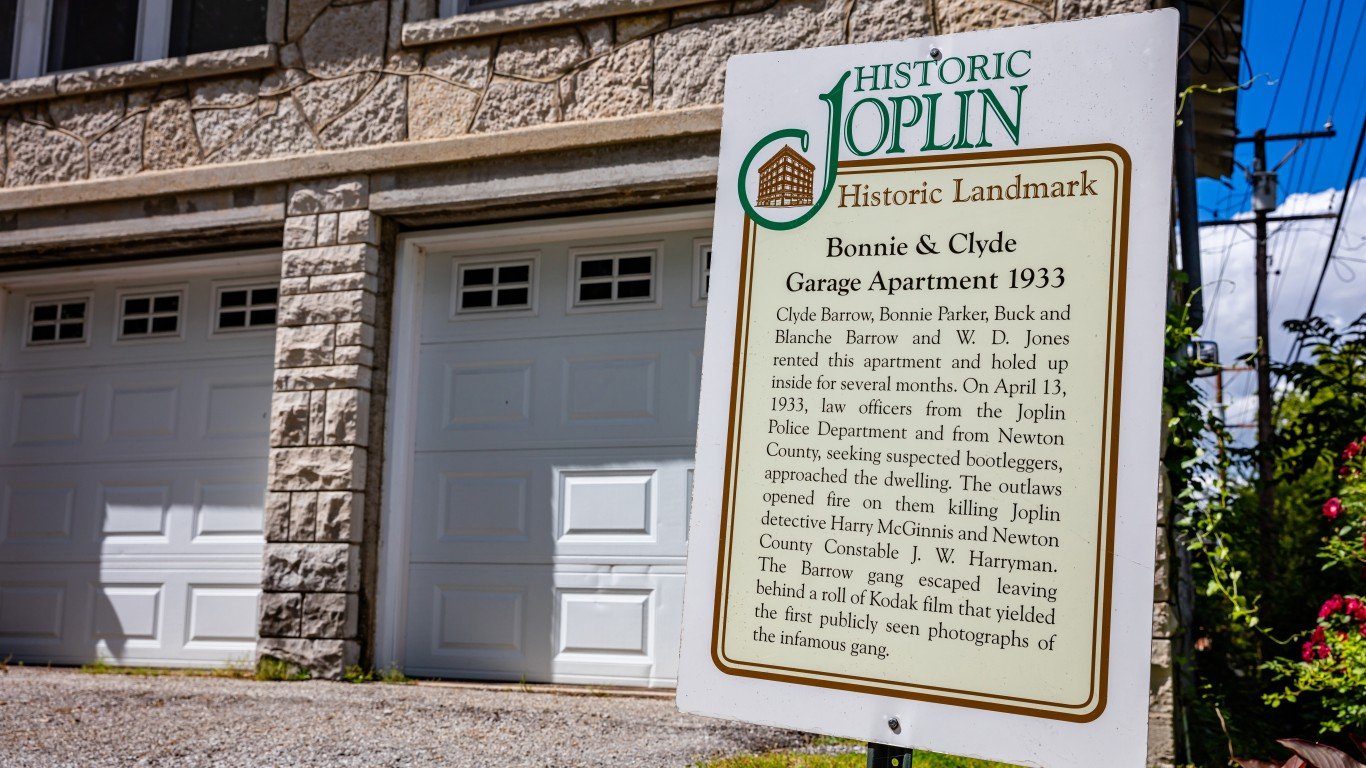
Joplin (one of eight metro areas in Missouri) has an average household income range among the middle 20% of earners of $43,656 – $68,251 with an average of $55,085. This is lower than the state as a whole at $51,607 – $80,613 with an average of $65,334. The median income among all households in the city is $54,041 (Missouri: $64,811) and 24,8% of adults hold a bachelor’s degree or higher (Missouri: 32.2%).
Montana: Great Falls

Great Falls (one of three metro areas in Montana) has an average household income range among the middle 20% of earners of $49,264 – $73,325 with an average of $60,145. This is lower than the state as a whole at $54,044 – $82,048 with an average of $67,919. The median income among all households in the city is $58,698 (Montana: $67,631) and 28.0% of adults hold a bachelor’s degree or higher (Montana: 34.6%).
Nebraska: Grand Island
Grand Island (one of three metro areas in Nebraska) has an average household income range among the middle 20% of earners of $51,539 – $84,651 with an average of $67,939. This is lower than the state as a whole at $55,405 – $87,098 with an average of $70,317. The median income among all households in the city is $67,646 (Nebraska: $69,597) and 23.3% of adults hold a bachelor’s degree or higher (Nebraska: 34.7%).
Nevada: Carson City

Carson City (one of three metro areas in Nevada) has an average household income range among the middle 20% of earners of $51,323 – $72,917 with an average of $60,850. This is lower than the state as a whole at $57,914 – $88,971 with an average of $72,629. The median income among all households in the city is $59,042 (Nevada: $72,333) and 24.0% of adults hold a bachelor’s degree or higher (Nevada: 27.0%).
New Hampshire: Manchester-Nashua

Manchester-Nashua (the only metro area in New Hampshire) has an average household income range among the middle 20% of earners of $77,249 – $120,114 with an average of $97,016. This is compared to the state as a whole at $72,050 – $110,461 with an average of $90,431. The median income among all households in the city is $96,921 (New Hampshire: $89,992) and 40.7% of adults hold a bachelor’s degree or higher (New Hampshire: 41.3%).
New Jersey: Vineland-Bridgeton

Vineland-Bridgeton (one of four metro areas in New Jersey) has an average household income range among the middle 20% of earners of $50,343 – $73,594 with an average of $60,922. This is lower than the state as a whole at $75,301 – $120,887 with an average of $96,732. The median income among all households in the city is $60,755 (New Jersey: $96,346) and 19.0% of adults hold a bachelor’s degree or higher (New Jersey: 43.5%).
New Mexico: Farmington

Farmington (one of four metro areas in New Mexico) has an average household income range among the middle 20% of earners of $38,716 – $65,752 with an average of $50,467. This is lower than the state as a whole at $46,035 – $76,206 with an average of $60,150. The median income among all households in the city is $50,264 (New Mexico: $59,726) and 18.1% of adults hold a bachelor’s degree or higher (New Mexico: 30.5%).
New York: Elmira

Elmira (one of 13 metro areas in New York) has an average household income range among the middle 20% of earners of $45,933 – $67,223 with an average of $56,203. This is lower than the state as a whole at $61,198 – $101,521 with an average of $80,086. The median income among all households in the city is $55,845 (New York: $79,557) and 27.0% of adults hold a bachelor’s degree or higher (New York: 40.0%).
North Carolina: Rocky Mount

Rocky Mount (one of 15 metro areas in North Carolina) has an average household income range among the middle 20% of earners of $42,564 – $64,311 with an average of $53,578. This is lower than the state as a whole at $53,314 – $83,902 with an average of $67,852. The median income among all households in the city is $53,896 (North Carolina: $67,481) and 21.0% of adults hold a bachelor’s degree or higher (North Carolina: 35.9%).
North Dakota: Grand Forks

Grand Forks (one of three metro areas in North Dakota) has an average household income range among the middle 20% of earners of $51,523 – $82,042 with an average of $65,347. This is lower than the state as a whole at $57,556 – $88,516 with an average of $72,530. The median income among all households in the city is $65,413 (North Dakota: $71,970) and 35.1% of adults hold a bachelor’s degree or higher (North Dakota: 31.8%).
Ohio: Mansfield
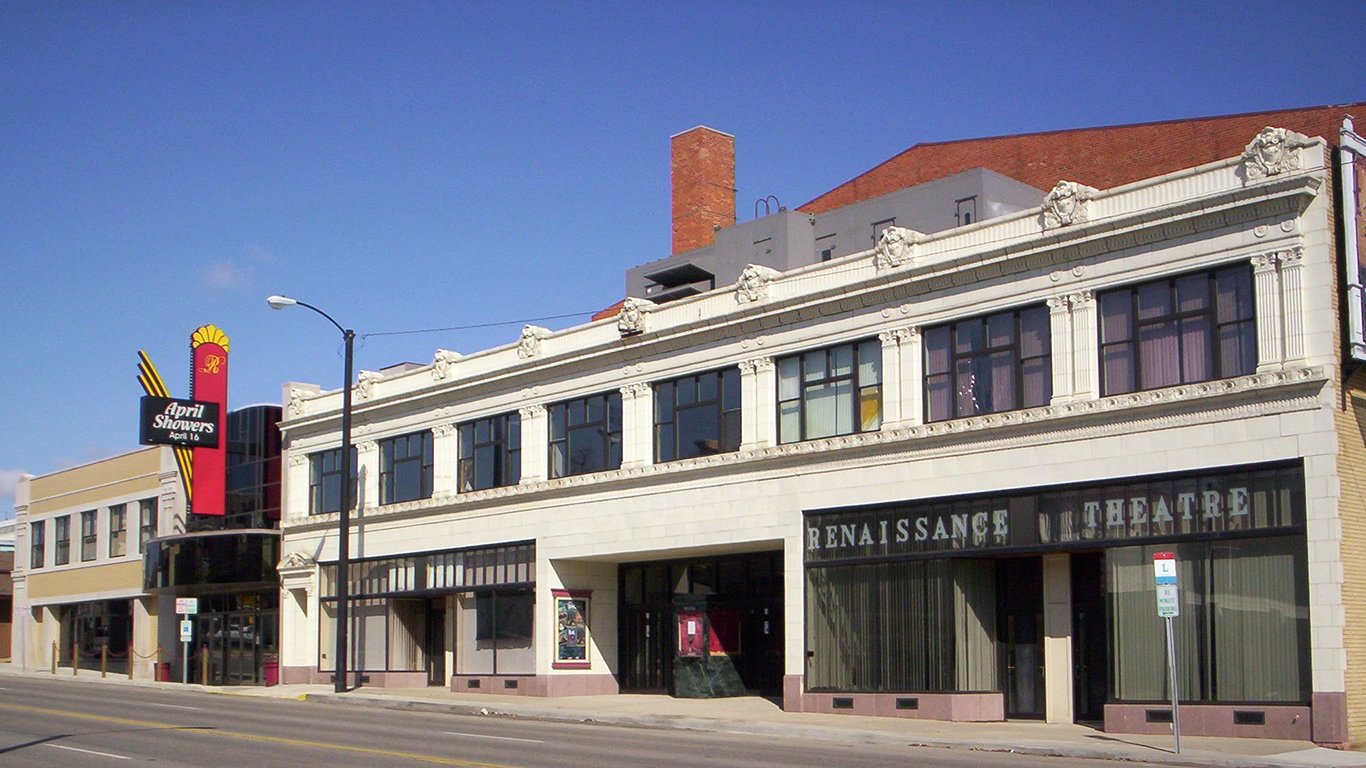
Mansfield (one of 11 metro areas in Ohio) has an average household income range among the middle 20% of earners of $42,387 – $64,262 with an average of $52,830. This is lower than the state as a whole at $52,303 – $82,246 with an average of $66,381. The median income among all households in the city is $53,047 (Ohio: $65,720) and 17.9% of adults hold a bachelor’s degree or higher (Ohio: 32.0%).
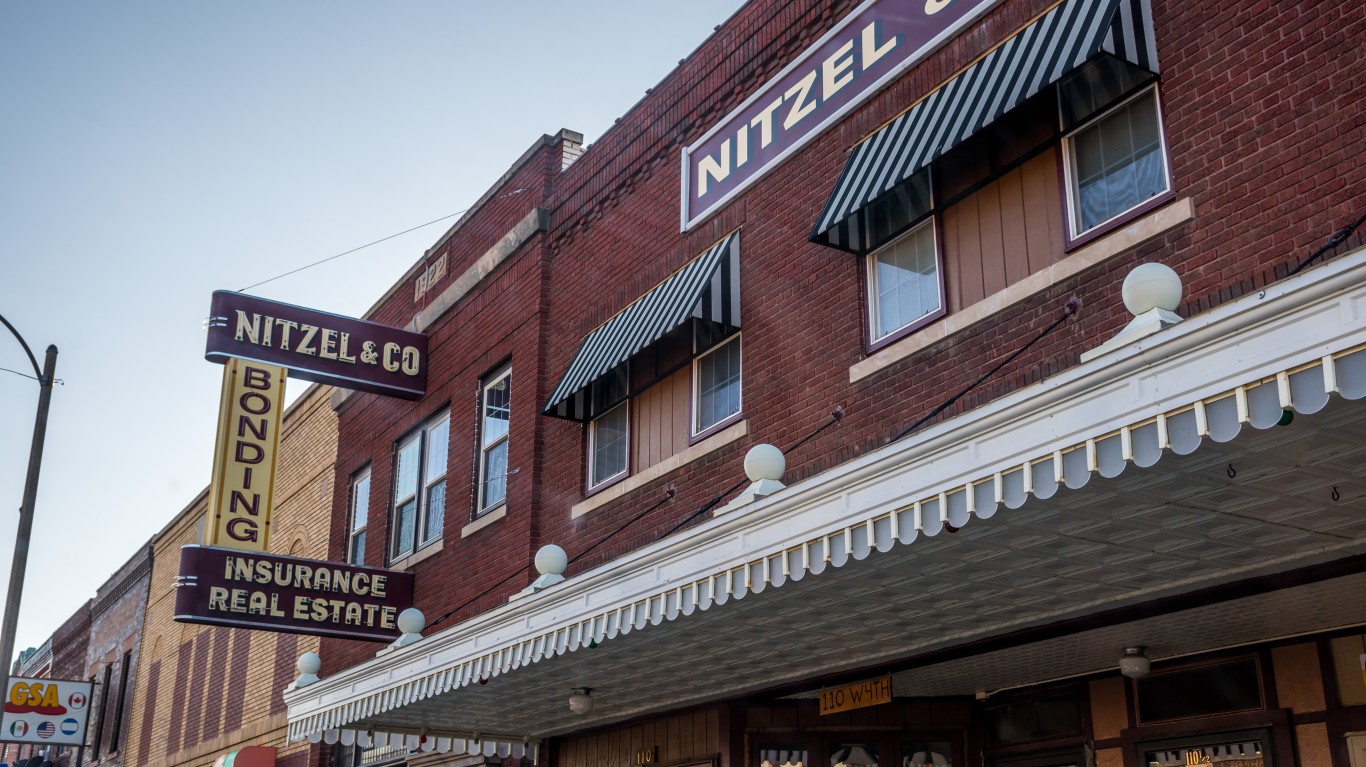
Oklahoma: Enid
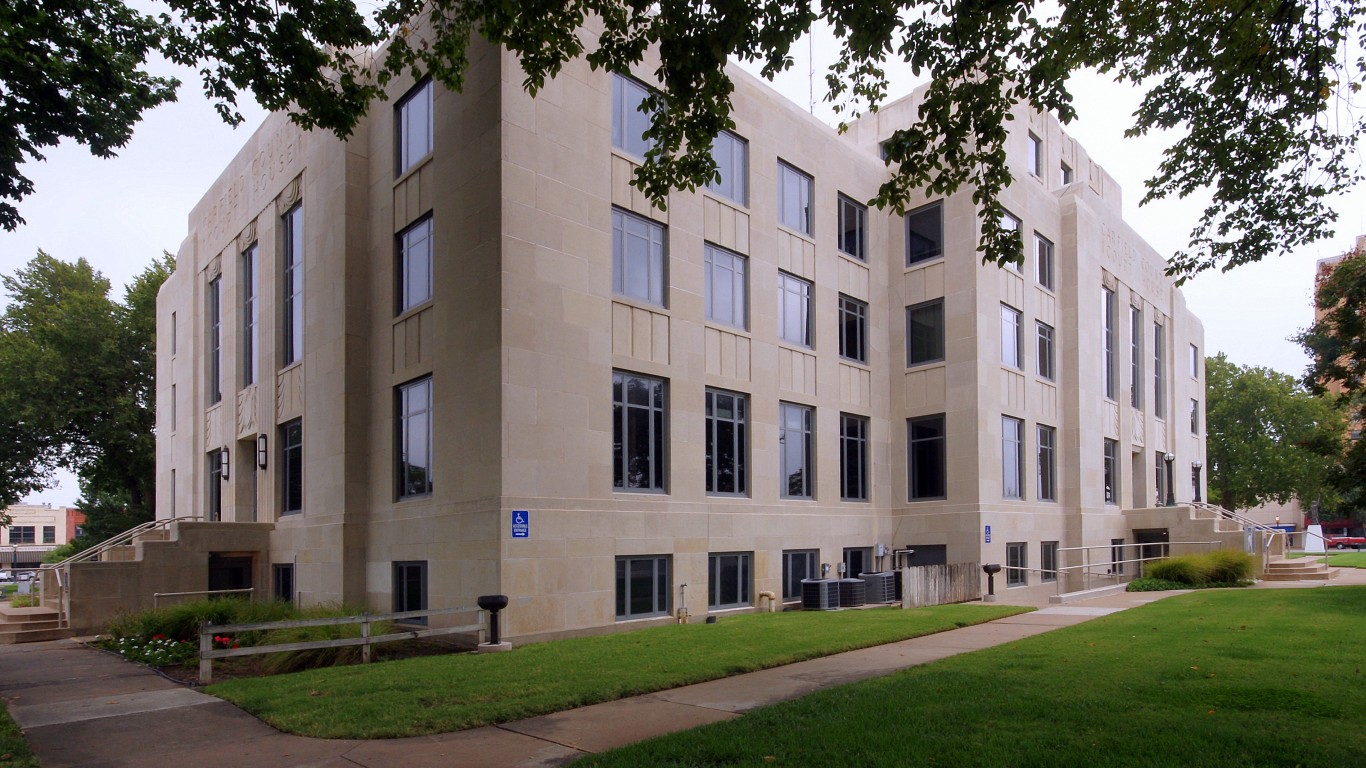
Enid (one of four metro areas in Oklahoma) has an average household income range among the middle 20% of earners of $46,709 – $62,878 with an average of $54,913. This is lower than the state as a whole at $47,234 – $74,521 with an average of $59,995. The median income among all households in the city is $55,131 (Oklahoma: $59,673) and 22.6% of adults hold a bachelor’s degree or higher (Oklahoma: 28.5%).
Oregon: Grants Pass

Grants Pass (one of eight metro areas in Oregon) has an average household income range among the middle 20% of earners of $40,809 – $72,639 with an average of $54,850. This is lower than the state as a whole at $60,274 – $93,712 with an average of $76,158. The median income among all households in the city is $53,838 (Oregon: $75,657) and 21.3% of adults hold a bachelor’s degree or higher (Oregon: 36.3%).
Pennsylvania: Johnstown

Johnstown (one of 18 metro areas in Pennsylvania) has an average household income range among the middle 20% of earners of $43,311 – $67,373 with an average of $55,497. This is lower than the state as a whole at $56,650 – $89,845 with an average of $72,280. The median income among all households in the city is $54,905 (Pennsylvania: $71,798) and 23.3% of adults hold a bachelor’s degree or higher (Pennsylvania: 35.1%).
Rhode Island: Providence-Warwick

Providence-Warwick (the only metro area in Rhode Island) has an average household income range among the middle 20% of earners of $63,719 – $102,920 with an average of $82,213. Statewide, the range is $64,544 – $102,587, with an average of $82,213. The median income among all households in the city is $81,784 (Rhode Island: $81,854) and 36.7% of adults hold a bachelor’s degree or higher (Rhode Island: 39.6%).
South Carolina: Florence
Florence (one of eight metro areas in South Carolina) has an average household income range among the middle 20% of earners of $39,550 – $66,252 with an average of $50,940. Statewide, the range is $50,604 – $79,729, with an average of $64,544. The median income among all households in the city is $50,219 (South Carolina: $64,115) and 24.3% of adults hold a bachelor’s degree or higher (South Carolina: 32.6%).
South Dakota: Rapid City
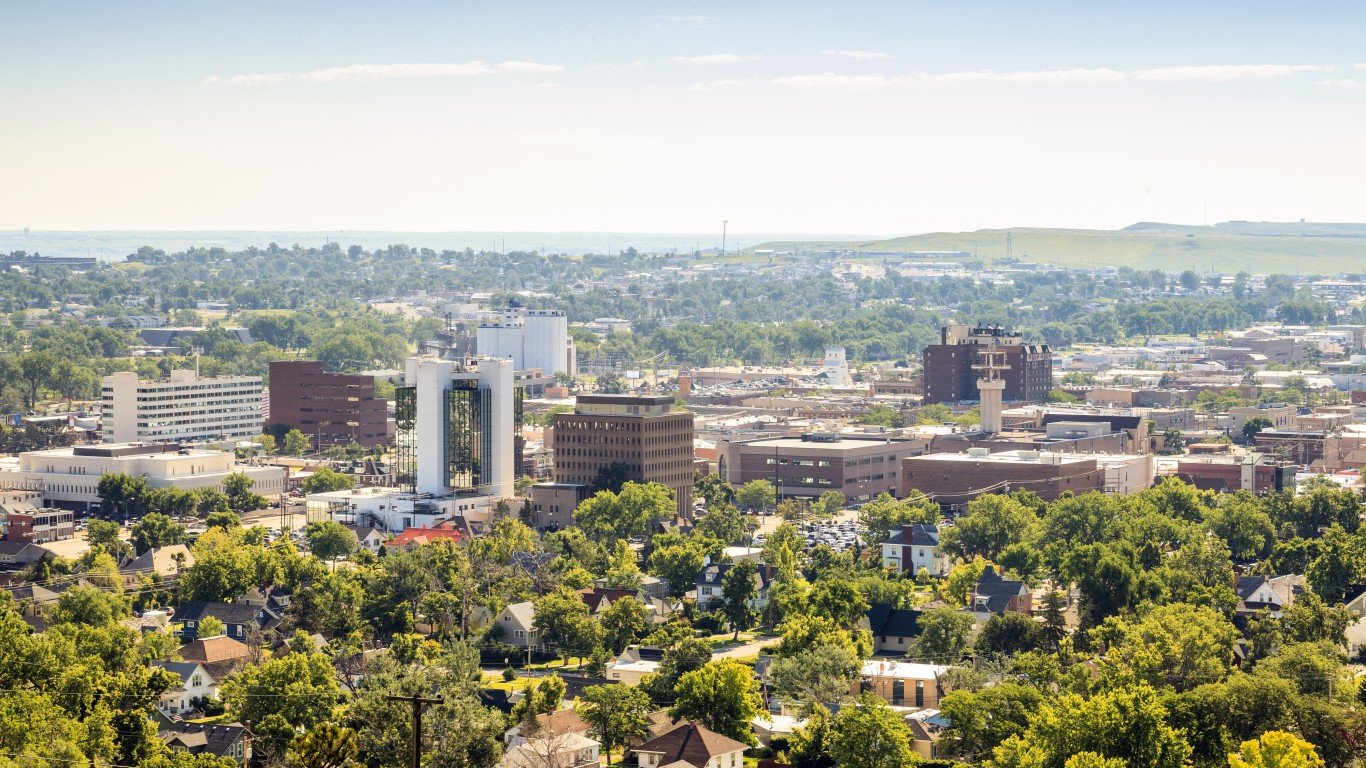
Rapid City (one of two metro areas in South Dakota) has an average household income range among the middle 20% of earners of $52,925 – $79,803 with an average of $66,702. This is lower than the state as a whole at $55,457 – $85,338 with an average of $69,936. The median income among all households in the city is $67,468 (South Dakota: $69,728) and 33.1% of adults hold a bachelor’s degree or higher (South Dakota: 31.6%).
Tennessee: Kingsport-Bristol

Kingsport-Bristol (one of 10 metro areas in Tennessee) has an average household income range among the middle 20% of earners of $41,707 – $67,224 with an average of $53,261. This is lower than the state as a whole at $51,957 – $80,848 with an average of $65,757. The median income among all households in the city is $52,887 (Tennessee: $65,254) and 21.8% of adults hold a bachelor’s degree or higher (Tennessee: 31.1%).
Texas: Texarkana
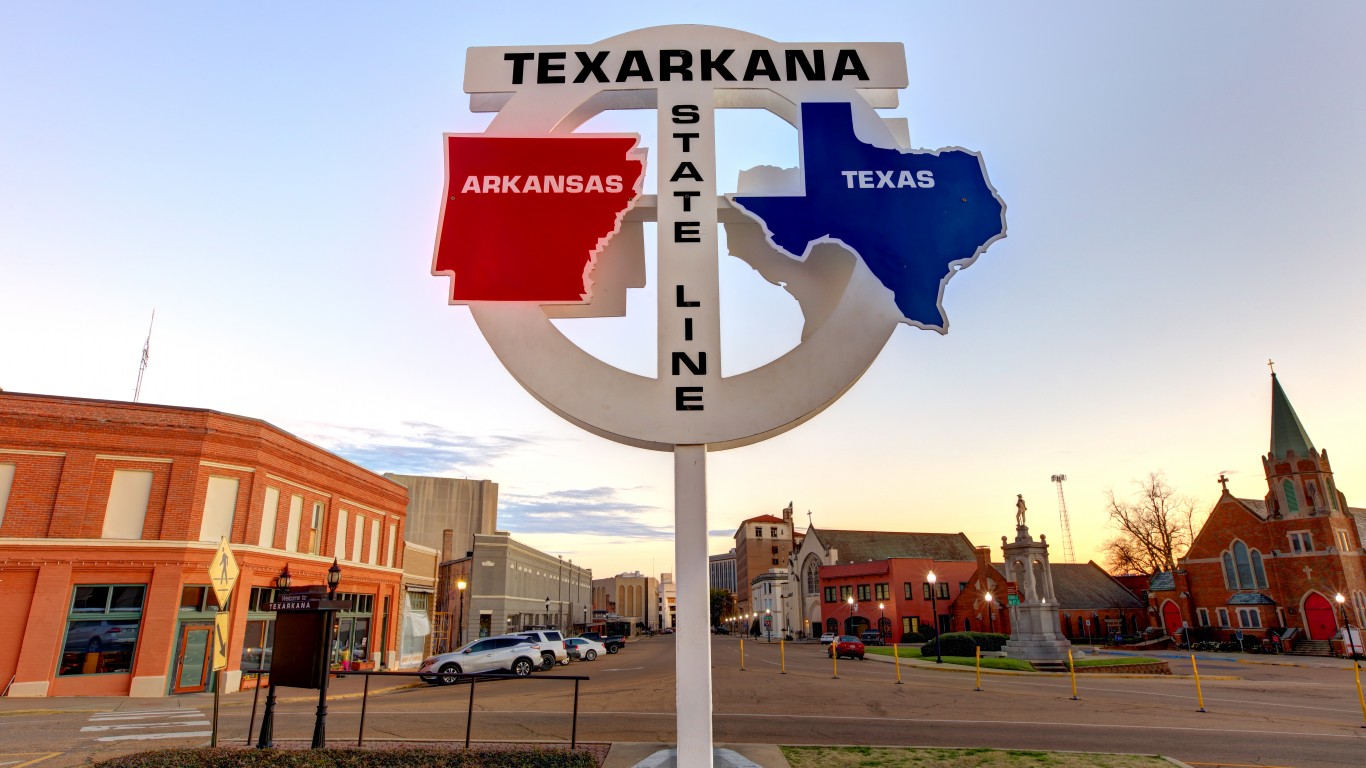
Texarkana (one of 25 metro areas in Texas) has an average household income range among the middle 20% of earners of $37,949 – $60,209 with an average of $48,651. This is lower than the state as a whole at $57,305 – $90,382 with an average of $72,774. The median income among all households in the city is $48,230 (Texas: $72,284) and 20.1% of adults hold a bachelor’s degree or higher (Texas: 33.9%).
Utah: St. George

St. George (one of five metro areas in Utah) has an average household income range among the middle 20% of earners of $61,246 – $96,638 with an average of $75,769. This is lower than the state as a whole at $72,820 – $107,175 with an average of $89,334. The median income among all households in the city is $74,543 (Utah: $89,168) and 36.6% of adults hold a bachelor’s degree or higher (Utah: 37.9%).
Vermont: Burlington-South Burlington

Burlington-South Burlington (the only metro area in Vermont) has an average household income range among the middle 20% of earners of $67,799 – $103,920 with an average of $84,848. This is compared to the state as a whole at $58,956 – $92,285 with an average of $74,558. The median income among all households in the city is $83,707 (Vermont: $73,991) and 52.8% of adults hold a bachelor’s degree or higher (Vermont: 44.2%).
Virginia: Lynchburg

Lynchburg (one of nine metro areas in Virginia) has an average household income range among the middle 20% of earners of $48,918 – $75,526 with an average of $62,170. This is lower than the state as a whole at $67,585 – $108,091 with an average of $86,799. The median income among all households in the city is $62,918 (Virginia: $85,873) and 31.0% of adults hold a bachelor’s degree or higher (Virginia: 42.2%).
Washington: Yakima

Yakima (one of 11 metro areas in Washington) has an average household income range among the middle 20% of earners of $51,286 – $82,619 with an average of $64,963. This is lower than the state as a whole at $72,798 – $111,855 with an average of $91,550. The median income among all households in the city is $63,865 (Washington: $91,306) and 18.9% of adults hold a bachelor’s degree or higher (Washington: 39.5%).
West Virginia: Beckley

Beckley (one of seven metro areas in West Virginia) has an average household income range among the middle 20% of earners of $40,222 – $64,458 with an average of $52,468. This is lower than the state as a whole at $42,002 – $68,527 with an average of $54,710. The median income among all households in the city is $52,633 (West Virginia: $54,329) and 21.0% of adults hold a bachelor’s degree or higher (West Virginia: 24.8%).
Wisconsin: Sheboygan
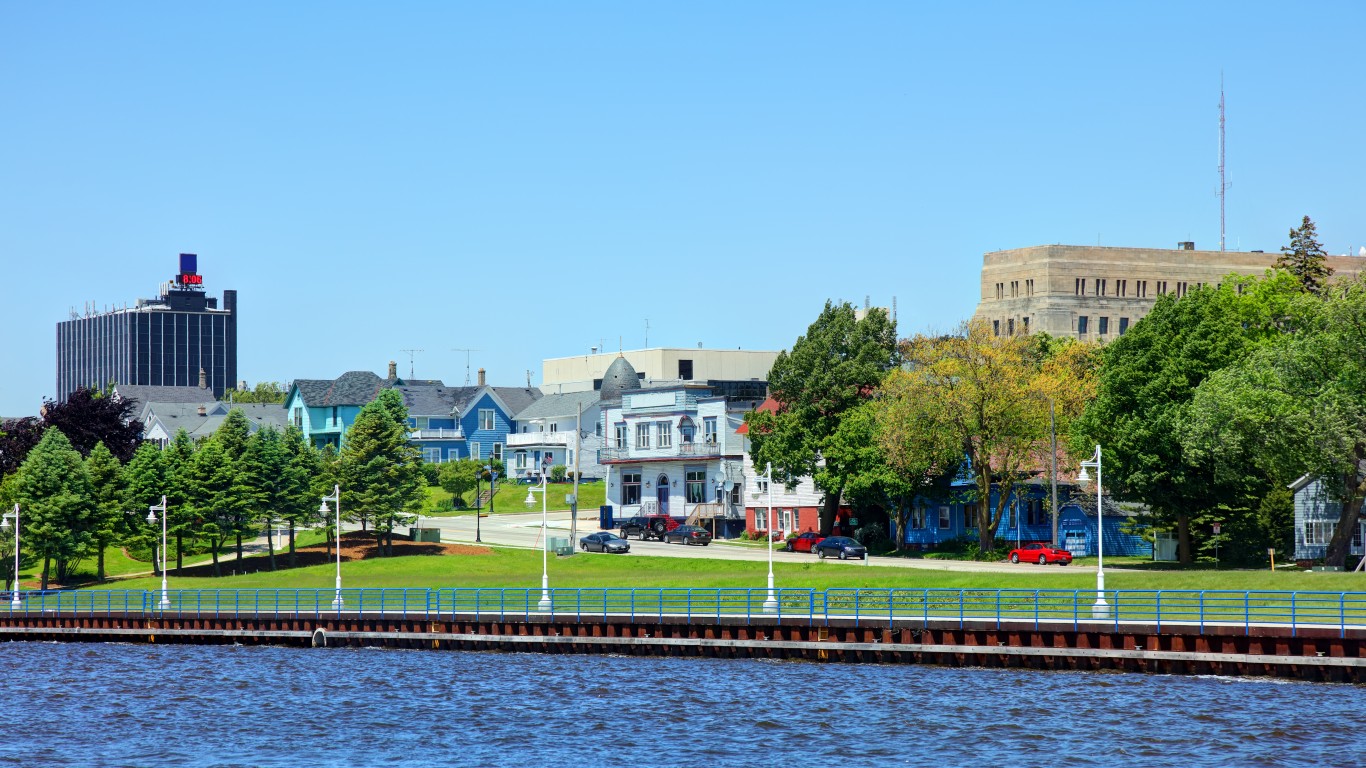
Sheboygan (one of 12 metro areas in Wisconsin) has an average household income range among the middle 20% of earners of $56,008 – $78,644 with an average of $64,516. This is lower than the state as a whole at $56,865 – $87,406 with an average of $71,197. The median income among all households in the city is $62,978 (Wisconsin: $70,996) and 27.5% of adults hold a bachelor’s degree or higher (Wisconsin: 33.2%).
Wyoming: Casper
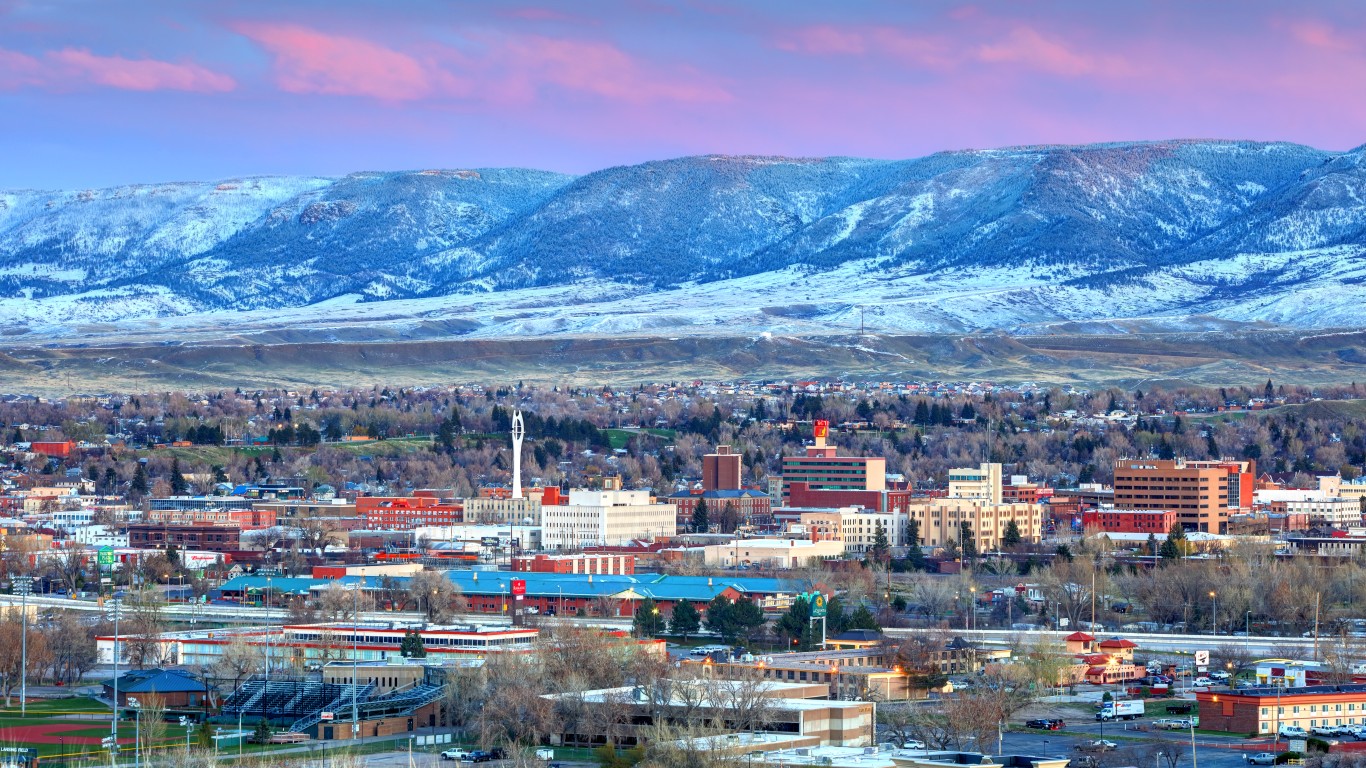
Casper (one of two metro areas in Wyoming) has an average household income range among the middle 20% of earners of $60,420 – $83,595 with an average of $69,931. This is compared to the middle-income range statewide, which is $56,419 – $85,886 with an average of $70,275. The median income among all households in the city is $69,627 (Wyoming: $70,042) and 31.6% of adults hold a bachelor’s degree or higher (Wyoming: 29.6%).
Methodology:
To identify the city in every state with the lowest-income middle class, 24/7 Wall St. reviewed metro area-level data from the U.S. Census Bureau’s 2022 American Community Survey. For each of the 384 U.S. metro areas with available data, we reviewed the average income among the middle 20% of households by earnings. In each state, the metro area with the lowest average income among the middle quintile of earners ranks as having the poorest middle class. All supplementary data is also from the 2022 ACS.
In cases where a metro area spans multiple states, the metro area was assigned to its primary state.
It is important to note that Delaware, New Hampshire, Rhode Island, and Vermont are each home to only one metro area. As a result, the city listed for each of these states ranks as having the poorest middle class by default only.
Get Ready To Retire (Sponsored)
Start by taking a quick retirement quiz from SmartAsset that will match you with up to 3 financial advisors that serve your area and beyond in 5 minutes, or less.
Each advisor has been vetted by SmartAsset and is held to a fiduciary standard to act in your best interests.
Here’s how it works:
1. Answer SmartAsset advisor match quiz
2. Review your pre-screened matches at your leisure. Check out the advisors’ profiles.
3. Speak with advisors at no cost to you. Have an introductory call on the phone or introduction in person and choose whom to work with in the future
Get started right here.
The post This Southern State Has the Poorest Middle Class appeared first on 24/7 Wall St..