More than 60 years have passed since President Lyndon Johnson declared war on poverty, and yet, poverty remains endemic in the United States. In any given year over the last three decades, anywhere from 31.6 million to 48.8 million Americans were living below the poverty line. Over that period, the annual U.S. poverty rate climbed as high as 15.9%, and never fell below 11.3%.
The effects of poverty extend far beyond economics. According to the latest Pulse Survey from the U.S. Census Bureau, 38% of American adults earning less than $25,000 reported feeling depressed or hopeless on most days, compared to 17% of all adults. Additionally, 27% of adults in the lowest income bracket reported not having enough to eat within the last week, three times the food insufficiency rate among all adults.
In most of the country, including Illinois, the U.S. Department of Health and Human Services sets the poverty line at an annual income of $15,060 for individuals and $31,200 for a family of four. In Illinois, 11.8% of the population live below these thresholds — and in many towns across the state, the poverty rate is far higher.
Using five-year estimates from the Census’ 2022 American Community Survey, 24/7 Wall St. identified the towns in Illinois with the highest poverty rates. We considered all places — including cities, towns, and unincorporated communities — with populations between 5,000 and 50,000. Because the presence of colleges and universities can distort economic realities in a given area, places where 20% or more of the population are enrolled in a post-secondary institution were excluded from analysis.
Among the 35 places on this list, poverty rates range from 19.4% to 41.2%, and in each of these places, the typical household earns less than the statewide median household income of $78,433.
Widespread financial hardship in these areas is partially attributable to a lack of economic opportunity. In most places on this list, the five-year average unemployment rate is higher than the comparable 5.9% jobless rate across Illinois.
Incomes and job security tend to rise with educational attainment. According to the Bureau of Labor Statistics, the typical worker with a bachelor’s degree earns 66% more than those with no more than a high school diploma. Additionally, workers with only a high school education are far more likely to be unemployed than college graduates. In every town on this list, the share of adults with a bachelor’s degree is below the 36.7% statewide bachelor’s degree attainment rate.
Why It Matters

The United States is, in many ways, the center of gravity of the global economy. The U.S. dollar has been the world’s leading reserve currency since the end of World War II, and American gross domestic product accounts for over a quarter of economic activity worldwide. Despite these advantages, more than one in every 10 Americans have been living below the poverty line for decades. For those facing serious financial hardship, the effects are far reaching. Poverty can negatively impact mental health, social relationships, and life expectancy.
35. Litchfield
- Poverty rate: 19.4%
- Median household income: $50,443
- 5-yr. avg. unemployment rate: 5.1%
- Adults with a bachelor’s degree or higher: 20.2%
- Population: 6,937
34. Wood River

- Poverty rate: 19.5%
- Median household income: $58,813
- 5-yr. avg. unemployment rate: 6.1%
- Adults with a bachelor’s degree or higher: 14.2%
- Population: 10,313
33. LaSalle

- Poverty rate: 19.7%
- Median household income: $49,583
- 5-yr. avg. unemployment rate: 5.3%
- Adults with a bachelor’s degree or higher: 12.7%
- Population: 9,562
32. Carmi

- Poverty rate: 20.0%
- Median household income: $50,116
- 5-yr. avg. unemployment rate: 1.9%
- Adults with a bachelor’s degree or higher: 11.8%
- Population: 5,042
31. Kewanee

- Poverty rate: 20.0%
- Median household income: $46,305
- 5-yr. avg. unemployment rate: 6.9%
- Adults with a bachelor’s degree or higher: 14.1%
- Population: 12,179
30. Chester

- Poverty rate: 20.1%
- Median household income: $68,826
- 5-yr. avg. unemployment rate: 3.7%
- Adults with a bachelor’s degree or higher: 7.8%
- Population: 6,941
29. Dolton

- Poverty rate: 20.2%
- Median household income: $54,748
- 5-yr. avg. unemployment rate: 12.7%
- Adults with a bachelor’s degree or higher: 23.1%
- Population: 21,283
28. Vandalia

- Poverty rate: 20.3%
- Median household income: $37,380
- 5-yr. avg. unemployment rate: 3.1%
- Adults with a bachelor’s degree or higher: 10.9%
- Population: 6,058
27. Pinckneyville
- Poverty rate: 20.3%
- Median household income: $36,893
- 5-yr. avg. unemployment rate: 1.8%
- Adults with a bachelor’s degree or higher: 10.0%
- Population: 5,104
26. Rantoul

- Poverty rate: 20.5%
- Median household income: $46,078
- 5-yr. avg. unemployment rate: 5.3%
- Adults with a bachelor’s degree or higher: 12.4%
- Population: 12,544
25. Galesburg

- Poverty rate: 20.6%
- Median household income: $42,346
- 5-yr. avg. unemployment rate: 5.2%
- Adults with a bachelor’s degree or higher: 19.2%
- Population: 29,923
24. Salem
- Poverty rate: 20.9%
- Median household income: $55,536
- 5-yr. avg. unemployment rate: 4.5%
- Adults with a bachelor’s degree or higher: 14.5%
- Population: 7,228
23. Mattoon

- Poverty rate: 21.1%
- Median household income: $45,953
- 5-yr. avg. unemployment rate: 7.9%
- Adults with a bachelor’s degree or higher: 18.9%
- Population: 16,830
22. Calumet City
- Poverty rate: 21.3%
- Median household income: $56,727
- 5-yr. avg. unemployment rate: 9.1%
- Adults with a bachelor’s degree or higher: 19.8%
- Population: 35,708
21. Justice

- Poverty rate: 21.9%
- Median household income: $60,083
- 5-yr. avg. unemployment rate: 5.0%
- Adults with a bachelor’s degree or higher: 16.6%
- Population: 12,525
20. North Chicago

- Poverty rate: 21.9%
- Median household income: $52,011
- 5-yr. avg. unemployment rate: 5.5%
- Adults with a bachelor’s degree or higher: 21.2%
- Population: 30,890
19. Rock Falls

- Poverty rate: 22.0%
- Median household income: $48,390
- 5-yr. avg. unemployment rate: 4.4%
- Adults with a bachelor’s degree or higher: 14.3%
- Population: 8,904
18. Streator

- Poverty rate: 22.0%
- Median household income: $46,615
- 5-yr. avg. unemployment rate: 9.1%
- Adults with a bachelor’s degree or higher: 13.8%
- Population: 12,279
17. Rock Island
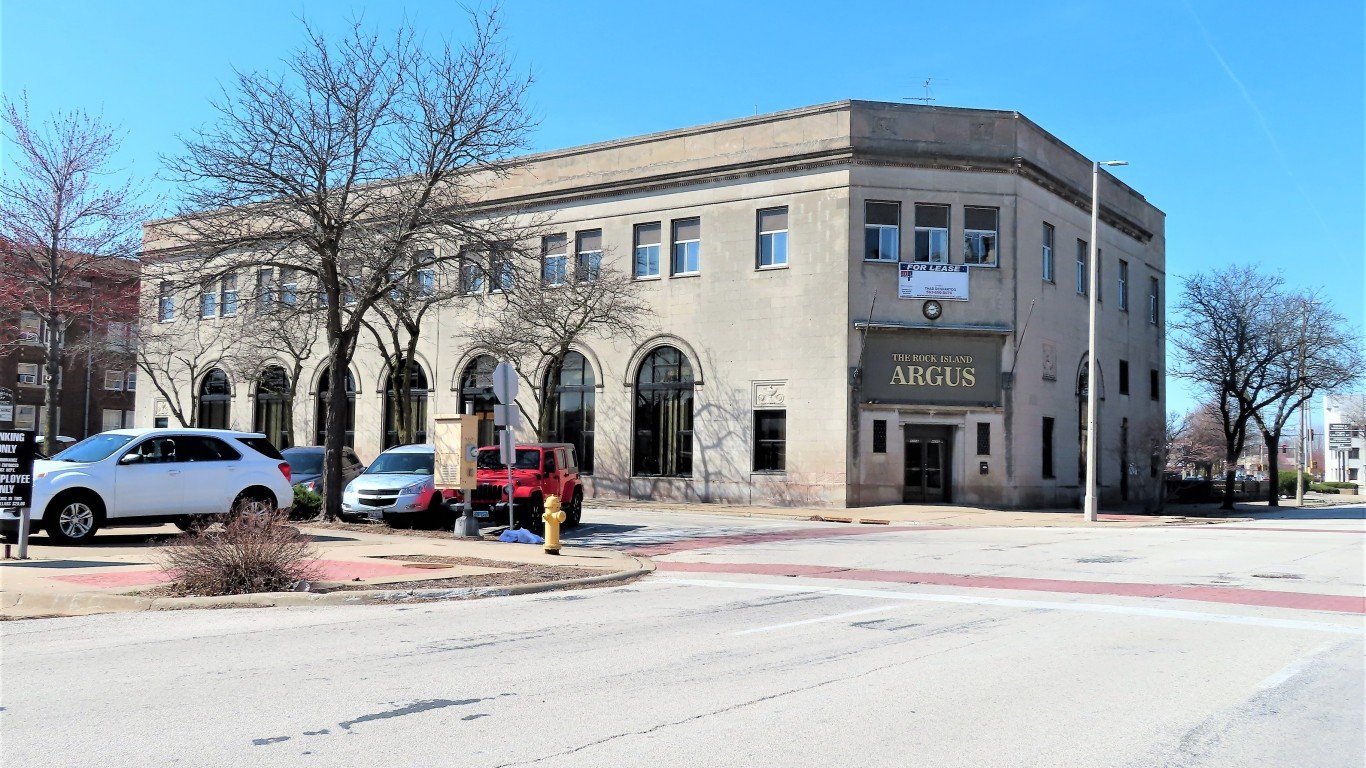
- Poverty rate: 22.7%
- Median household income: $55,732
- 5-yr. avg. unemployment rate: 7.3%
- Adults with a bachelor’s degree or higher: 22.5%
- Population: 37,264
16. Hazel Crest

- Poverty rate: 22.7%
- Median household income: $57,247
- 5-yr. avg. unemployment rate: 13.7%
- Adults with a bachelor’s degree or higher: 28.4%
- Population: 13,737
15. Markham
- Poverty rate: 23.2%
- Median household income: $47,955
- 5-yr. avg. unemployment rate: 14.0%
- Adults with a bachelor’s degree or higher: 15.9%
- Population: 11,592
14. Chicago Heights
- Poverty rate: 23.3%
- Median household income: $56,755
- 5-yr. avg. unemployment rate: 13.8%
- Adults with a bachelor’s degree or higher: 19.6%
- Population: 27,366
13. Centralia

- Poverty rate: 23.4%
- Median household income: $46,468
- 5-yr. avg. unemployment rate: 12.4%
- Adults with a bachelor’s degree or higher: 18.2%
- Population: 12,096
12. Harrisburg

- Poverty rate: 24.1%
- Median household income: $38,937
- 5-yr. avg. unemployment rate: 7.7%
- Adults with a bachelor’s degree or higher: 19.8%
- Population: 8,380
11. Harvey

- Poverty rate: 24.3%
- Median household income: $40,898
- 5-yr. avg. unemployment rate: 14.6%
- Adults with a bachelor’s degree or higher: 10.7%
- Population: 20,035
10. Alton

- Poverty rate: 24.5%
- Median household income: $49,439
- 5-yr. avg. unemployment rate: 6.6%
- Adults with a bachelor’s degree or higher: 20.1%
- Population: 25,642
9. Danville
- Poverty rate: 25.4%
- Median household income: $42,424
- 5-yr. avg. unemployment rate: 9.2%
- Adults with a bachelor’s degree or higher: 17.2%
- Population: 29,100
8. Carlinville

- Poverty rate: 25.7%
- Median household income: $53,583
- 5-yr. avg. unemployment rate: 0.9%
- Adults with a bachelor’s degree or higher: 25.9%
- Population: 5,724
7. Du Quoin
- Poverty rate: 27.1%
- Median household income: $48,770
- 5-yr. avg. unemployment rate: 11.6%
- Adults with a bachelor’s degree or higher: 9.4%
- Population: 5,822
6. Sauk Village

- Poverty rate: 28.3%
- Median household income: $50,393
- 5-yr. avg. unemployment rate: 15.9%
- Adults with a bachelor’s degree or higher: 17.6%
- Population: 9,862
5. Kankakee

- Poverty rate: 28.7%
- Median household income: $42,180
- 5-yr. avg. unemployment rate: 7.4%
- Adults with a bachelor’s degree or higher: 13.1%
- Population: 24,795
4. West Frankfort
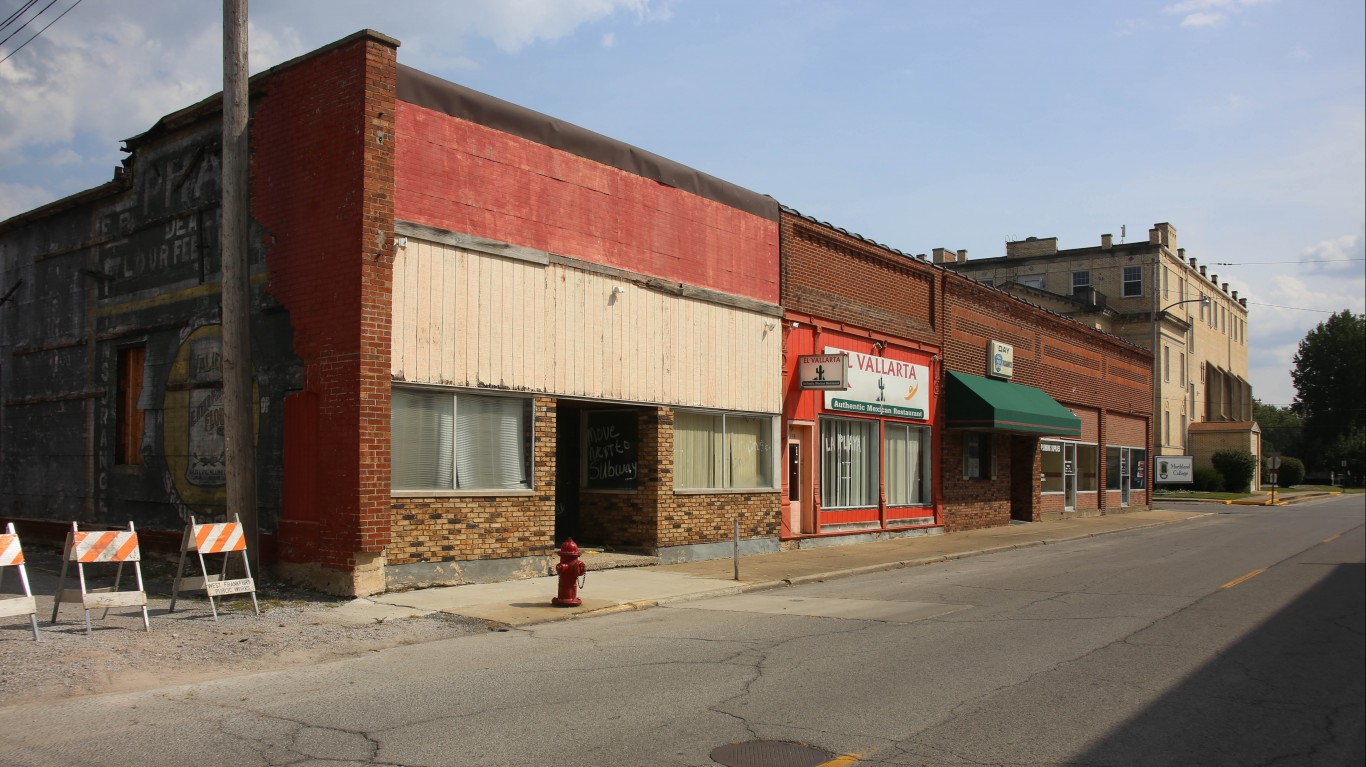
- Poverty rate: 29.5%
- Median household income: $41,974
- 5-yr. avg. unemployment rate: 12.8%
- Adults with a bachelor’s degree or higher: 10.5%
- Population: 7,168
3. Riverdale
- Poverty rate: 31.4%
- Median household income: $41,144
- 5-yr. avg. unemployment rate: 16.3%
- Adults with a bachelor’s degree or higher: 16.0%
- Population: 10,528
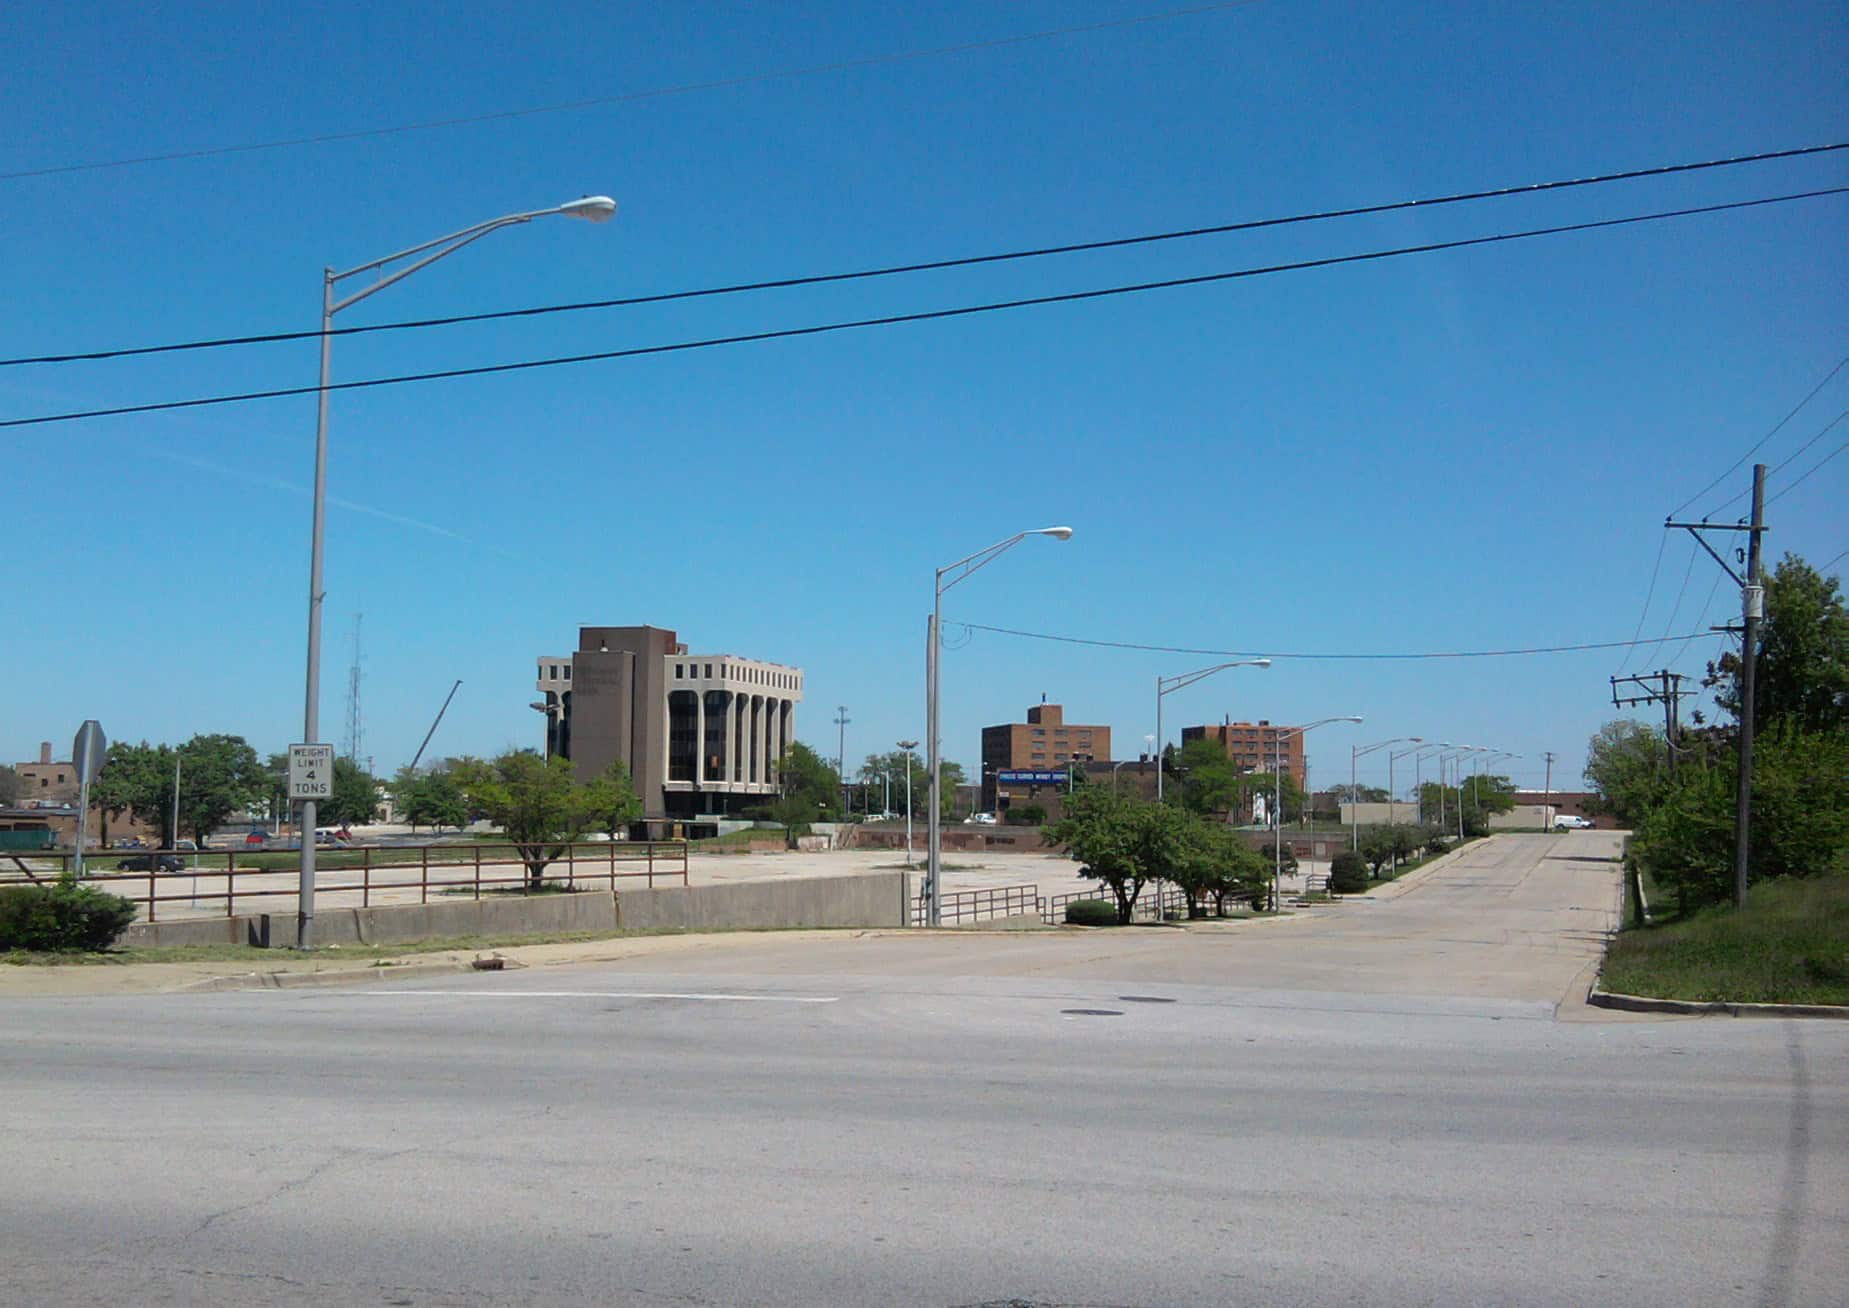
2. East St. Louis

- Poverty rate: 31.6%
- Median household income: $28,519
- 5-yr. avg. unemployment rate: 13.0%
- Adults with a bachelor’s degree or higher: 12.4%
- Population: 18,796
1. Cahokia Heights

- Poverty rate: 41.2%
- Median household income: $30,488
- 5-yr. avg. unemployment rate: 11.3%
- Adults with a bachelor’s degree or higher: 12.1%
- Population: 17,753
| Rank | Place | Poverty rate (%) | Median household income ($) | Unemployment rate (%) | Adults with a bachelor’s degree or higher (%) | Total population |
|---|---|---|---|---|---|---|
| 1 | Cahokia Heights, Illinois | 41.2 | 30,488 | 11.3 | 12.1 | 17,753 |
| 2 | East St. Louis, Illinois | 31.6 | 28,519 | 13.0 | 12.4 | 18,796 |
| 3 | Riverdale, Illinois | 31.4 | 41,144 | 16.3 | 16.0 | 10,528 |
| 4 | West Frankfort, Illinois | 29.5 | 41,974 | 12.8 | 10.5 | 7,168 |
| 5 | Kankakee, Illinois | 28.7 | 42,180 | 7.4 | 13.1 | 24,795 |
| 6 | Sauk Village, Illinois | 28.3 | 50,393 | 15.9 | 17.6 | 9,862 |
| 7 | Du Quoin, Illinois | 27.1 | 48,770 | 11.6 | 9.4 | 5,822 |
| 8 | Carlinville, Illinois | 25.7 | 53,583 | 0.9 | 25.9 | 5,724 |
| 9 | Danville, Illinois | 25.4 | 42,424 | 9.2 | 17.2 | 29,100 |
| 10 | Alton, Illinois | 24.5 | 49,439 | 6.6 | 20.1 | 25,642 |
| 11 | Harvey, Illinois | 24.3 | 40,898 | 14.6 | 10.7 | 20,035 |
| 12 | Harrisburg, Illinois | 24.1 | 38,937 | 7.7 | 19.8 | 8,380 |
| 13 | Centralia, Illinois | 23.4 | 46,468 | 12.4 | 18.2 | 12,096 |
| 14 | Chicago Heights, Illinois | 23.3 | 56,755 | 13.8 | 19.6 | 27,366 |
| 15 | Markham, Illinois | 23.2 | 47,955 | 14.0 | 15.9 | 11,592 |
| 16 | Hazel Crest, Illinois | 22.7 | 57,247 | 13.7 | 28.4 | 13,737 |
| 17 | Rock Island, Illinois | 22.7 | 55,732 | 7.3 | 22.5 | 37,264 |
| 18 | Streator, Illinois | 22.0 | 46,615 | 9.1 | 13.8 | 12,279 |
| 19 | Rock Falls, Illinois | 22.0 | 48,390 | 4.4 | 14.3 | 8,904 |
| 20 | North Chicago, Illinois | 21.9 | 52,011 | 5.5 | 21.2 | 30,890 |
| 21 | Justice, Illinois | 21.9 | 60,083 | 5.0 | 16.6 | 12,525 |
| 22 | Calumet City, Illinois | 21.3 | 56,727 | 9.1 | 19.8 | 35,708 |
| 23 | Mattoon, Illinois | 21.1 | 45,953 | 7.9 | 18.9 | 16,830 |
| 24 | Salem, Illinois | 20.9 | 55,536 | 4.5 | 14.5 | 7,228 |
| 25 | Galesburg, Illinois | 20.6 | 42,346 | 5.2 | 19.2 | 29,923 |
| 26 | Rantoul, Illinois | 20.5 | 46,078 | 5.3 | 12.4 | 12,544 |
| 27 | Pinckneyville, Illinois | 20.3 | 36,893 | 1.8 | 10.0 | 5,104 |
| 28 | Vandalia, Illinois | 20.3 | 37,380 | 3.1 | 10.9 | 6,058 |
| 29 | Dolton, Illinois | 20.2 | 54,748 | 12.7 | 23.1 | 21,283 |
| 30 | Chester, Illinois | 20.1 | 68,826 | 3.7 | 7.8 | 6,941 |
| 31 | Kewanee, Illinois | 20.0 | 46,305 | 6.9 | 14.1 | 12,179 |
| 32 | Carmi, Illinois | 20.0 | 50,116 | 1.9 | 11.8 | 5,042 |
| 33 | LaSalle, Illinois | 19.7 | 49,583 | 5.3 | 12.7 | 9,562 |
| 34 | Wood River, Illinois | 19.5 | 58,813 | 6.1 | 14.2 | 10,313 |
| 35 | Litchfield, Illinois | 19.4 | 50,443 | 5.1 | 20.2 | 6,937 |
Smart Investors Are Quietly Loading Up on These “Dividend Legends” (Sponsored)
If you want your portfolio to pay you cash like clockwork, it’s time to stop blindly following conventional wisdom like relying on Dividend Aristocrats. There’s a better option, and we want to show you. We’re offering a brand-new report on 2 stocks we believe offer the rare combination of a high dividend yield and significant stock appreciation upside. If you’re tired of feeling one step behind in this market, this free report is a must-read for you.
Click here to download your FREE copy of “2 Dividend Legends to Hold Forever” and start improving your portfolio today.
The post Towns in Illinois With the Worst Poverty appeared first on 24/7 Wall St..