Some cities can’t seem to stop their population from falling, especially in a number of swing states. With a heated presidential election ahead of us, how voters interpret the conditions causing those declines could be a deciding factor in the race.
To determine the fastest shrinking large cities, 24/7 Wall St. reviewed population data from the U.S. Census Bureau’s 2022 American Community Survey 1-year estimates. We listed all 43 metropolitan statistical areas with at least a 3% population decline from 2017 to 2022 in order from smallest to largest decline. Supplemental data on employment in December 2017 and December 2022 as well as unemployment rates came from the Bureau of Labor Statistics, and are seasonally-adjusted figures. Home value data came from the ACS.
Why We’re Writing About This
America’s cities are changing — but not all of them are growing. Certain cities are experiencing rapid population loss, with the top city on our list losing 22.81% of its population over a five-year period. These changing demographics have wide-reaching consequences that can impact your local community and economy. For residents and people looking to move, understanding what cities people are leaving — and why — helps you to make the best decision about where you want to end up.
Here are the cities with the fastest shrinking populations:
43. San Jose-Sunnyvale-Santa Clara, CA
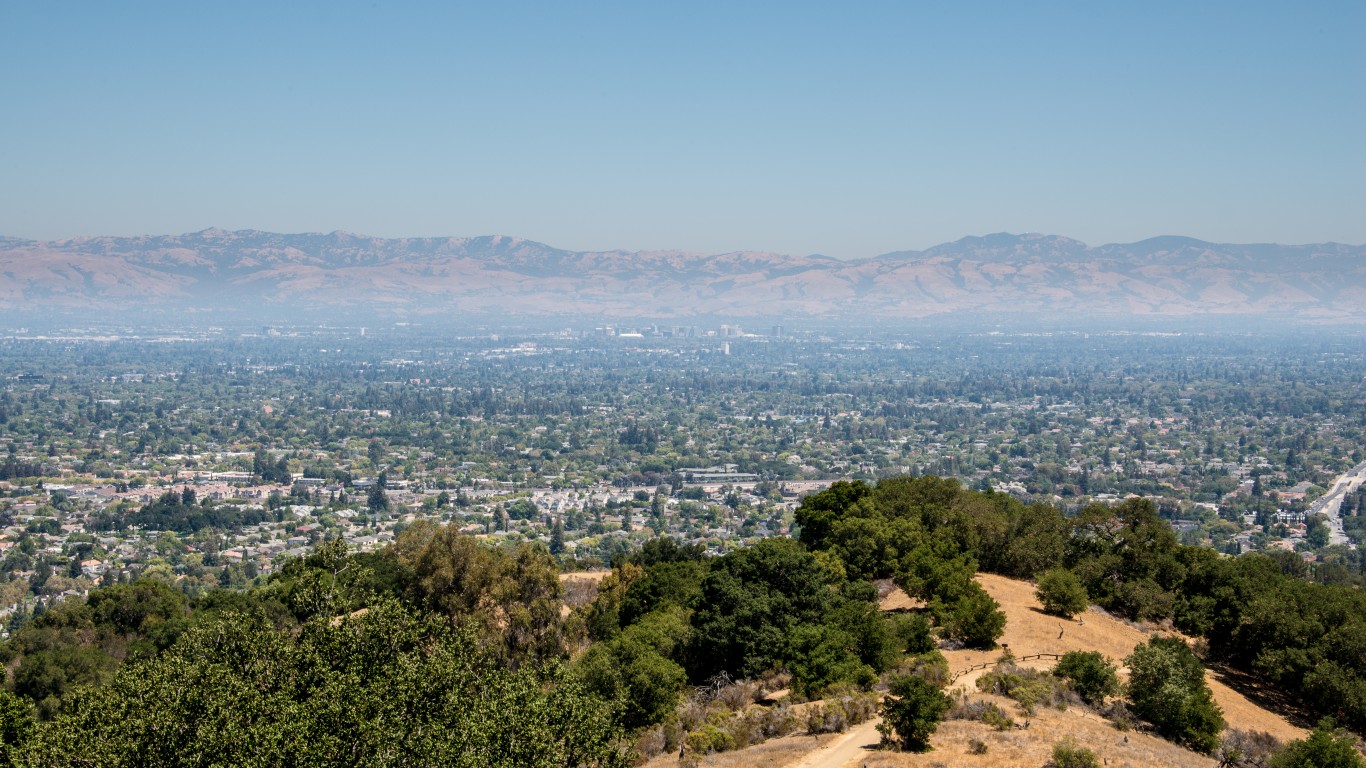
- 2017-2022 population change: -3.00% (-59,939)
- 2022 population: 1,938,524 — 36th highest out of 387
- 2017 population: 1,998,463 — 35th highest out of 387
- 2017-2022 employment change: +2.2% — 186th largest increase out of 257
- Unemployment rate, Dec 2022: 2.6% — compared to 3.5% national
- 2018-2022 median home value change: 30.4% — compared to 39.7% nationwide
- Median home value, 2022: $1,422,600 — 1st highest out of 387
42. Victoria, TX

- 2017-2022 population change: -3.06% (-3,068)
- 2022 population: 97,160 — 360th highest out of 387
- 2017 population: 100,228 — 352nd highest out of 387
- 2017-2022 employment change: -2.0% — 69th largest decrease out of 115
- Unemployment rate, Dec 2022: 3.9% — compared to 3.5% national
- 2018-2022 median home value change: 39.4% — compared to 39.7% nationwide
- Median home value, 2022: $203,800 — 263rd highest out of 387
41. Greenville, NC

- 2017-2022 population change: -3.07% (-5,500)
- 2022 population: 173,542 — 248th highest out of 387
- 2017 population: 179,042 — 232nd highest out of 387
- 2017-2022 employment change: +0.2% — 250th largest increase out of 257
- Unemployment rate, Dec 2022: 4.1% — compared to 3.5% national
- 2018-2022 median home value change: 51.5% — compared to 39.7% nationwide
- Median home value, 2022: $221,700 — 234th highest out of 387
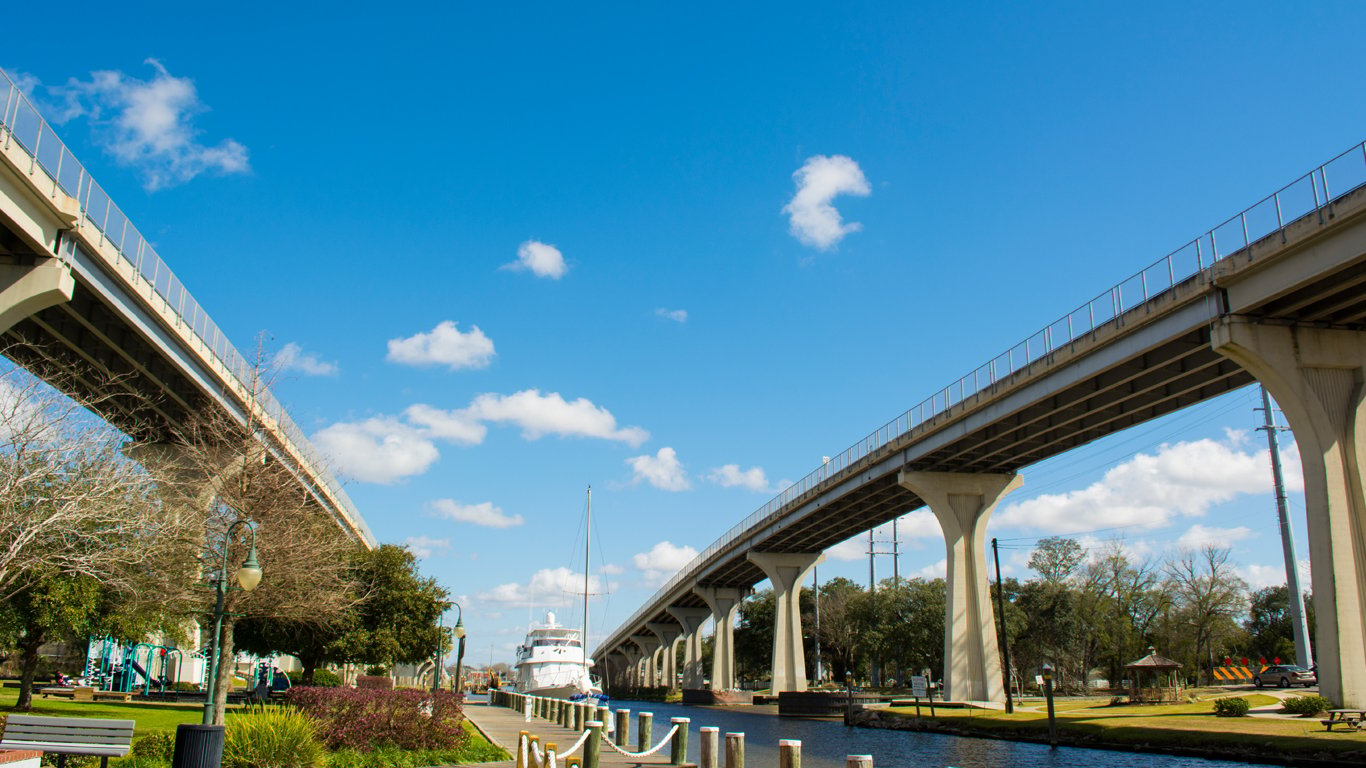
40. Alexandria, LA
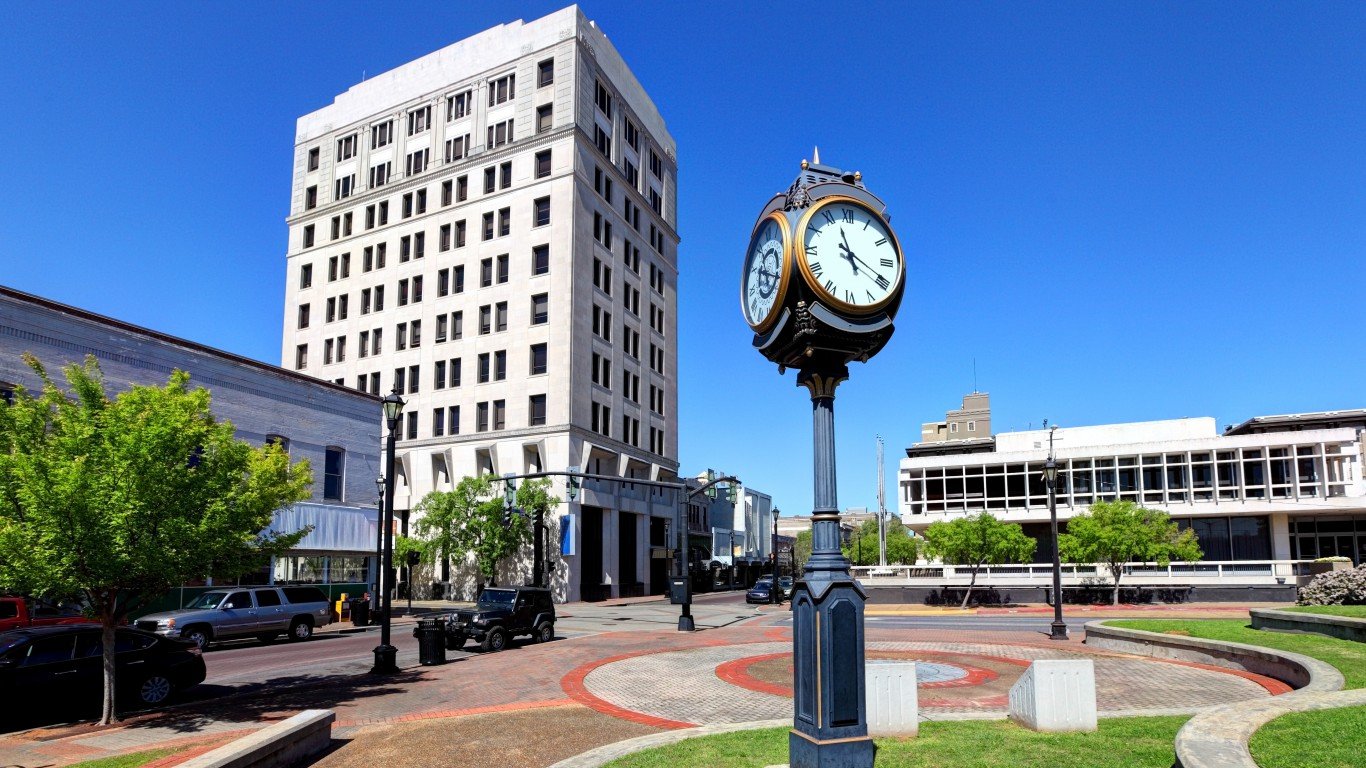
- 2017-2022 population change: -3.11% (-4,795)
- 2022 population: 149,189 — 283rd highest out of 387
- 2017 population: 153,984 — 265th highest out of 387
- 2017-2022 employment change: +3.0% — 162nd largest increase out of 257
- Unemployment rate, Dec 2022: 3.3% — compared to 3.5% national
- 2018-2022 median home value change: 21.6% — compared to 39.7% nationwide
- Median home value, 2022: $174,300 — 319th highest out of 387
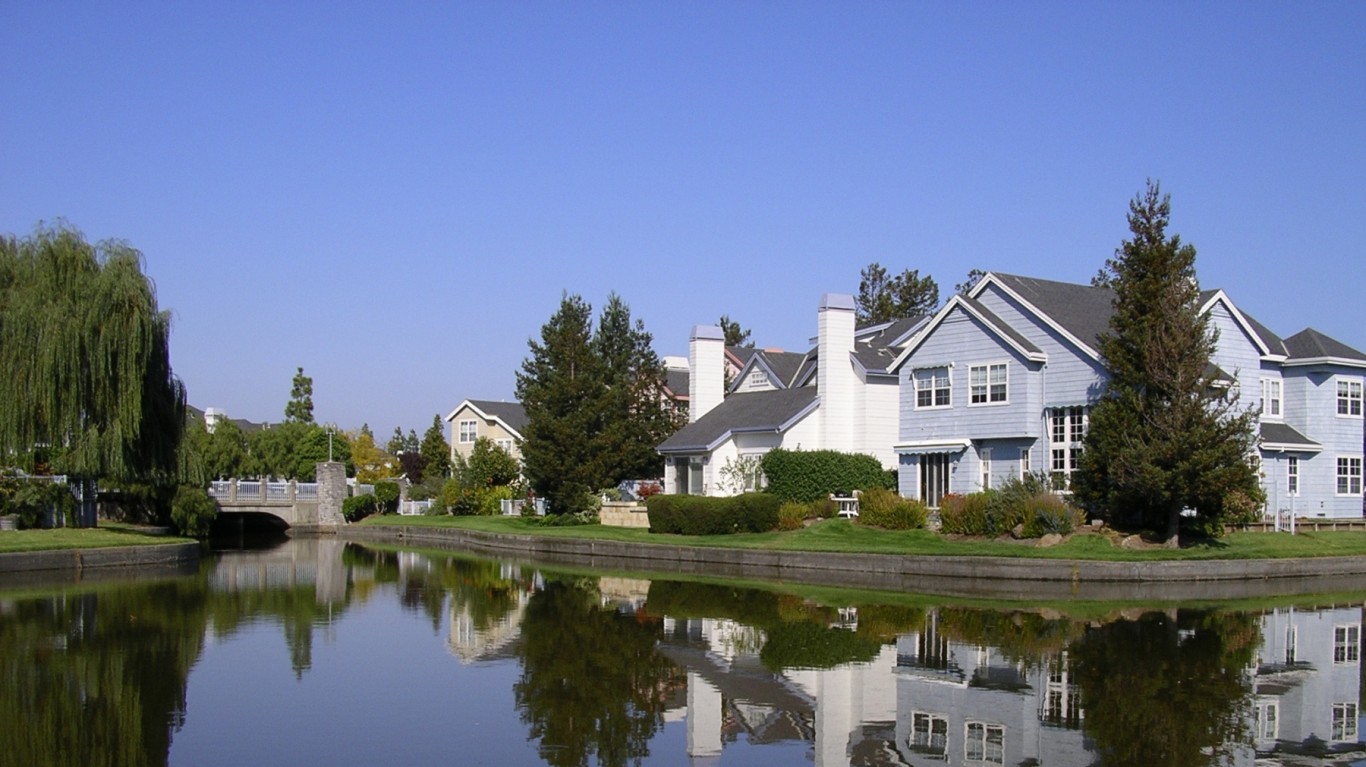
39. San Francisco-Oakland-Berkeley, CA

- 2017-2022 population change: -3.13% (-147,758)
- 2022 population: 4,579,599 — 13th highest out of 387
- 2017 population: 4,727,357 — 12th highest out of 387
- 2017-2022 employment change: +0.3% — 246th largest increase out of 257
- Unemployment rate, Dec 2022: 2.9% — compared to 3.5% national
- 2018-2022 median home value change: 24.7% — compared to 39.7% nationwide
- Median home value, 2022: $1,135,500 — 2nd highest out of 387
38. Wheeling, WV-OH
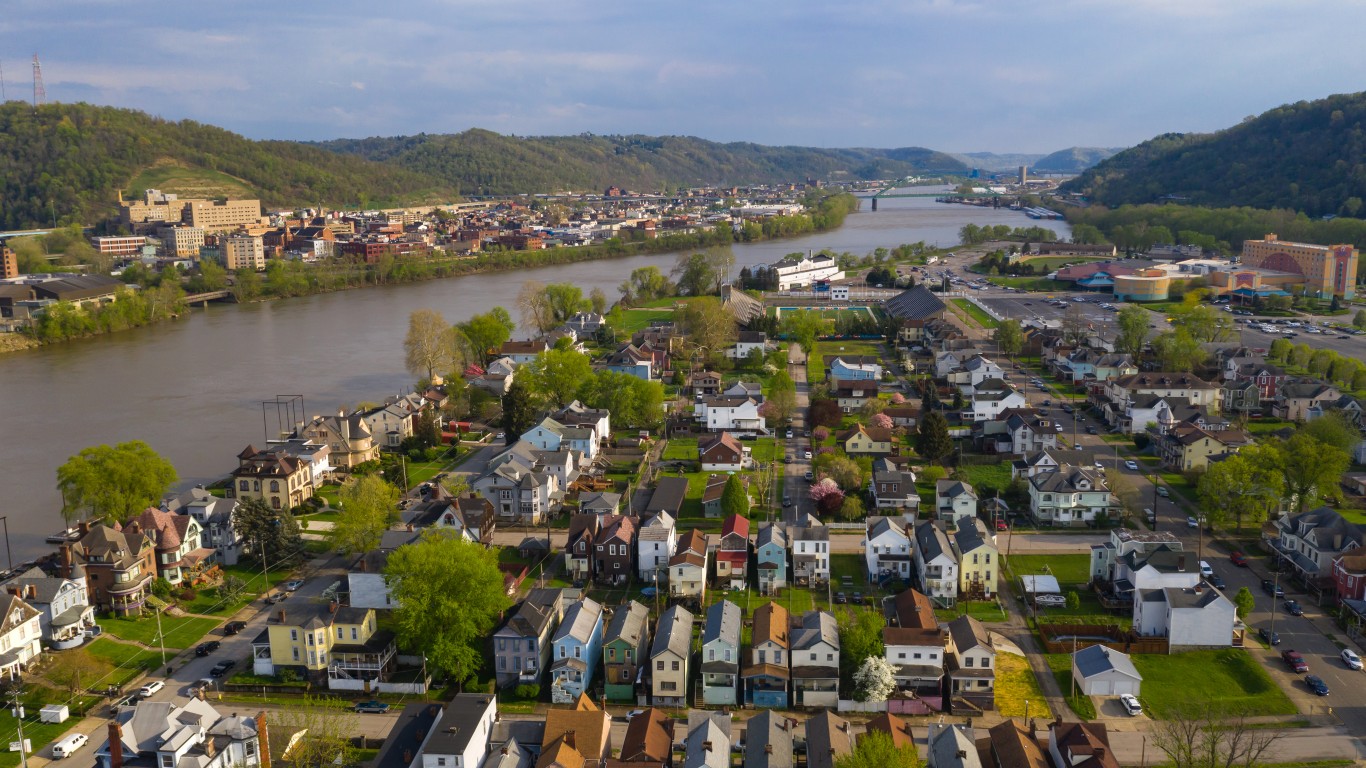
- 2017-2022 population change: -3.22% (-4,546)
- 2022 population: 136,708 — 299th highest out of 387
- 2017 population: 141,254 — 287th highest out of 387
- 2017-2022 employment change: -9.0% — 4th largest decrease out of 115
- Unemployment rate, Dec 2022: 4.8% — compared to 3.5% national
- 2018-2022 median home value change: 27.8% — compared to 39.7% nationwide
- Median home value, 2022: $139,800 — 369th highest out of 387
37. Kankakee, IL
- 2017-2022 population change: -3.22% (-3,531)
- 2022 population: 106,074 — 343rd highest out of 387
- 2017 population: 109,605 — 338th highest out of 387
- 2017-2022 employment change: -5.3% — 15th largest decrease out of 115
- Unemployment rate, Dec 2022: 5.1% — compared to 3.5% national
- 2018-2022 median home value change: 34.7% — compared to 39.7% nationwide
- Median home value, 2022: $198,400 — 277th highest out of 387
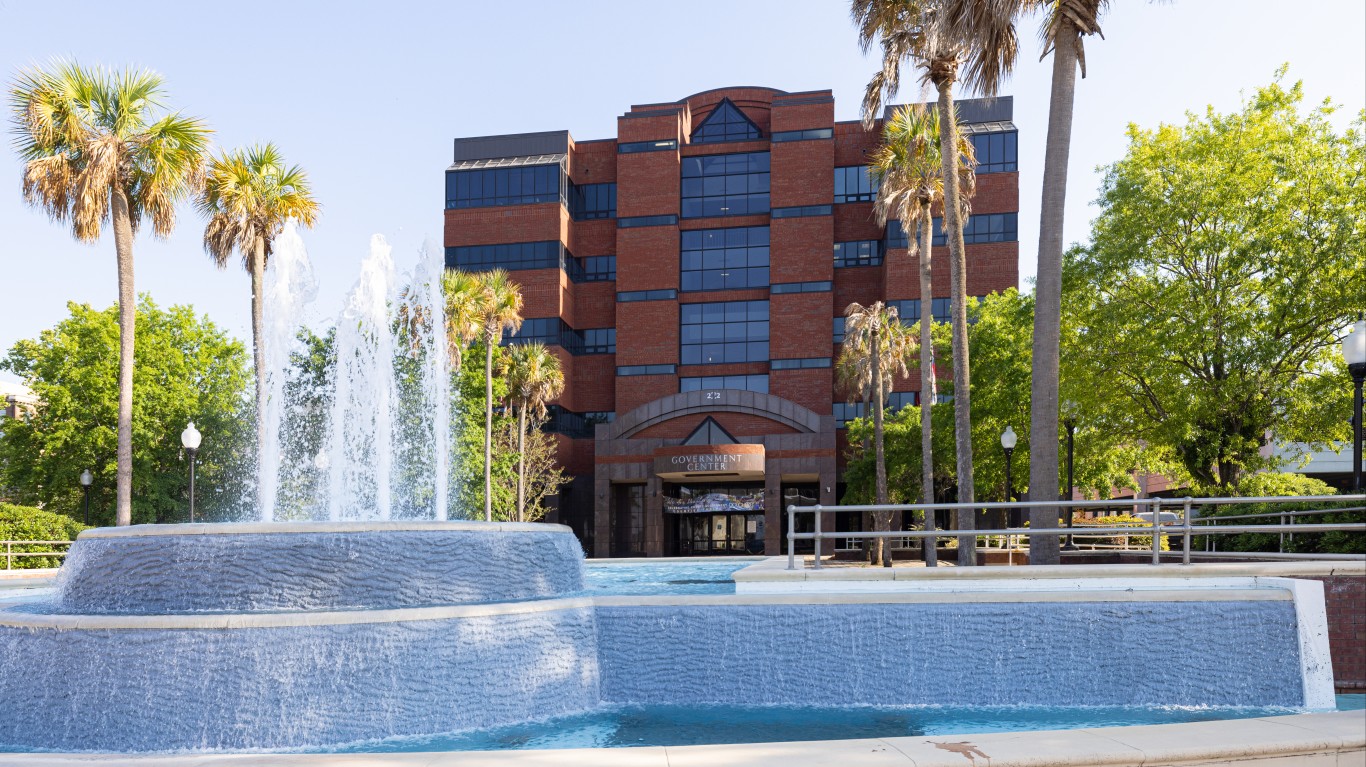
36. Florence, SC
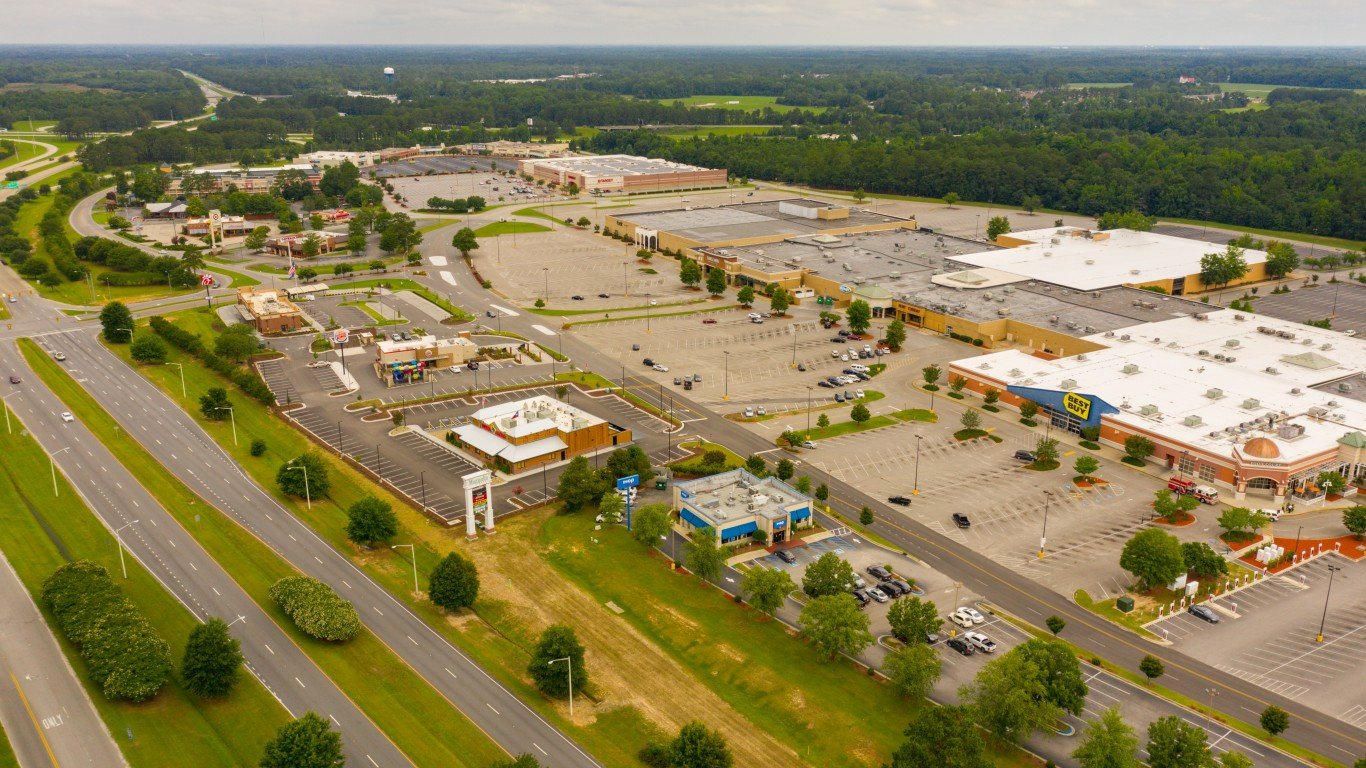
- 2017-2022 population change: -3.26% (-6,712)
- 2022 population: 199,119 — 224th highest out of 387
- 2017 population: 205,831 — 215th highest out of 387
- 2017-2022 employment change: +3.2% — 156th largest increase out of 257
- Unemployment rate, Dec 2022: 3.2% — compared to 3.5% national
- 2018-2022 median home value change: 33.9% — compared to 39.7% nationwide
- Median home value, 2022: $167,100 — 334th highest out of 387
35. New Bern, NC
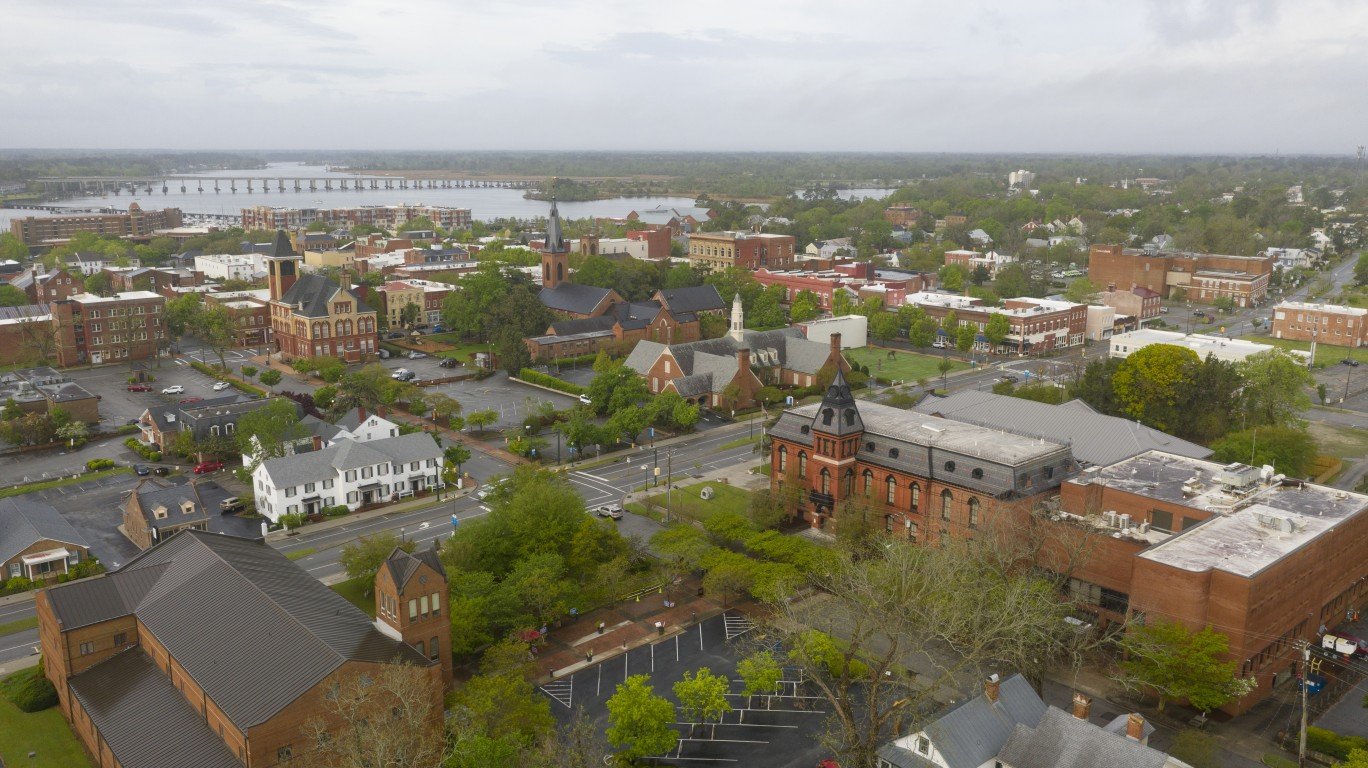
- 2017-2022 population change: -3.33% (-4,189)
- 2022 population: 121,597 — 322nd highest out of 387
- 2017 population: 125,786 — 310th highest out of 387
- 2017-2022 employment change: +3.3% — 154th largest increase out of 257
- Unemployment rate, Dec 2022: 3.7% — compared to 3.5% national
- 2018-2022 median home value change: 28.5% — compared to 39.7% nationwide
- Median home value, 2022: $204,200 — 262nd highest out of 387
34. New York-Newark-Jersey City, NY-NJ-PA
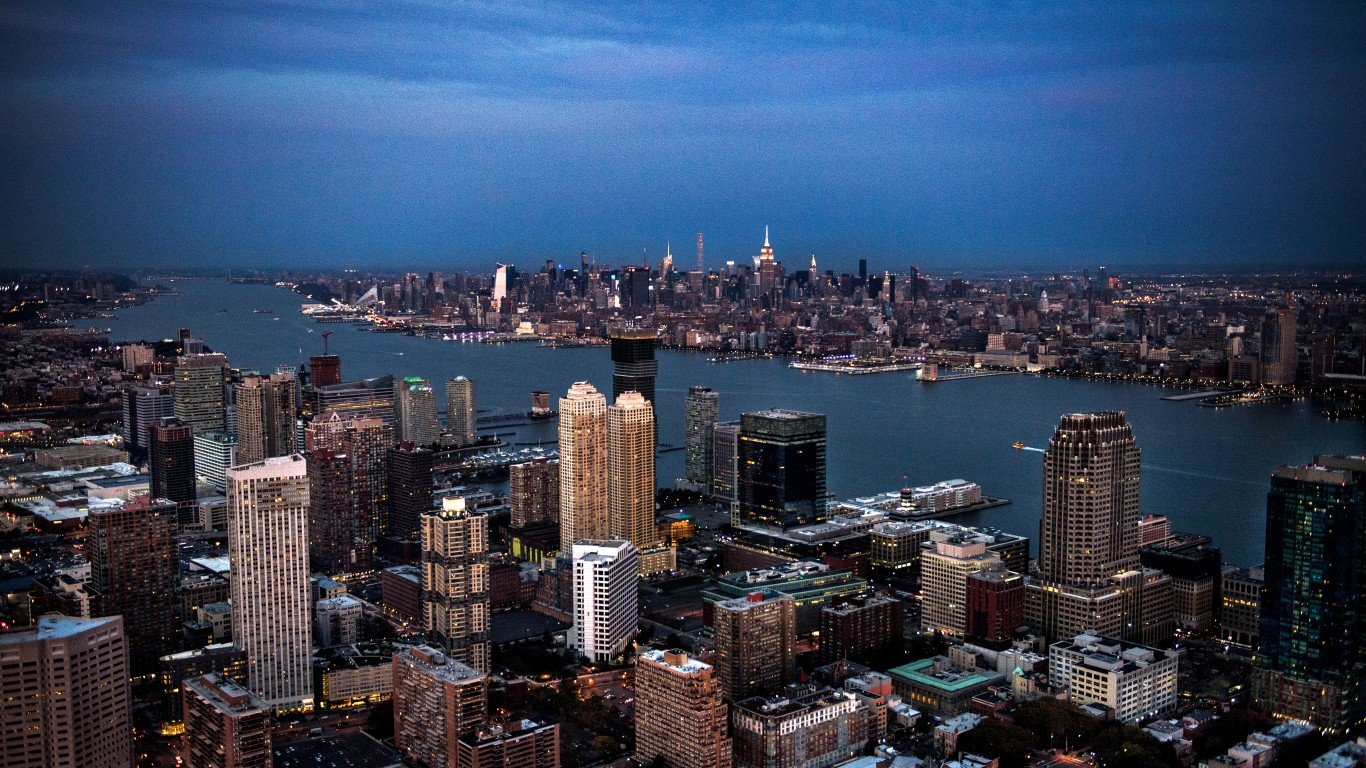
- 2017-2022 population change: -3.46% (-703,007)
- 2022 population: 19,617,869 — 1st highest out of 387
- 2017 population: 20,320,876 — 1st highest out of 387
- 2017-2022 employment change: +0.2% — 248th largest increase out of 257
- Unemployment rate, Dec 2022: 3.9% — compared to 3.5% national
- 2018-2022 median home value change: 26.6% — compared to 39.7% nationwide
- Median home value, 2022: $578,800 — 23rd highest out of 387
33. Albany, GA
- 2017-2022 population change: -3.54% (-5,367)
- 2022 population: 146,387 — 285th highest out of 387
- 2017 population: 151,754 — 270th highest out of 387
- 2017-2022 employment change: -4.1% — 26th largest decrease out of 115
- Unemployment rate, Dec 2022: 3.8% — compared to 3.5% national
- 2018-2022 median home value change: 26.6% — compared to 39.7% nationwide
- Median home value, 2022: $141,700 — 365th highest out of 387
32. Los Angeles-Long Beach-Anaheim, CA

- 2017-2022 population change: -3.61% (-481,585)
- 2022 population: 12,872,322 — 2nd highest out of 387
- 2017 population: 13,353,907 — 2nd highest out of 387
- 2017-2022 employment change: -2.3% — 57th largest decrease out of 115
- Unemployment rate, Dec 2022: 4.2% — compared to 3.5% national
- 2018-2022 median home value change: 30.3% — compared to 39.7% nationwide
- Median home value, 2022: $847,400 — 7th highest out of 387
31. Charlottesville, VA
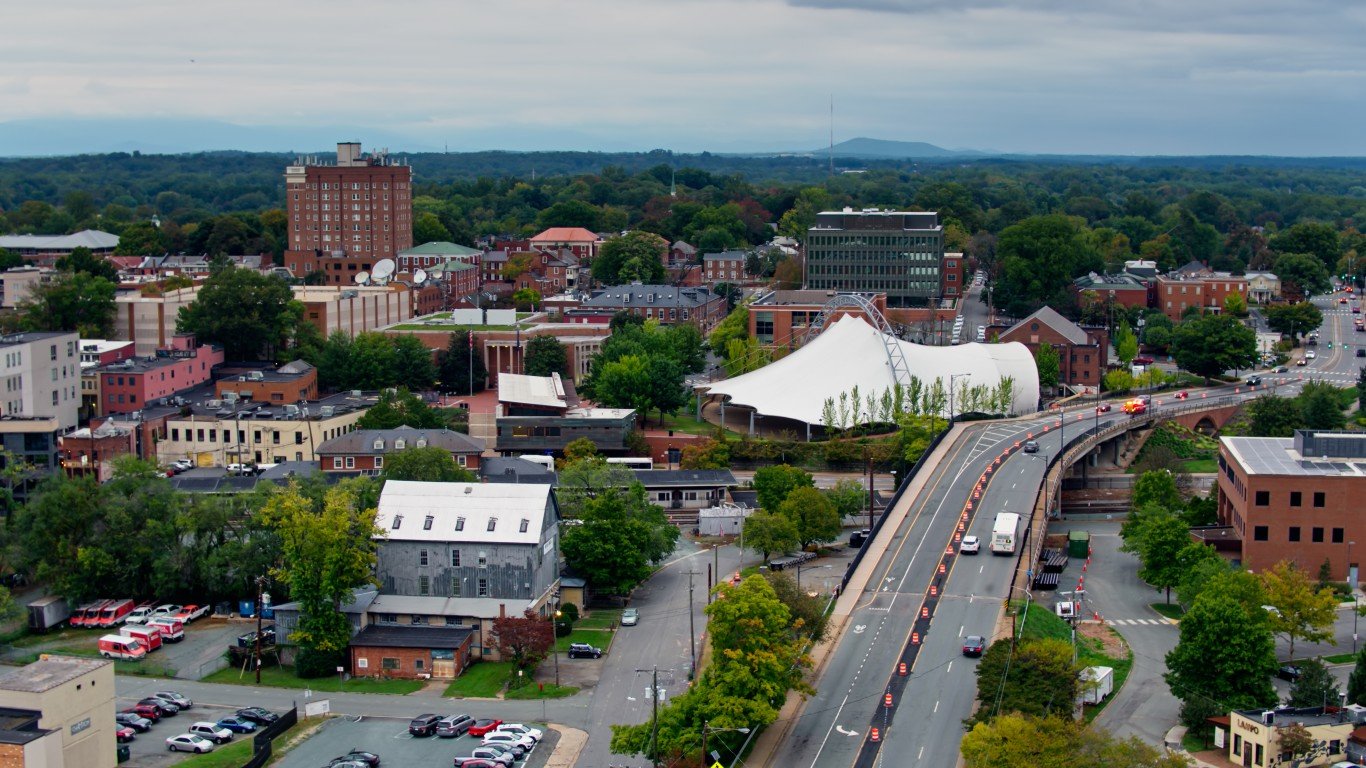
- 2017-2022 population change: -3.72% (-8,648)
- 2022 population: 223,534 — 204th highest out of 387
- 2017 population: 232,182 — 194th highest out of 387
- 2017-2022 employment change: +3.4% — 151st largest increase out of 257
- Unemployment rate, Dec 2022: 2.9% — compared to 3.5% national
- 2018-2022 median home value change: 39.2% — compared to 39.7% nationwide
- Median home value, 2022: $416,300 — 62nd highest out of 387
30. Bloomington, IN
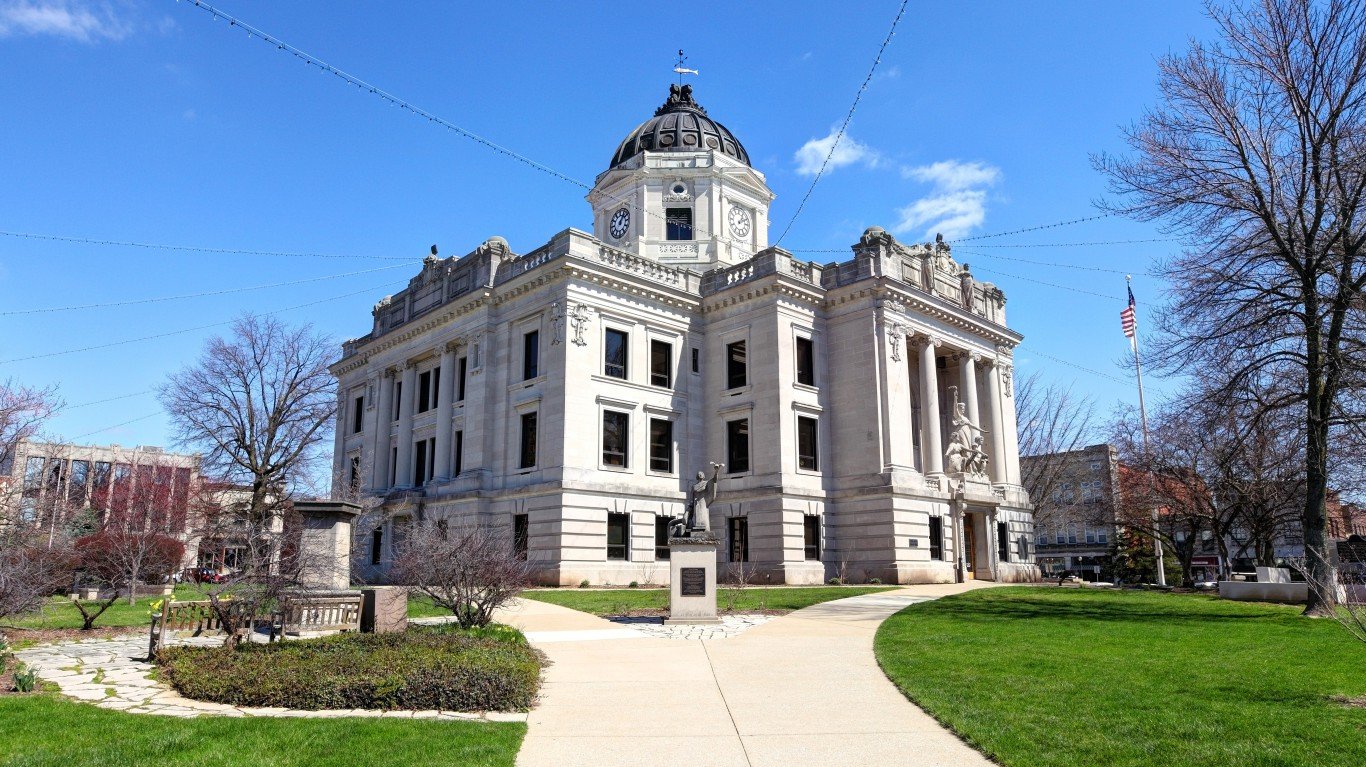
- 2017-2022 population change: -3.93% (-6,598)
- 2022 population: 161,227 — 262th highest out of 387
- 2017 population: 167,825 — 248th highest out of 387
- 2017-2022 employment change: +2.8% — 167th largest increase out of 257
- Unemployment rate, Dec 2022: 2.9% — compared to 3.5% national
- 2018-2022 median home value change: 46.3% — compared to 39.7% nationwide
- Median home value, 2022: $252,500 — 187th highest out of 387
29. Decatur, IL

- 2017-2022 population change: -4.08% (-4,318)
- 2022 population: 101,483 — 352nd highest out of 387
- 2017 population: 105,801 — 342nd highest out of 387
- 2017-2022 employment change: -8.4% — 6th largest decrease out of 115
- Unemployment rate, Dec 2022: 5.1% — compared to 3.5% national
- 2018-2022 median home value change: 6.7% — compared to 39.7% nationwide
- Median home value, 2022: $108,900 — 379th highest out of 387
28. Santa Cruz-Watsonville, CA
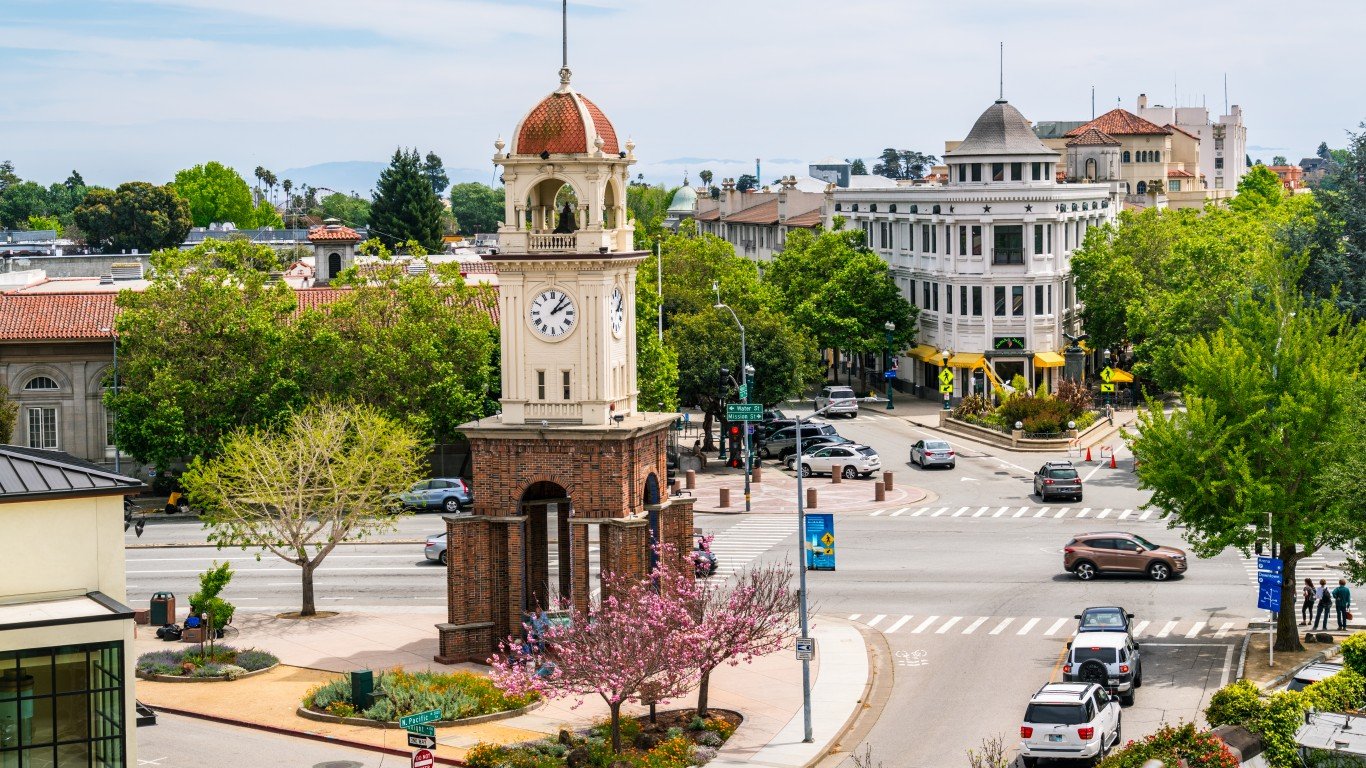
- 2017-2022 population change: -4.18% (-11,527)
- 2022 population: 264,370 — 185th highest out of 387
- 2017 population: 275,897 — 172nd highest out of 387
- 2017-2022 employment change: -4.4% — 21st largest decrease out of 115
- Unemployment rate, Dec 2022: 4.8% — compared to 3.5% national
- 2018-2022 median home value change: 24.4% — compared to 39.7% nationwide
- Median home value, 2022: $1,013,900 — 3rd highest out of 387
27. Santa Rosa-Petaluma, CA
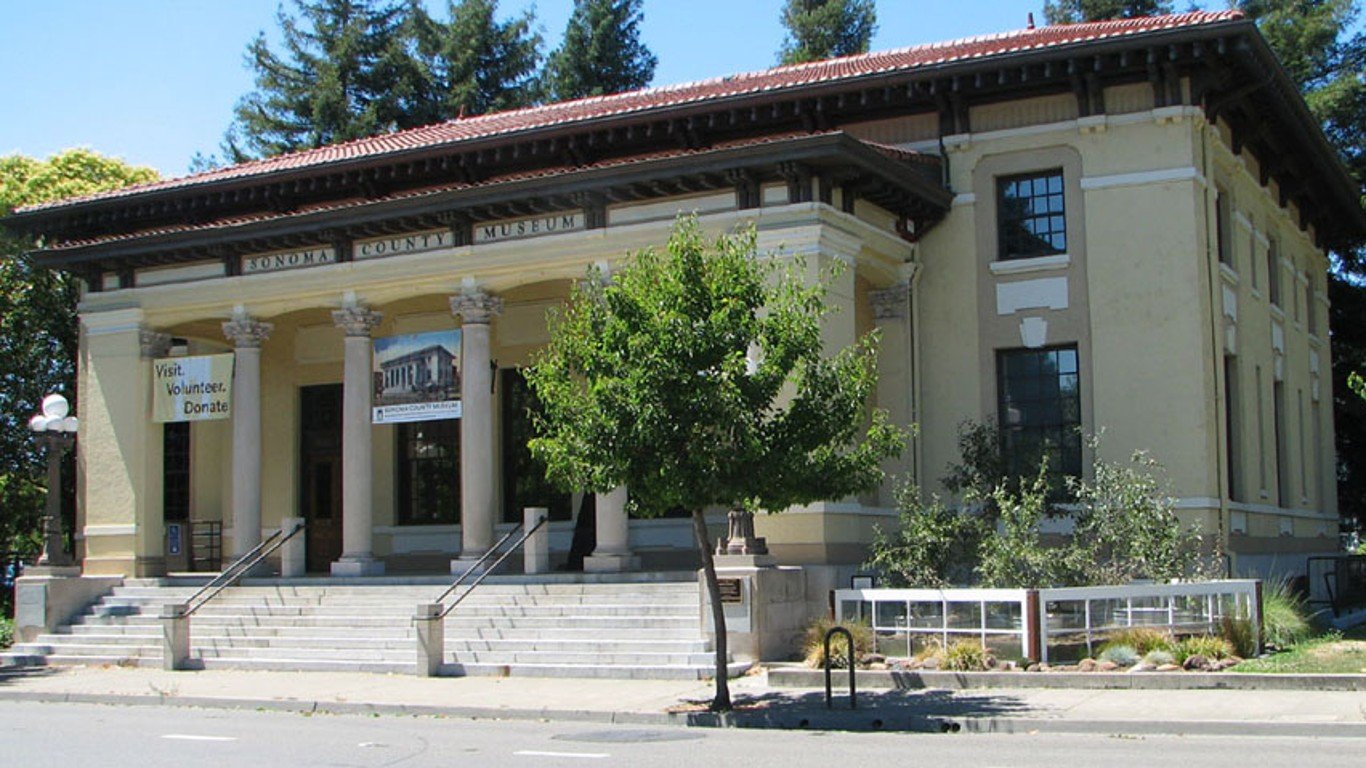
- 2017-2022 population change: -4.28% (-21,567)
- 2022 population: 482,650 — 115th highest out of 387
- 2017 population: 504,217 — 106th highest out of 387
- 2017-2022 employment change: -5.1% — 17th largest decrease out of 115
- Unemployment rate, Dec 2022: 3.0% — compared to 3.5% national
- 2018-2022 median home value change: 17.7% — compared to 39.7% nationwide
- Median home value, 2022: $771,000 — 11th highest out of 387
26. Beaumont-Port Arthur, TX

- 2017-2022 population change: -4.32% (-17,764)
- 2022 population: 393,575 — 139th highest out of 387
- 2017 population: 411,339 — 129th highest out of 387
- 2017-2022 employment change: -2.7% — 47th largest decrease out of 115
- Unemployment rate, Dec 2022: 5.7% — compared to 3.5% national
- 2018-2022 median home value change: 43.5% — compared to 39.7% nationwide
- Median home value, 2022: $176,500 — 317th highest out of 387
25. Fairbanks, AK
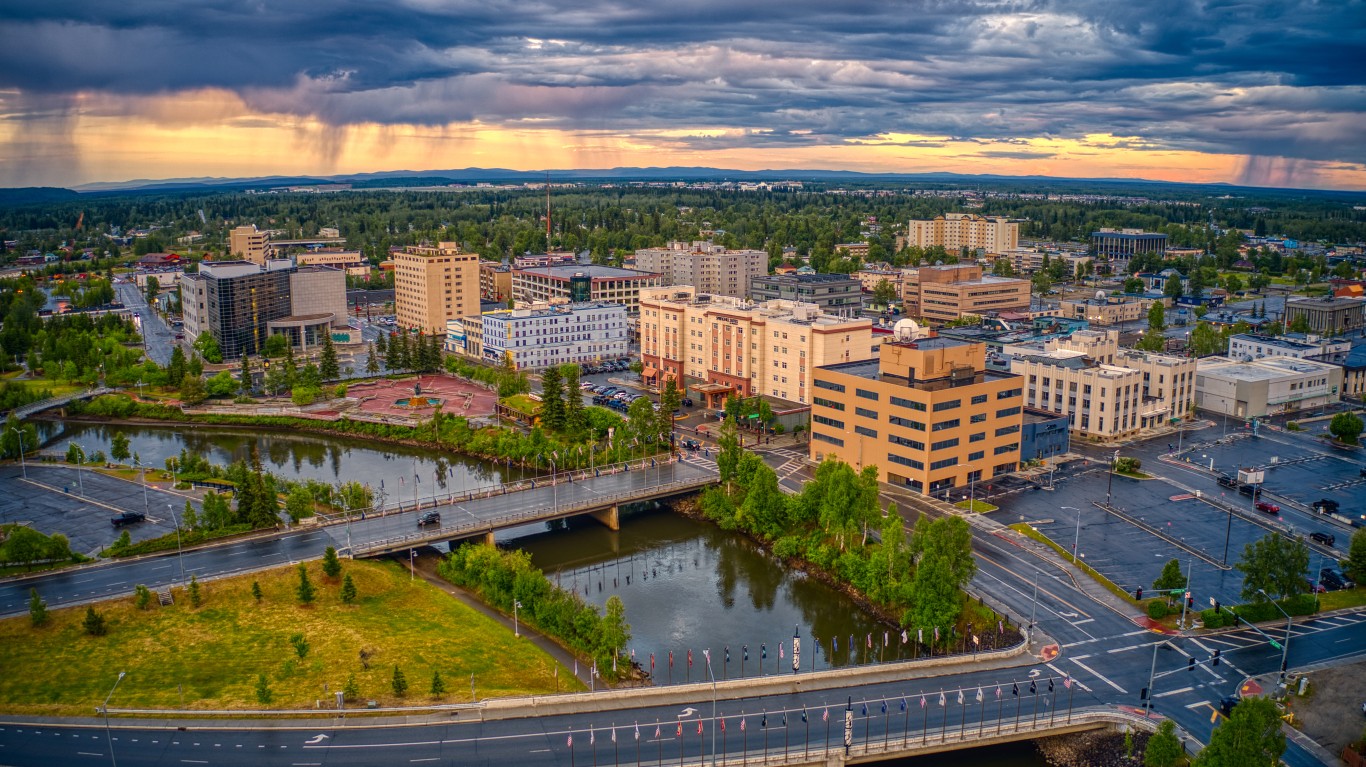
- 2017-2022 population change: -4.36% (-4,347)
- 2022 population: 95,356 — 363rd highest out of 387
- 2017 population: 99,703 — 353rd highest out of 387
- 2017-2022 employment change: +1.2% — 219th largest increase out of 257
- Unemployment rate, Dec 2022: 3.3% — compared to 3.5% national
- 2018-2022 median home value change: 18.5% — compared to 39.7% nationwide
- Median home value, 2022: $307,600 — 132nd highest out of 387
24. Walla Walla, WA
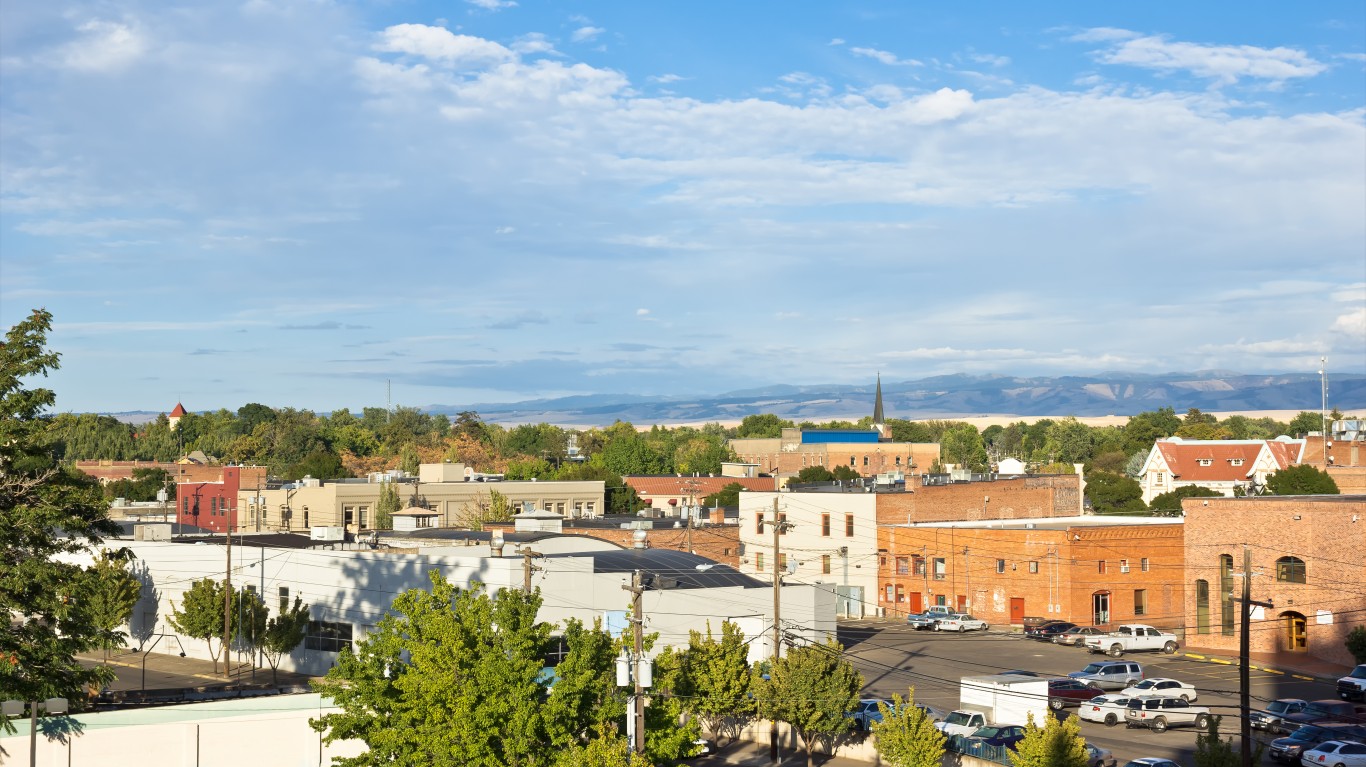
- 2017-2022 population change: -4.54% (-2,941)
- 2022 population: 61,890 — 380th highest out of 387
- 2017 population: 64,831 — 378th highest out of 387
- 2017-2022 employment change: +6.3% — 91st largest increase out of 257
- Unemployment rate, Dec 2022: 4.9% — compared to 3.5% national
- 2018-2022 median home value change: 70.8% — compared to 39.7% nationwide
- Median home value, 2022: $396,000 — 73rd highest out of 387
23. Weirton-Steubenville, WV-OH
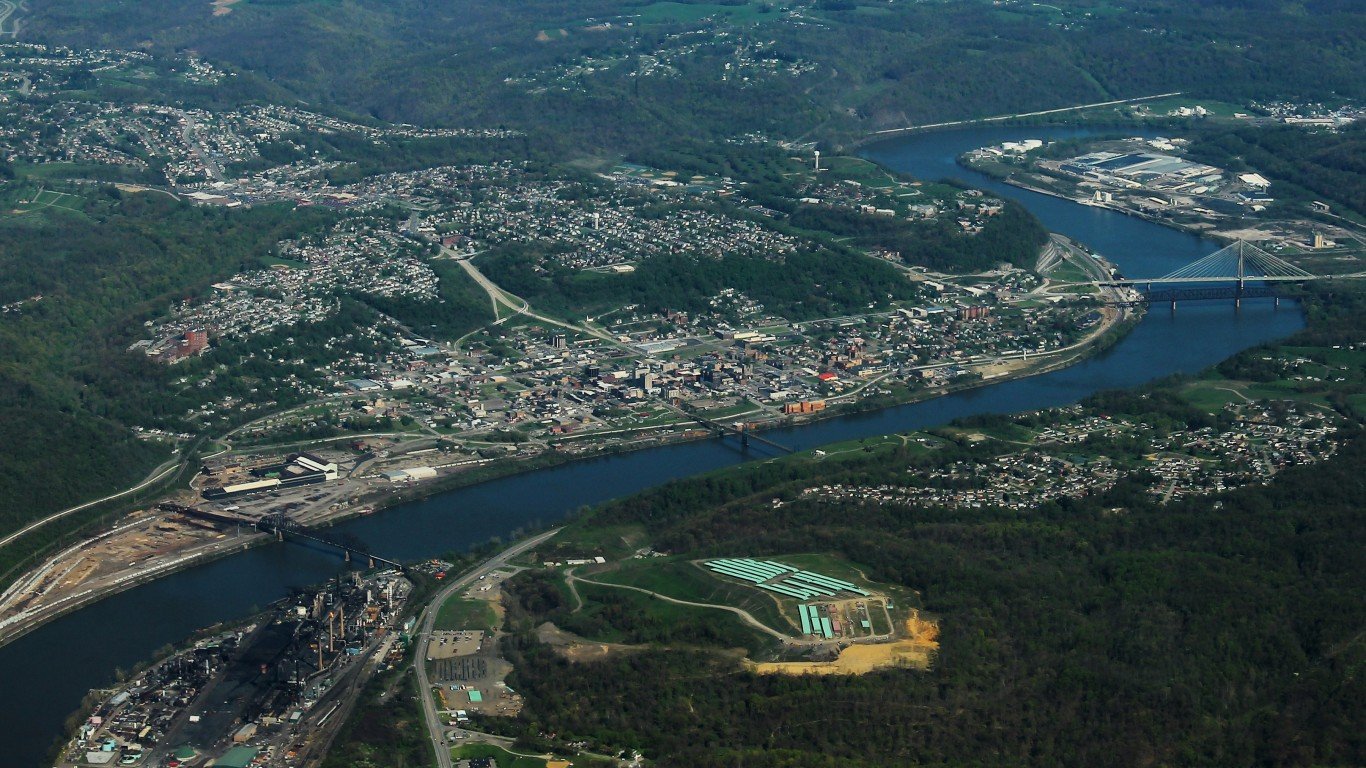
- 2017-2022 population change: -4.68% (-5,598)
- 2022 population: 114,066 — 335th highest out of 387
- 2017 population: 119,664 — 322nd highest out of 387
- 2017-2022 employment change: -0.6% — 103th largest decrease out of 115
- Unemployment rate, Dec 2022: 5.2% — compared to 3.5% national
- 2018-2022 median home value change: 41.9% — compared to 39.7% nationwide
- Median home value, 2022: $127,400 — 376th highest out of 387
22. Houma-Thibodaux, LA
- 2017-2022 population change: -4.68% (-9,856)
- 2022 population: 200,656 — 223th highest out of 387
- 2017 population: 210,512 — 210th highest out of 387
- 2017-2022 employment change: -2.9% — 43rd largest decrease out of 115
- Unemployment rate, Dec 2022: 3.5% — compared to 3.5% national
- 2018-2022 median home value change: 19.3% — compared to 39.7% nationwide
- Median home value, 2022: $182,600 — 307th highest out of 387
21. Napa, CA
- 2017-2022 population change: -4.73% (-6,673)
- 2022 population: 134,300 — 305th highest out of 387
- 2017 population: 140,973 — 288th highest out of 387
- 2017-2022 employment change: -2.3% — 58th largest decrease out of 115
- Unemployment rate, Dec 2022: 3.0% — compared to 3.5% national
- 2018-2022 median home value change: 30.3% — compared to 39.7% nationwide
- Median home value, 2022: $866,300 — 6th highest out of 387
20. Cumberland, MD-WV
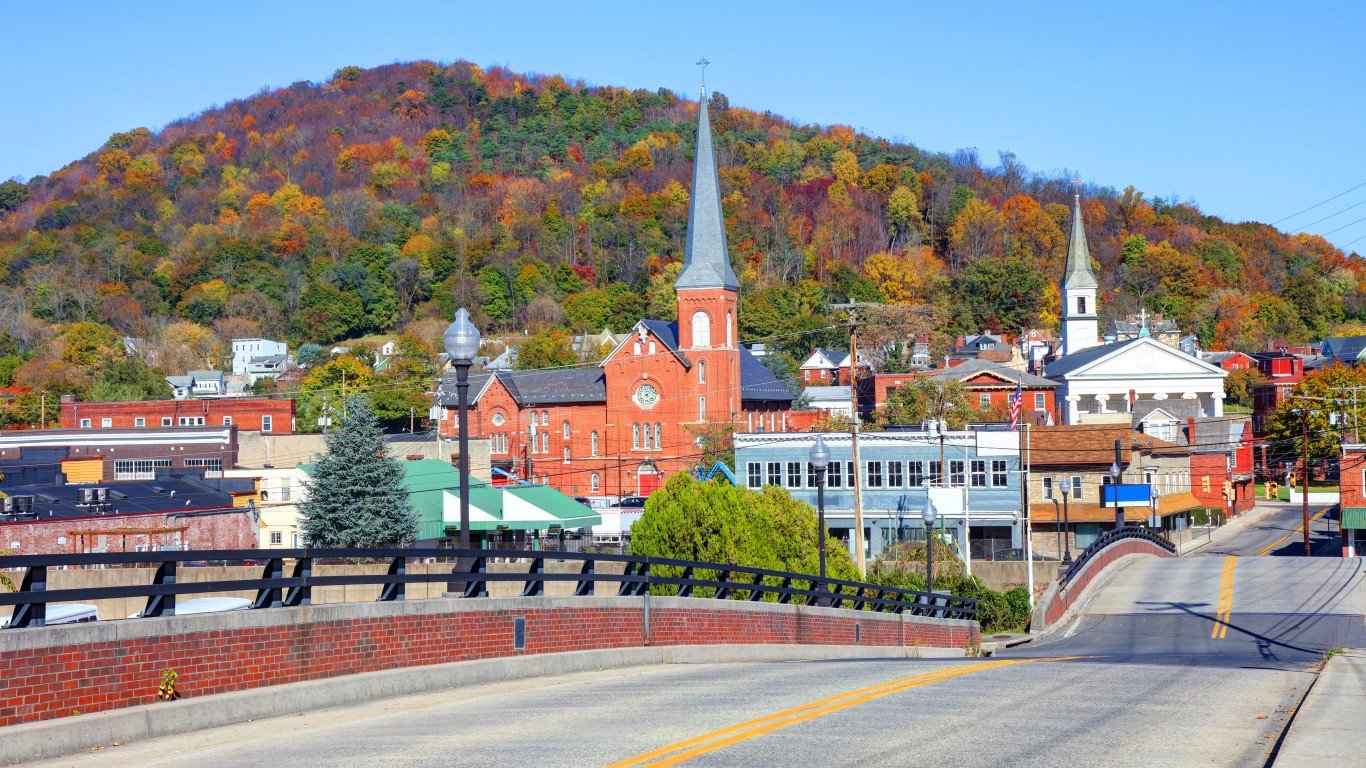
- 2017-2022 population change: -4.77% (-4,715)
- 2022 population: 94,122 — 364th highest out of 387
- 2017 population: 98,837 — 354th highest out of 387
- 2017-2022 employment change: -1.4% — 84th largest decrease out of 115
- Unemployment rate, Dec 2022: 3.9% — compared to 3.5% national
- 2018-2022 median home value change: 29.5% — compared to 39.7% nationwide
- Median home value, 2022: $154,900 — 357th highest out of 387
19. Elmira, NY
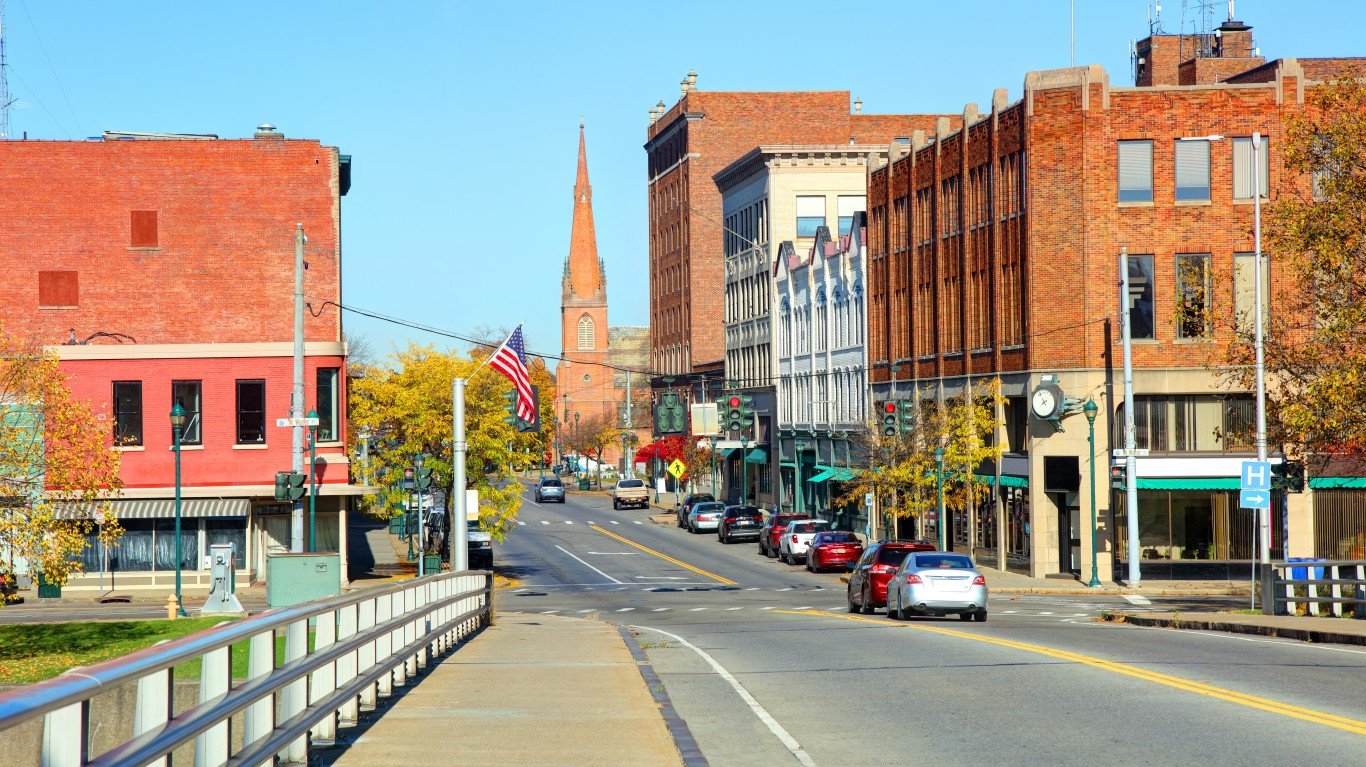
- 2017-2022 population change: -4.83% (-4,131)
- 2022 population: 81,426 — 374th highest out of 387
- 2017 population: 85,557 — 368th highest out of 387
- 2017-2022 employment change: -2.6% — 48th largest decrease out of 115
- Unemployment rate, Dec 2022: 3.8% — compared to 3.5% national
- 2018-2022 median home value change: 24.1% — compared to 39.7% nationwide
- Median home value, 2022: $130,700 — 374th highest out of 387
18. Farmington, NM
- 2017-2022 population change: -5.13% (-6,508)
- 2022 population: 120,418 — 325th highest out of 387
- 2017 population: 126,926 — 307th highest out of 387
- 2017-2022 employment change: -5.5% — 10th largest decrease out of 115
- Unemployment rate, Dec 2022: 4.0% — compared to 3.5% national
- 2018-2022 median home value change: 23.7% — compared to 39.7% nationwide
- Median home value, 2022: $185,000 — 303rd highest out of 387
17. Texarkana, TX-AR
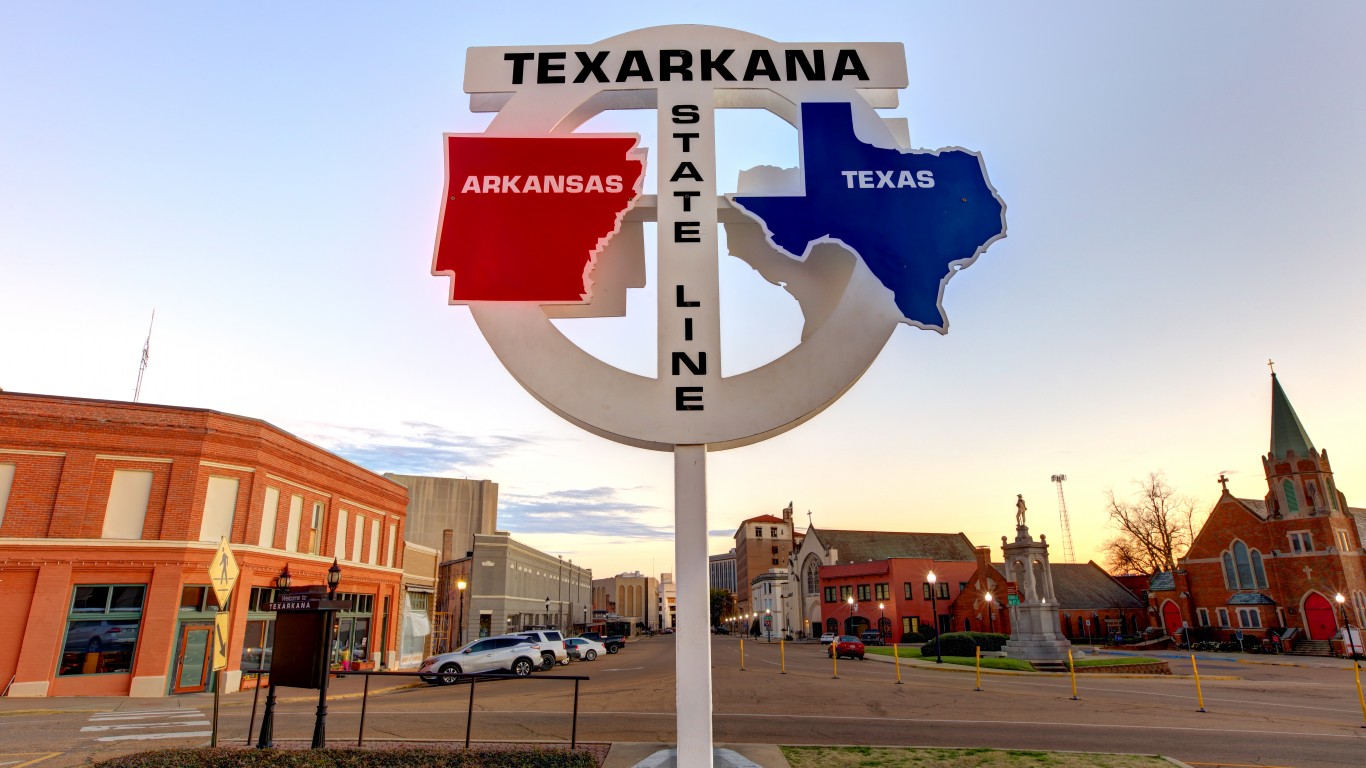
- 2017-2022 population change: -5.17% (-7,866)
- 2022 population: 144,322 — 290th highest out of 387
- 2017 population: 152,188 — 267th highest out of 387
- 2017-2022 employment change: -2.1% — 63rd largest decrease out of 115
- Unemployment rate, Dec 2022: 4.2% — compared to 3.5% national
- 2018-2022 median home value change: 46.8% — compared to 39.7% nationwide
- Median home value, 2022: $162,800 — 344th highest out of 387
16. Beckley, WV

- 2017-2022 population change: -5.21% (-6,174)
- 2022 population: 112,369 — 338th highest out of 387
- 2017 population: 118,543 — 325th highest out of 387
- 2017-2022 employment change: +0.7% — 230th largest increase out of 257
- Unemployment rate, Dec 2022: 4.1% — compared to 3.5% national
- 2018-2022 median home value change: 34.2% — compared to 39.7% nationwide
- Median home value, 2022: $131,500 — 373rd highest out of 387
15. Goldsboro, NC
- 2017-2022 population change: -5.55% (-6,886)
- 2022 population: 117,286 — 331st highest out of 387
- 2017 population: 124,172 — 316th highest out of 387
- 2017-2022 employment change: -2.5% — 51st largest decrease out of 115
- Unemployment rate, Dec 2022: 4.0% — compared to 3.5% national
- 2018-2022 median home value change: 25.4% — compared to 39.7% nationwide
- Median home value, 2022: $166,400 — 336th highest out of 387
14. St. Joseph, MO-KS

- 2017-2022 population change: -5.88% (-7,473)
- 2022 population: 119,619 — 328th highest out of 387
- 2017 population: 127,092 — 306th highest out of 387
- 2017-2022 employment change: -5.4% — 12th largest decrease out of 115
- Unemployment rate, Dec 2022: 2.4% — compared to 3.5% national
- 2018-2022 median home value change: 25.7% — compared to 39.7% nationwide
- Median home value, 2022: $165,600 — 341st highest out of 387
13. Pine Bluff, AR
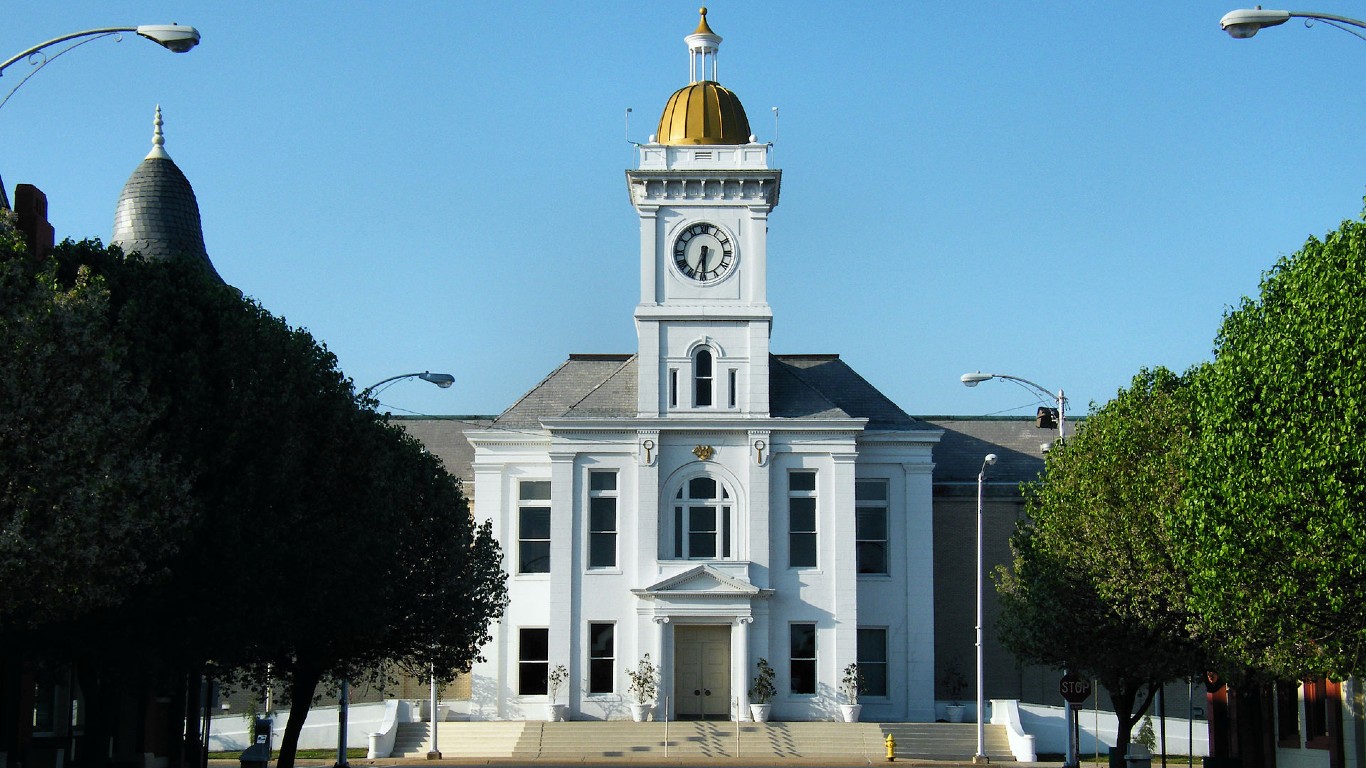
- 2017-2022 population change: -6.15% (-5,538)
- 2022 population: 84,460 — 369th highest out of 387
- 2017 population: 89,998 — 365th highest out of 387
- 2017-2022 employment change: -8.3% — 7th largest decrease out of 115
- Unemployment rate, Dec 2022: 5.0% — compared to 3.5% national
- 2018-2022 median home value change: 23.5% — compared to 39.7% nationwide
- Median home value, 2022: $104,100 — 380th highest out of 387
12. Corpus Christi, TX
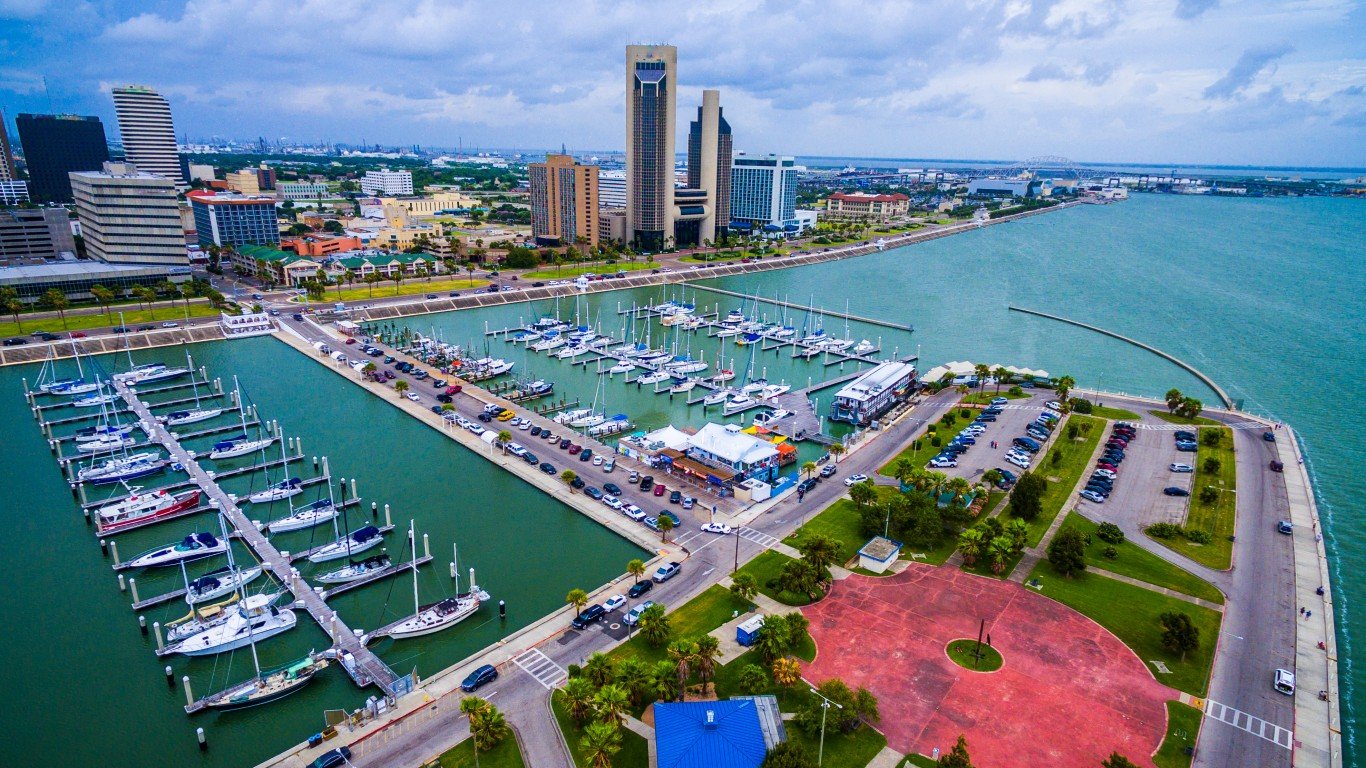
- 2017-2022 population change: -6.27% (-28,202)
- 2022 population: 421,628 — 130th highest out of 387
- 2017 population: 449,830 — 117th highest out of 387
- 2017-2022 employment change: -1.0% — 94th largest decrease out of 115
- Unemployment rate, Dec 2022: 4.6% — compared to 3.5% national
- 2018-2022 median home value change: 40.8% — compared to 39.7% nationwide
- Median home value, 2022: $198,800 — 275th highest out of 387
11. Danville, IL
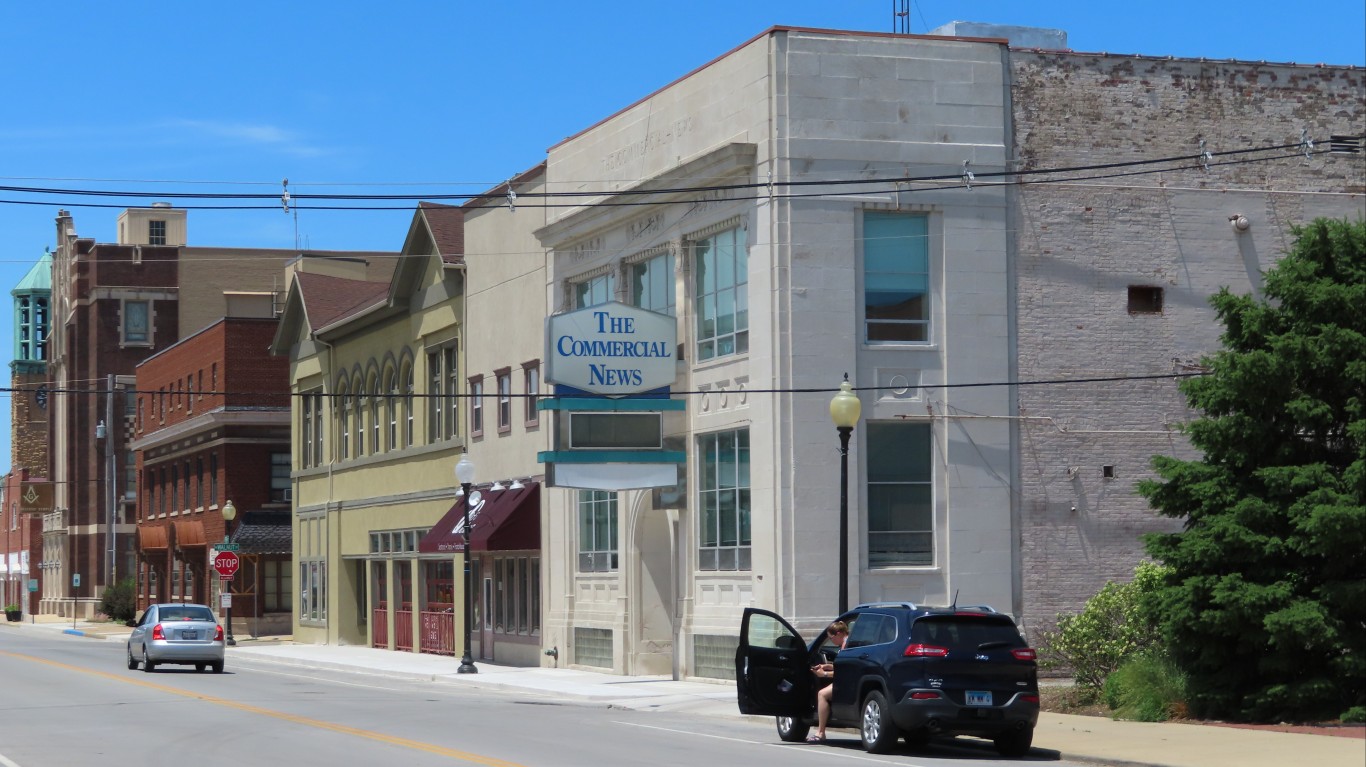
- 2017-2022 population change: -7.15% (-5,572)
- 2022 population: 72,337 — 377th highest out of 387
- 2017 population: 77,909 — 377th highest out of 387
- 2017-2022 employment change: -4.2% — 24th largest decrease out of 115
- Unemployment rate, Dec 2022: 4.7% — compared to 3.5% national
- 2018-2022 median home value change: 10.2% — compared to 39.7% nationwide
- Median home value, 2022: $93,700 — 381st highest out of 387
10. Champaign-Urbana, IL
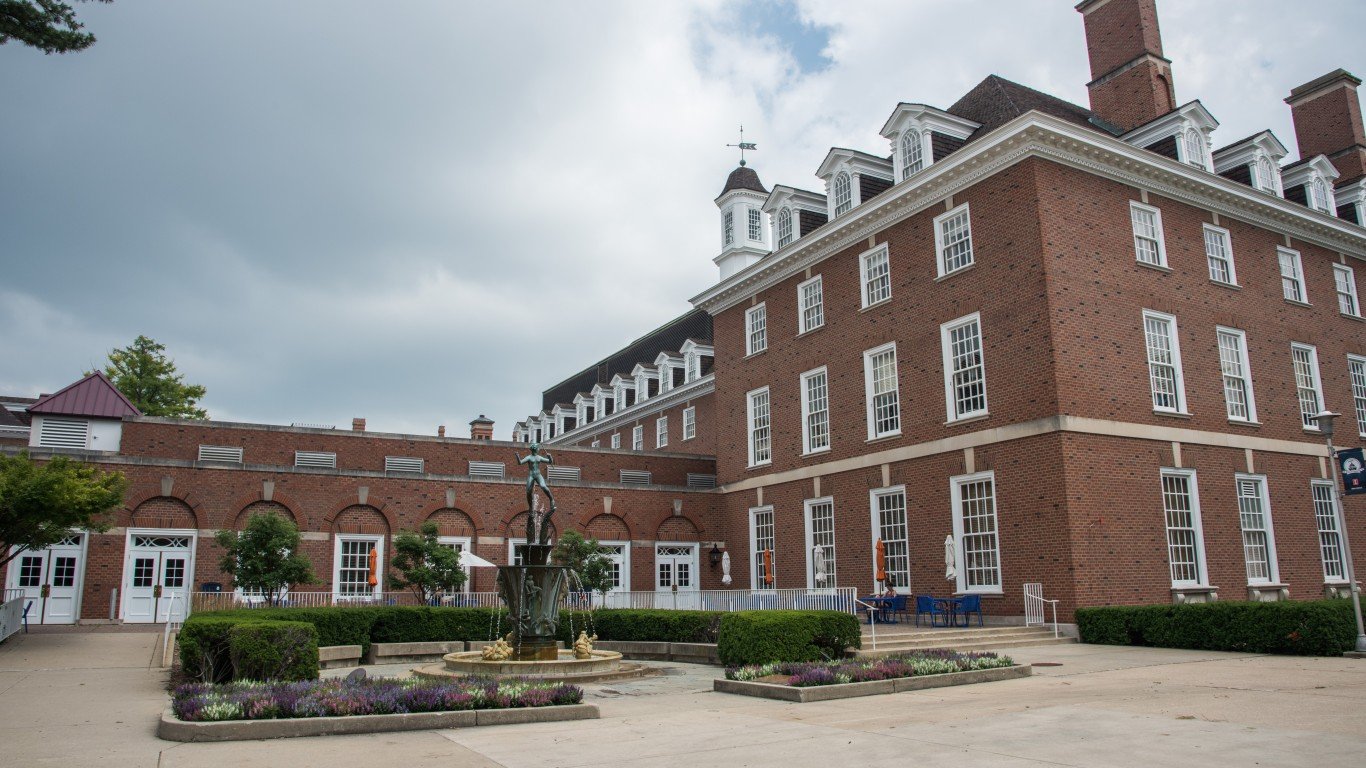
- 2017-2022 population change: -7.36% (-17,735)
- 2022 population: 223,265 — 206th highest out of 387
- 2017 population: 241,000 — 191st highest out of 387
- 2017-2022 employment change: +2.1% — 191st largest increase out of 257
- Unemployment rate, Dec 2022: 3.5% — compared to 3.5% national
- 2018-2022 median home value change: 20.6% — compared to 39.7% nationwide
- Median home value, 2022: $193,700 — 286th highest out of 387
9. Blacksburg-Christiansburg, VA
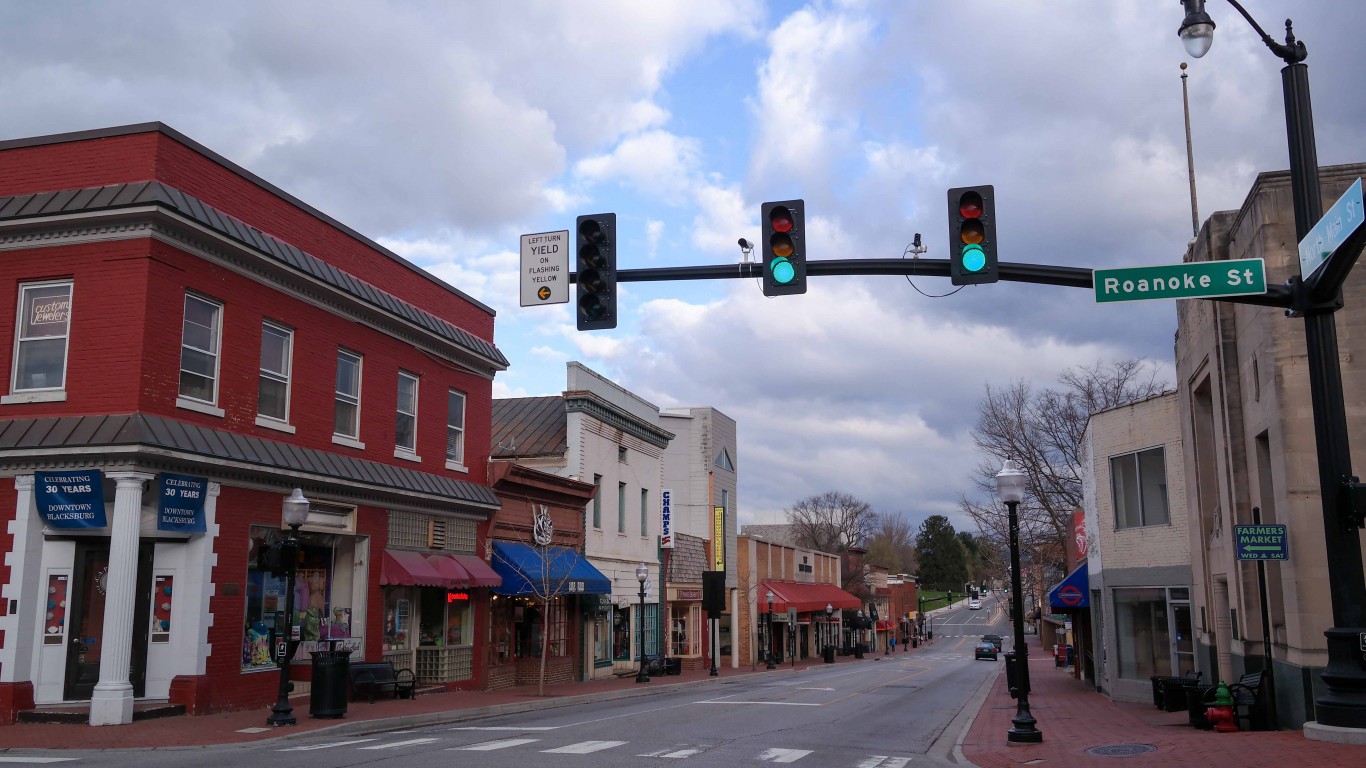
- 2017-2022 population change: -7.94% (-14,452)
- 2022 population: 167,534 — 254th highest out of 387
- 2017 population: 181,986 — 229th highest out of 387
- 2017-2022 employment change: +5.6% — 97th largest increase out of 257
- Unemployment rate, Dec 2022: 3.1% — compared to 3.5% national
- 2018-2022 median home value change: 39.9% — compared to 39.7% nationwide
- Median home value, 2022: $256,400 — 183rd highest out of 387
8. Bloomington, IL
- 2017-2022 population change: -8.16% (-15,215)
- 2022 population: 171,141 — 250th highest out of 387
- 2017 population: 186,356 — 226th highest out of 387
- 2017-2022 employment change: +0.2% — 247th largest increase out of 257
- Unemployment rate, Dec 2022: 3.3% — compared to 3.5% national
- 2018-2022 median home value change: 13.6% — compared to 39.7% nationwide
- Median home value, 2022: $190,900 — 290th highest out of 387
7. Panama City, FL
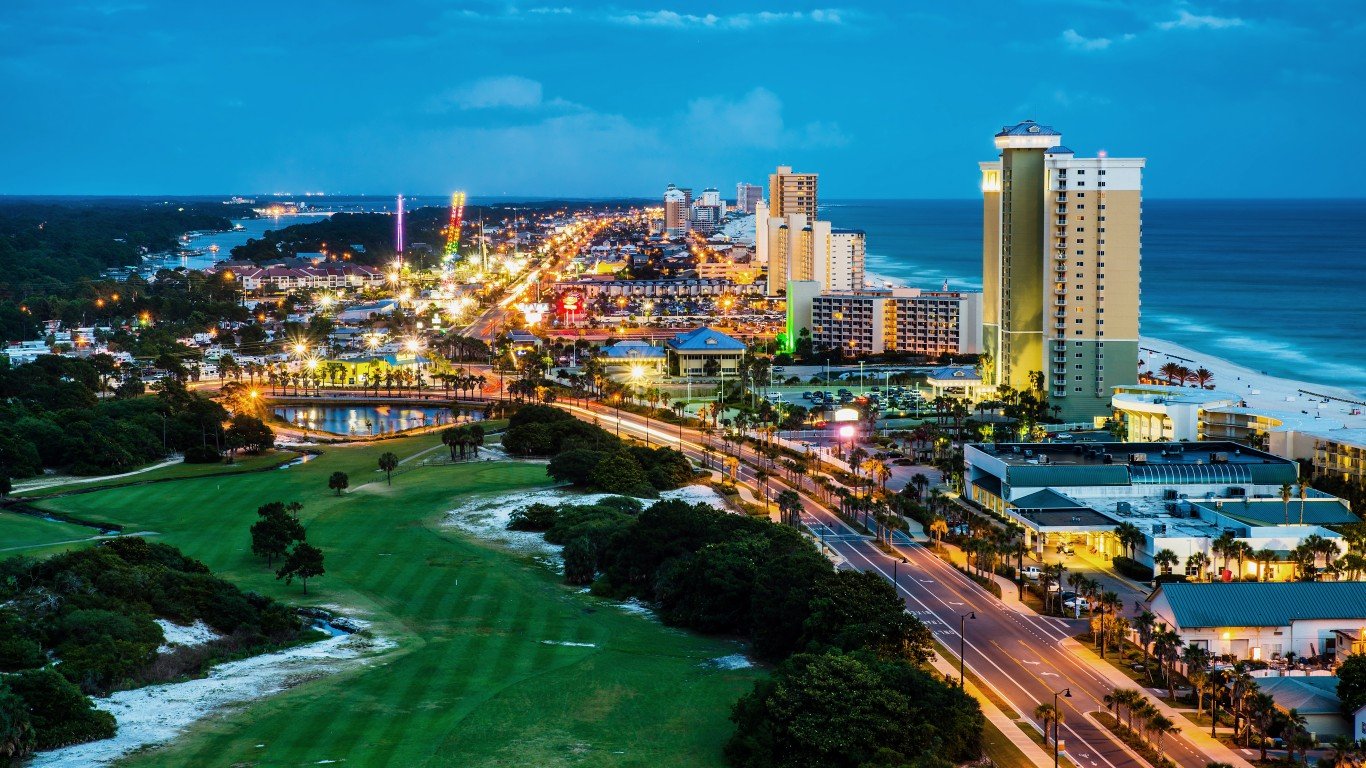
- 2017-2022 population change: -8.46% (-17,102)
- 2022 population: 185,134 — 231st highest out of 387
- 2017 population: 202,236 — 218th highest out of 387
- 2017-2022 employment change: +2.2% — 187th largest increase out of 257
- Unemployment rate, Dec 2022: 2.4% — compared to 3.5% national
- 2018-2022 median home value change: 78.7% — compared to 39.7% nationwide
- Median home value, 2022: $312,800 — 124th highest out of 387
6. Chico, CA
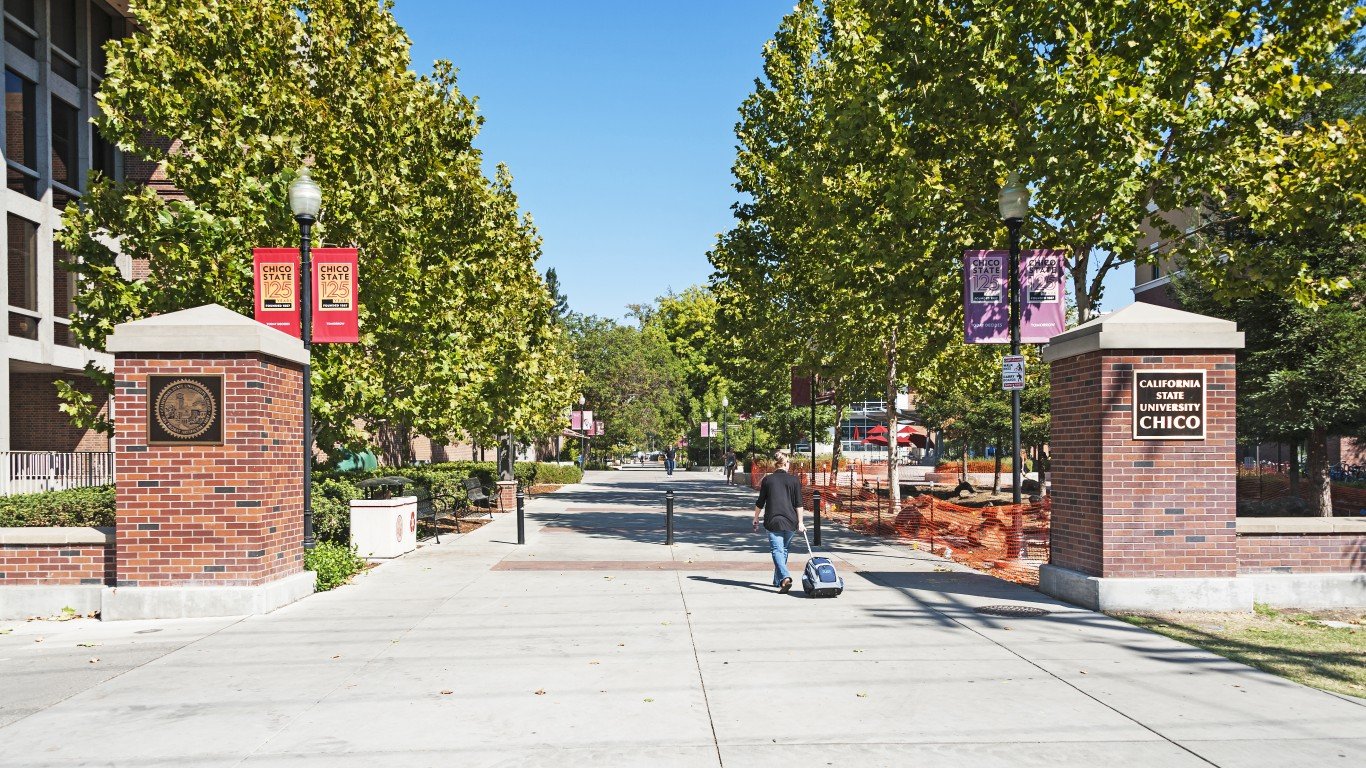
- 2017-2022 population change: -9.59% (-21,991)
- 2022 population: 207,303 — 214th highest out of 387
- 2017 population: 229,294 — 195th highest out of 387
- 2017-2022 employment change: -8.4% — 5th largest decrease out of 115
- Unemployment rate, Dec 2022: 4.6% — compared to 3.5% national
- 2018-2022 median home value change: 50.5% — compared to 39.7% nationwide
- Median home value, 2022: $412,700 — 64th highest out of 387
5. Sioux City, IA-NE-SD
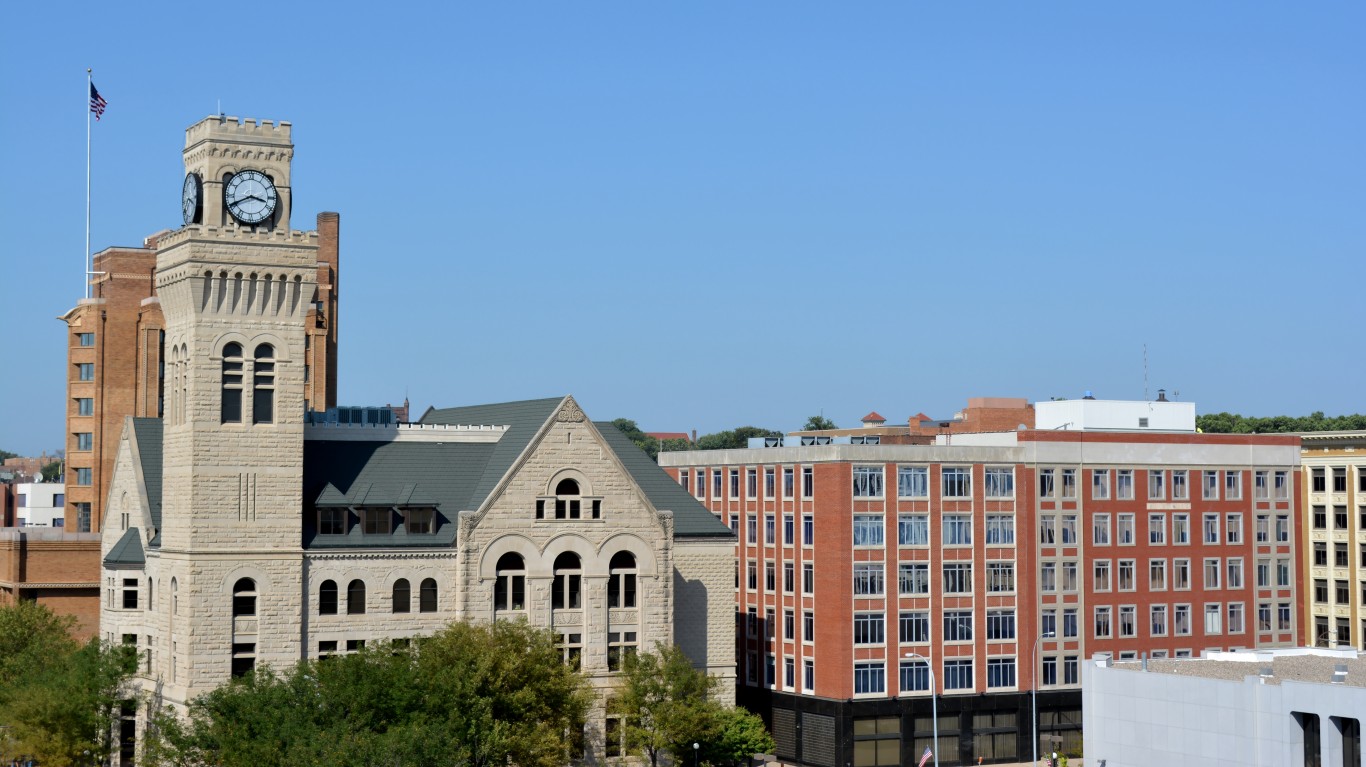
- 2017-2022 population change: -10.60% (-17,924)
- 2022 population: 151,207 — 281st highest out of 387
- 2017 population: 169,131 — 246th highest out of 387
- 2017-2022 employment change: +2.9% — 166th largest increase out of 257
- Unemployment rate, Dec 2022: 2.8% — compared to 3.5% national
- 2018-2022 median home value change: 33.3% — compared to 39.7% nationwide
- Median home value, 2022: $187,200 — 299th highest out of 387
4. Grand Island, NE
- 2017-2022 population change: -11.17% (-9,603)
- 2022 population: 76,333 — 376th highest out of 387
- 2017 population: 85,936 — 367th highest out of 387
- 2017-2022 employment change: +4.3% — 126th largest increase out of 257
- Unemployment rate, Dec 2022: 2.5% — compared to 3.5% national
- 2018-2022 median home value change: 61.4% — compared to 39.7% nationwide
- Median home value, 2022: $232,800 — 217th highest out of 387
3. Fort Smith, AR-OK
- 2017-2022 population change: -12.53% (-35,335)
- 2022 population: 246,751 — 191st highest out of 387
- 2017 population: 282,086 — 169th highest out of 387
- 2017-2022 employment change: -0.5% — 108th largest decrease out of 115
- Unemployment rate, Dec 2022: 3.3% — compared to 3.5% national
- 2018-2022 median home value change: 39.2% — compared to 39.7% nationwide
- Median home value, 2022: $167,000 — 335th highest out of 387
2. Shreveport-Bossier City, LA
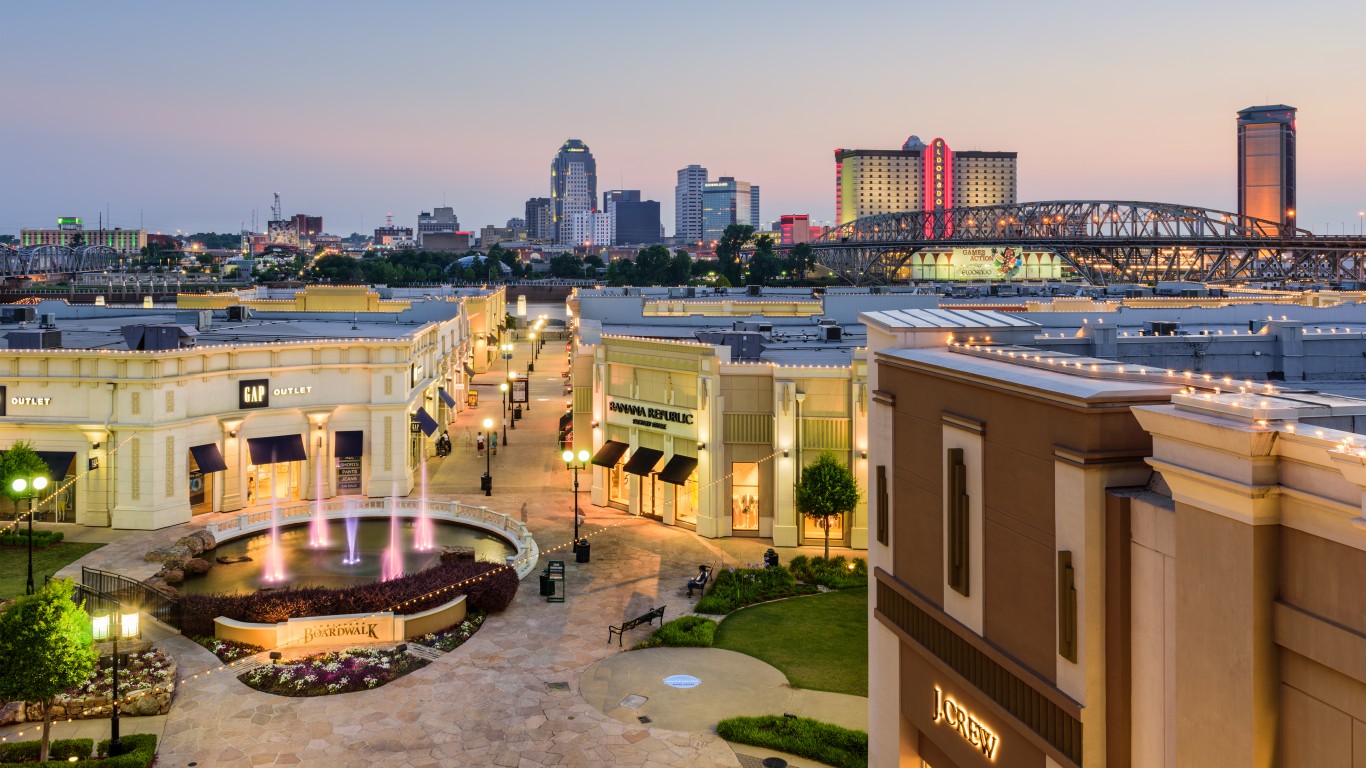
- 2017-2022 population change: -12.65% (-55,779)
- 2022 population: 385,154 — 142nd highest out of 387
- 2017 population: 440,933 — 122nd highest out of 387
- 2017-2022 employment change: -0.6% — 102nd largest decrease out of 115
- Unemployment rate, Dec 2022: 3.7% — compared to 3.5% national
- 2018-2022 median home value change: 29.0% — compared to 39.7% nationwide
- Median home value, 2022: $184,000 — 304th highest out of 387
1. Kalamazoo-Portage, MI

- 2017-2022 population change: -22.81% (-77,165)
- 2022 population: 261,173 — 187th highest out of 387
- 2017 population: 338,338 — 150th highest out of 387
- 2017-2022 employment change: -1.8% — 72nd largest decrease out of 115
- Unemployment rate, Dec 2022: 4.3% — compared to 3.5% national
- 2018-2022 median home value change: 47.6% — compared to 39.7% nationwide
- Median home value, 2022: $236,300 — 213th highest out of 387
Want to Retire Early? Start Here (Sponsor)
Want retirement to come a few years earlier than you’d planned? Or are you ready to retire now, but want an extra set of eyes on your finances?
Now you can speak with up to 3 financial experts in your area for FREE. By simply clicking here you can begin to match with financial professionals who can help you build your plan to retire early. And the best part? The first conversation with them is free.
Click here to match with up to 3 financial pros who would be excited to help you make financial decisions.
The post This Swing State City Lost Nearly 25% of Its Population in Just 5 Years appeared first on 24/7 Wall St..