To determine the fastest-growing large cities across the United States, 24/7 Wall St. reviewed population data from the U.S. Census Bureau’s 2022 American Community Survey one-year estimates. We listed all 50 metropolitan statistical areas with at least a 10% population growth from 2017 to 2022 in order from smallest to largest growth. Supplemental data on employment in December 2017 and December 2022, as well as unemployment rates, came from the Bureau of Labor Statistics, and are seasonally-adjusted figures. Home value data came from the ACS.
People may choose to move to a new city or area for many reasons. But one of the leading reasons is the opportunity to find cheaper housing. Out of the 50 cities on the list, 30 have lower home values than the national median home value in 2022 of $320,900. Although in 37 of the cities, the median home value grew at a faster pace than the national average. Another factor is unemployment and access to jobs. Out of the 49 cities with data, 34 have lower unemployment than the national rate of 3.5%. (You can buy most homes in these 23 cities for under $125,000.)
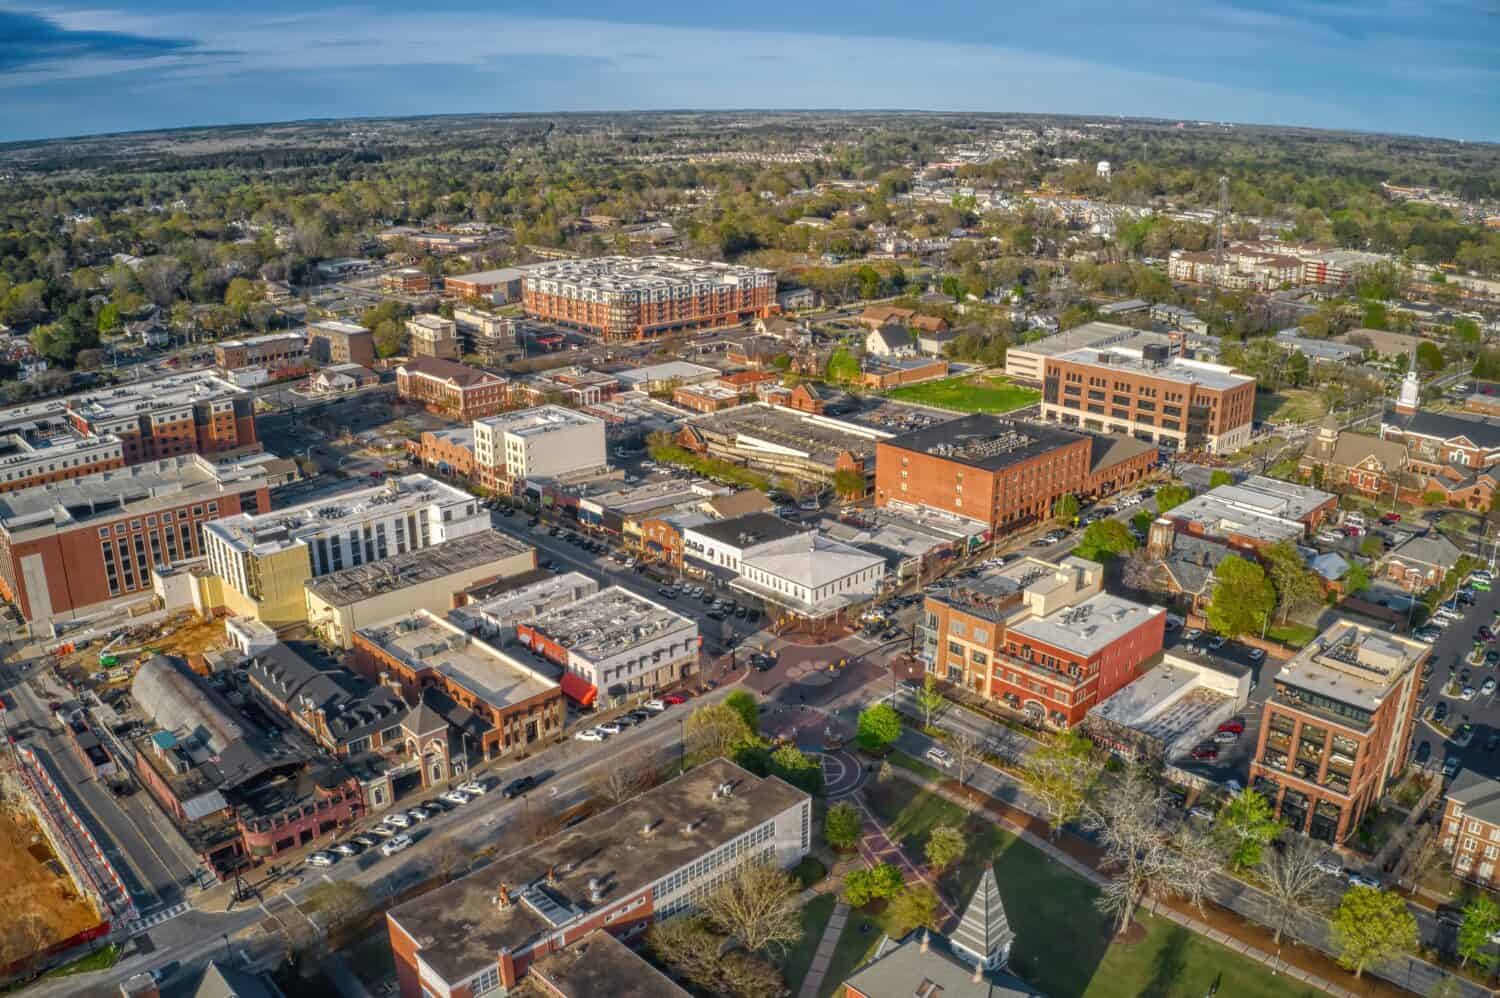
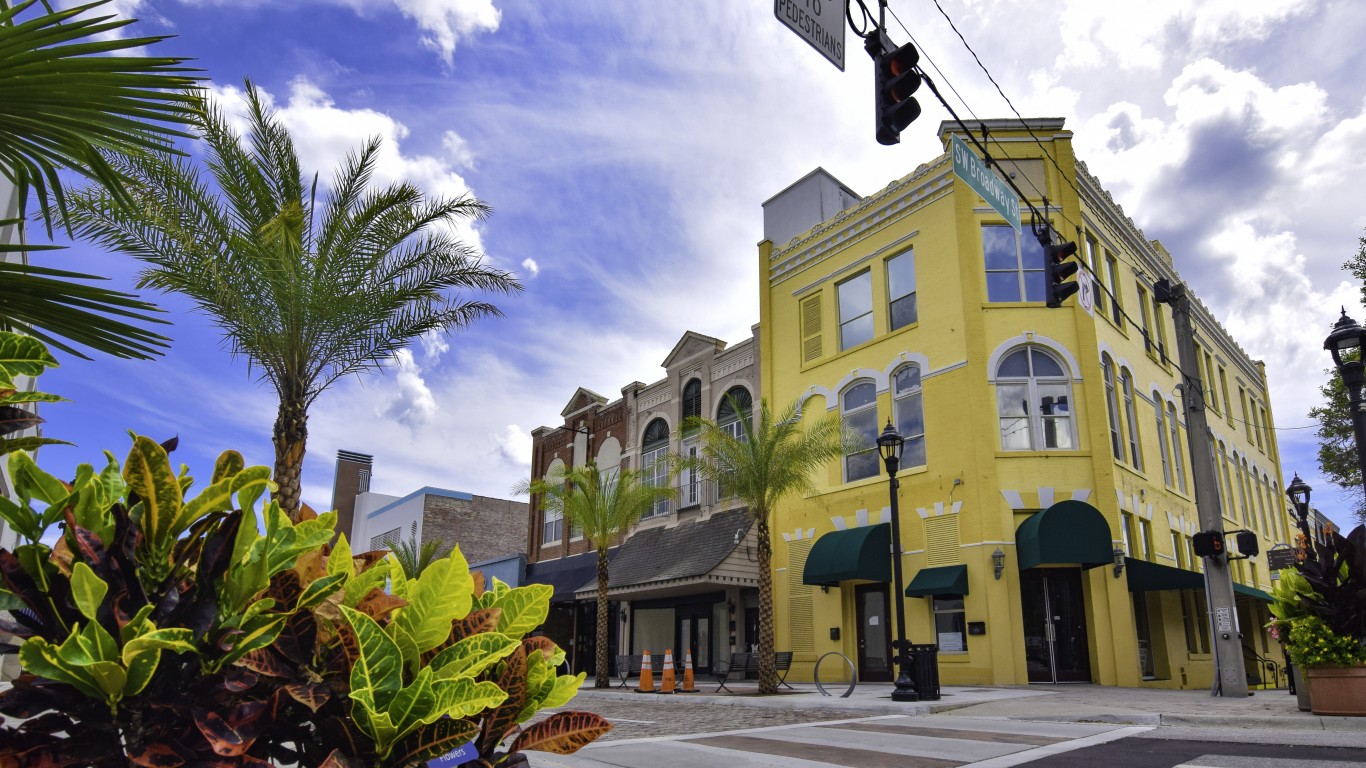
The cities on the list include some large metropolitan areas such as the Orlando metro area, the Austin metro area, the Raleigh, North Carolina, metro area, and the Jacksonville, Florida metro area. The South has the most cities on the list at 33, including 12 in Florida and four in Alabama. The West region has 10 cities on the list, including four in Idaho. Six of the cities on the list are in the Midwest, and only one is in the Northeast. Now read on to see if you live in any of the fastest-growing cities nationwide.
Why This Matters
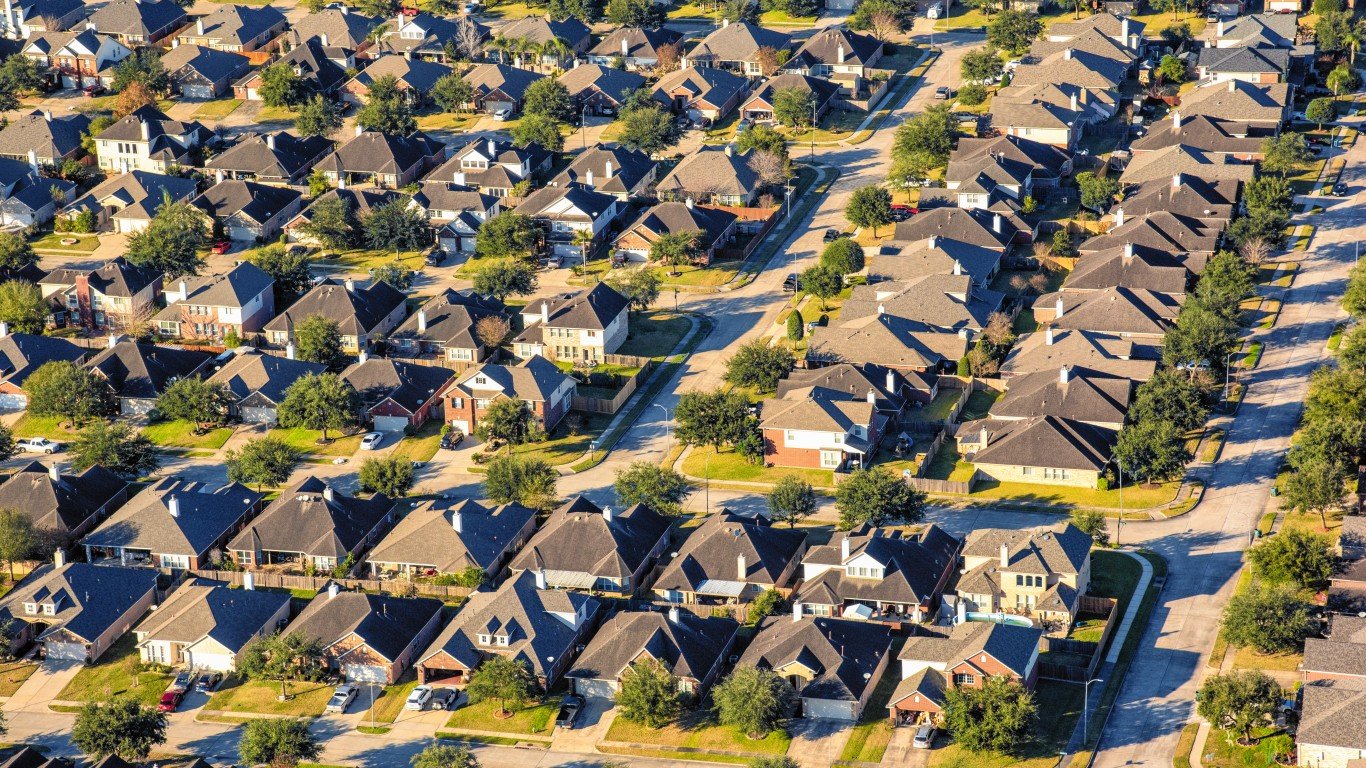
Areas with growing populations are likely to have strong job markets and less unemployment. These thriving cities provide better economic stability for residents while their growing infrastructure provides housing, schools, and services. While these cities attract people looking for jobs and business opportunities, the increased population leads to rapid expansion of the area, making them ideal for families and those looking for improved economic opportunities.
Here are the fastest-growing large cities in America:
50. Springfield, MA

- 2017-2022 pop. growth: 10.0% (62,871)
- 2022 population: 694,523 — #86 highest out of 387
- 2017 population: 631,652 — #89 highest out of 387
- 2017-2022 employment change: N/A
- Unemployment rate, Dec 2022: N/A — compared to 3.5% national
- 2018-2022 median home value change: 27.4% — compared to 39.7% nationwide
- Median home value, 2022: $302,600 — #136 highest out of 387
49. Port St. Lucie, FL
- 2017-2022 pop. growth: 10.0% (47,281)
- 2022 population: 520,710 — #109 highest out of 387
- 2017 population: 473,429 — #110 highest out of 387
- 2017-2022 employment change: +12.6% — #18 largest increase of 257
- Unemployment rate, Dec 2022: 2.9% — compared to 3.5% national
- 2018-2022 median home value change: 55.9% — compared to 39.7% nationwide
- Median home value, 2022: $363,600 — #87 highest out of 387
48. Orlando-Kissimmee-Sanford, FL
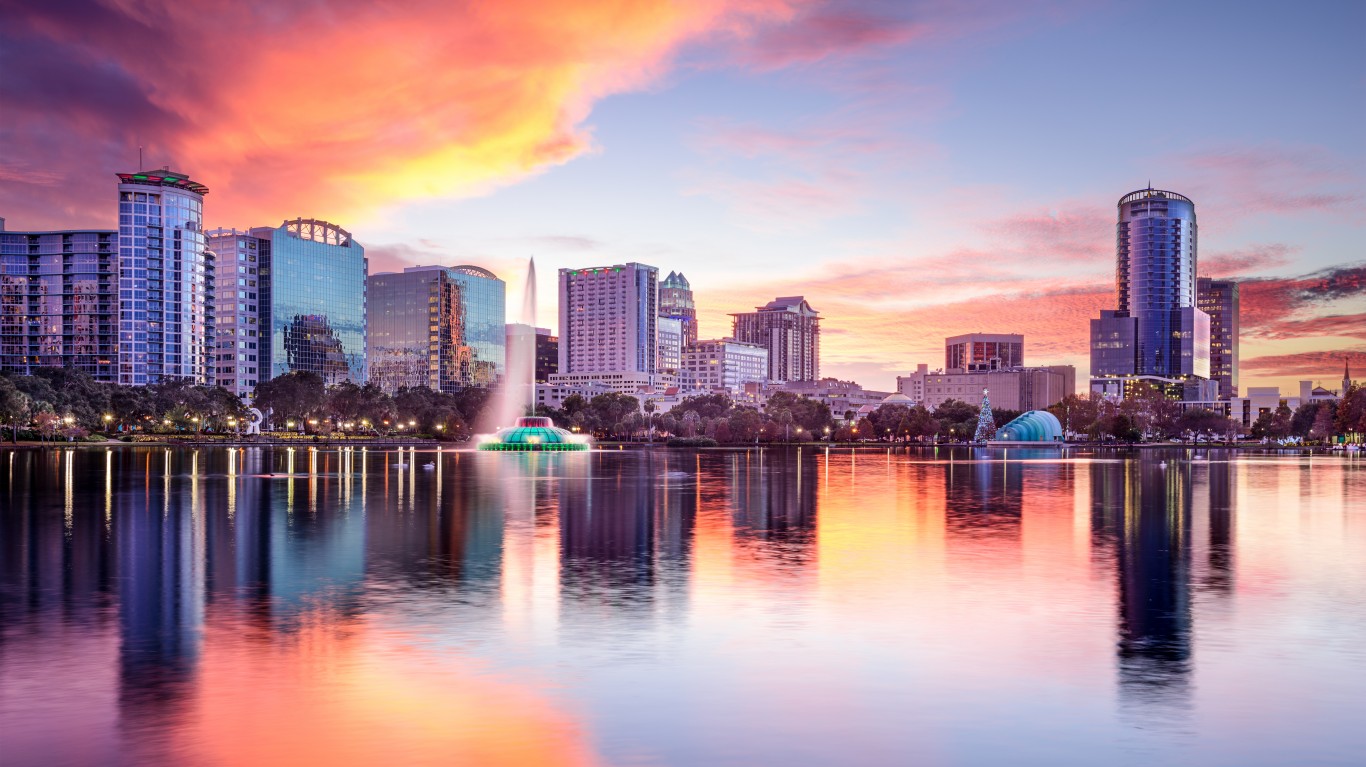
- 2017-2022 pop. growth: 10.1% (254,351)
- 2022 population: 2,764,182 — #22 highest out of 387
- 2017 population: 2,509,831 — #23 highest out of 387
- 2017-2022 employment change: +11.5% — #27 largest increase of 257
- Unemployment rate, Dec 2022: 2.6% — compared to 3.5% national
- 2018-2022 median home value change: 48.9% — compared to 39.7% nationwide
- Median home value, 2022: $361,100 — #91 highest out of 387
47. Crestview-Fort Walton Beach-Destin, FL
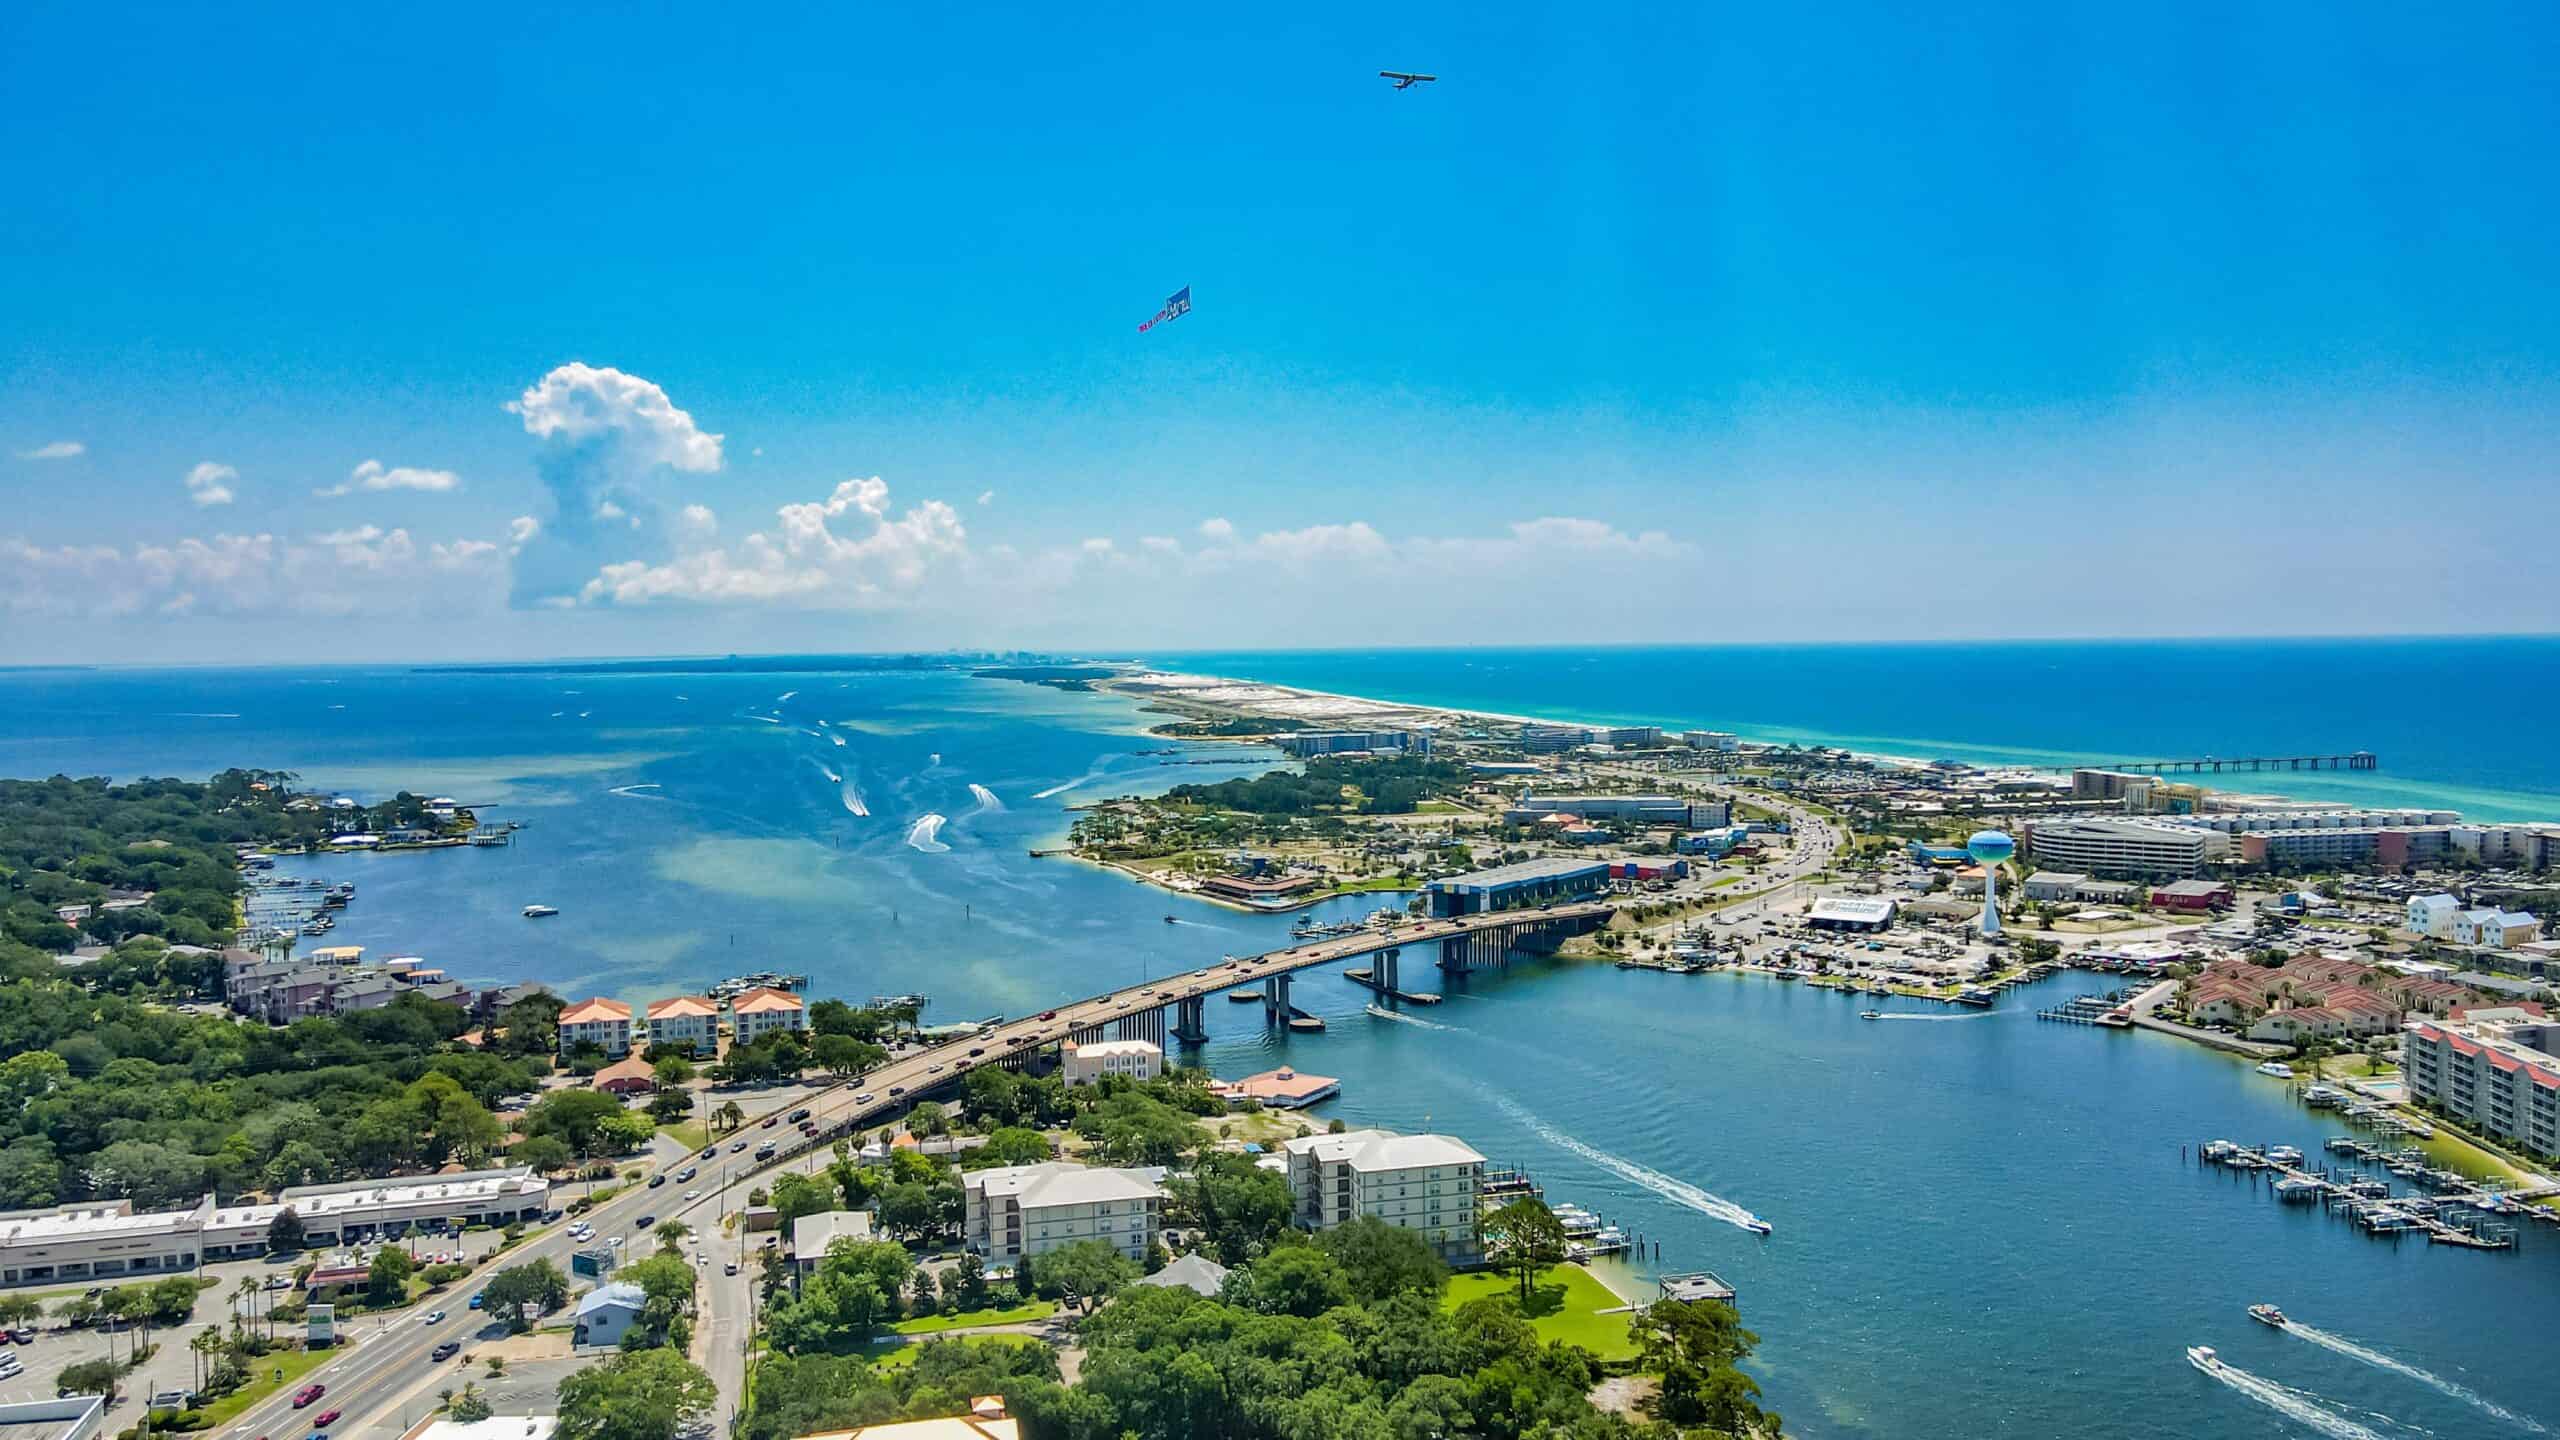
- 2017-2022 pop. growth: 10.5% (28,440)
- 2022 population: 299,786 — #167 highest out of 387
- 2017 population: 271,346 — #176 highest out of 387
- 2017-2022 employment change: +13.2% — #16 largest increase of 257
- Unemployment rate, Dec 2022: 2.3% — compared to 3.5% national
- 2018-2022 median home value change: 50.4% — compared to 39.7% nationwide
- Median home value, 2022: $358,800 — #93 highest out of 387
46. Bend, OR
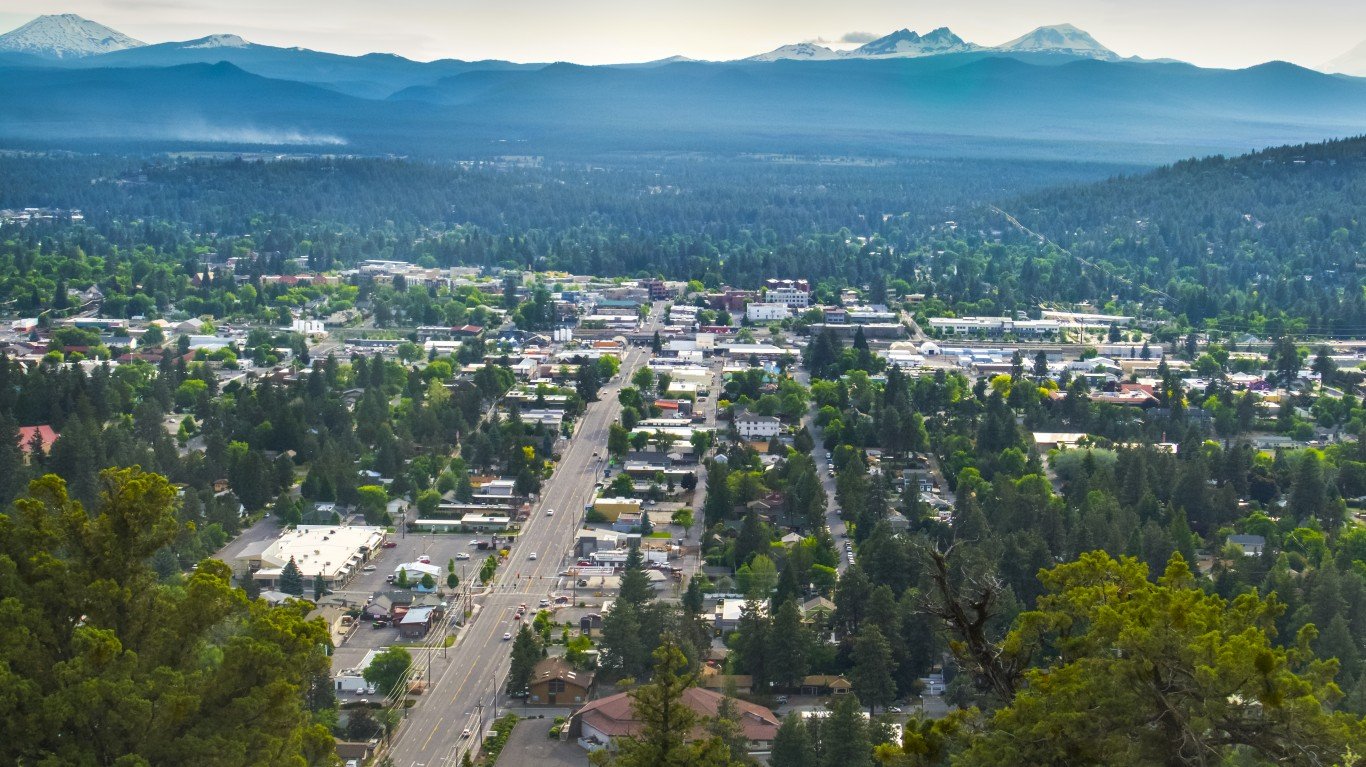
- 2017-2022 pop. growth: 10.5% (19,674)
- 2022 population: 206,549 — #218 highest out of 387
- 2017 population: 186,875 — #225 highest out of 387
- 2017-2022 employment change: +10.0% — #37 largest increase of 257
- Unemployment rate, Dec 2022: 4.7% — compared to 3.5% national
- 2018-2022 median home value change: 62.5% — compared to 39.7% nationwide
- Median home value, 2022: $664,000 — #16 highest out of 387
45. Billings, MT
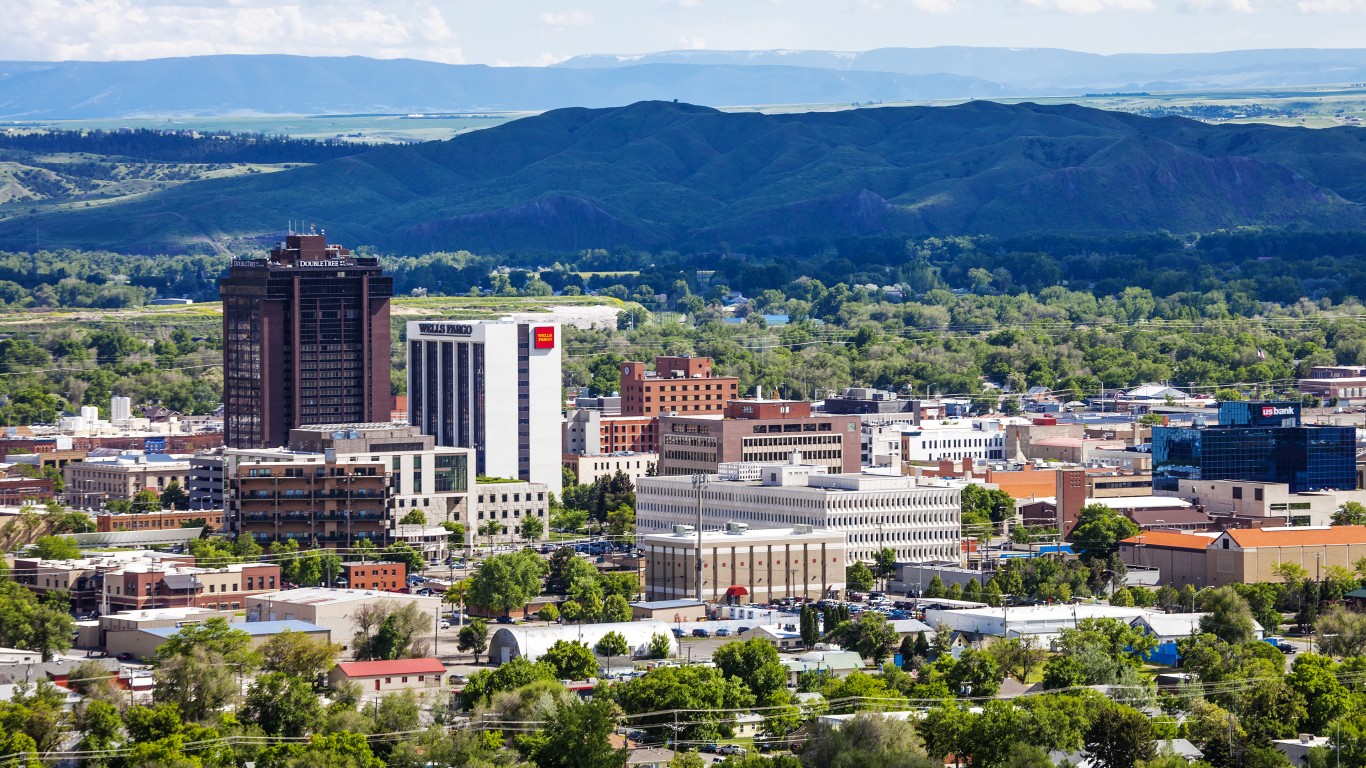
- 2017-2022 pop. growth: 10.5% (18,127)
- 2022 population: 190,208 — #228 highest out of 387
- 2017 population: 172,081 — #240 highest out of 387
- 2017-2022 employment change: +7.1% — #76 largest increase of 257
- Unemployment rate, Dec 2022: 2.4% — compared to 3.5% national
- 2018-2022 median home value change: 44.2% — compared to 39.7% nationwide
- Median home value, 2022: $334,300 — #114 highest out of 387
44. Terre Haute, IN
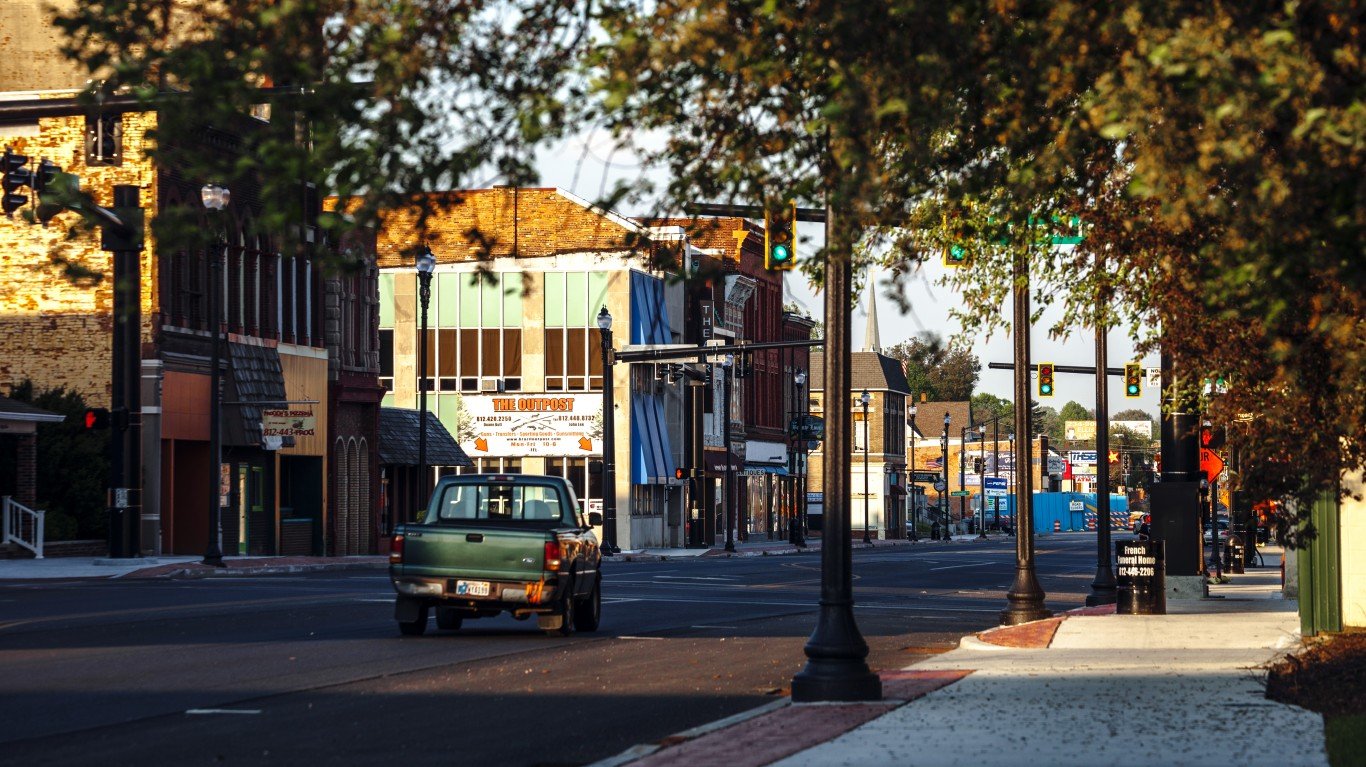
- 2017-2022 pop. growth: 10.7% (17,773)
- 2022 population: 183,571 — #235 highest out of 387
- 2017 population: 165,798 — #252 highest out of 387
- 2017-2022 employment change: -4.9% — #19 largest decrease of 115
- Unemployment rate, Dec 2022: 3.6% — compared to 3.5% national
- 2018-2022 median home value change: 41.1% — compared to 39.7% nationwide
- Median home value, 2022: $140,700 — #366 highest out of 387
43. North Port-Sarasota-Bradenton, FL

- 2017-2022 pop. growth: 10.8% (86,721)
- 2022 population: 891,411 — #65 highest out of 387
- 2017 population: 804,690 — #72 highest out of 387
- 2017-2022 employment change: +8.3% — #56 largest increase of 257
- Unemployment rate, Dec 2022: 2.7% — compared to 3.5% national
- 2018-2022 median home value change: 56.3% — compared to 39.7% nationwide
- Median home value, 2022: $402,600 — #70 highest out of 387
42. Raleigh-Cary, NC
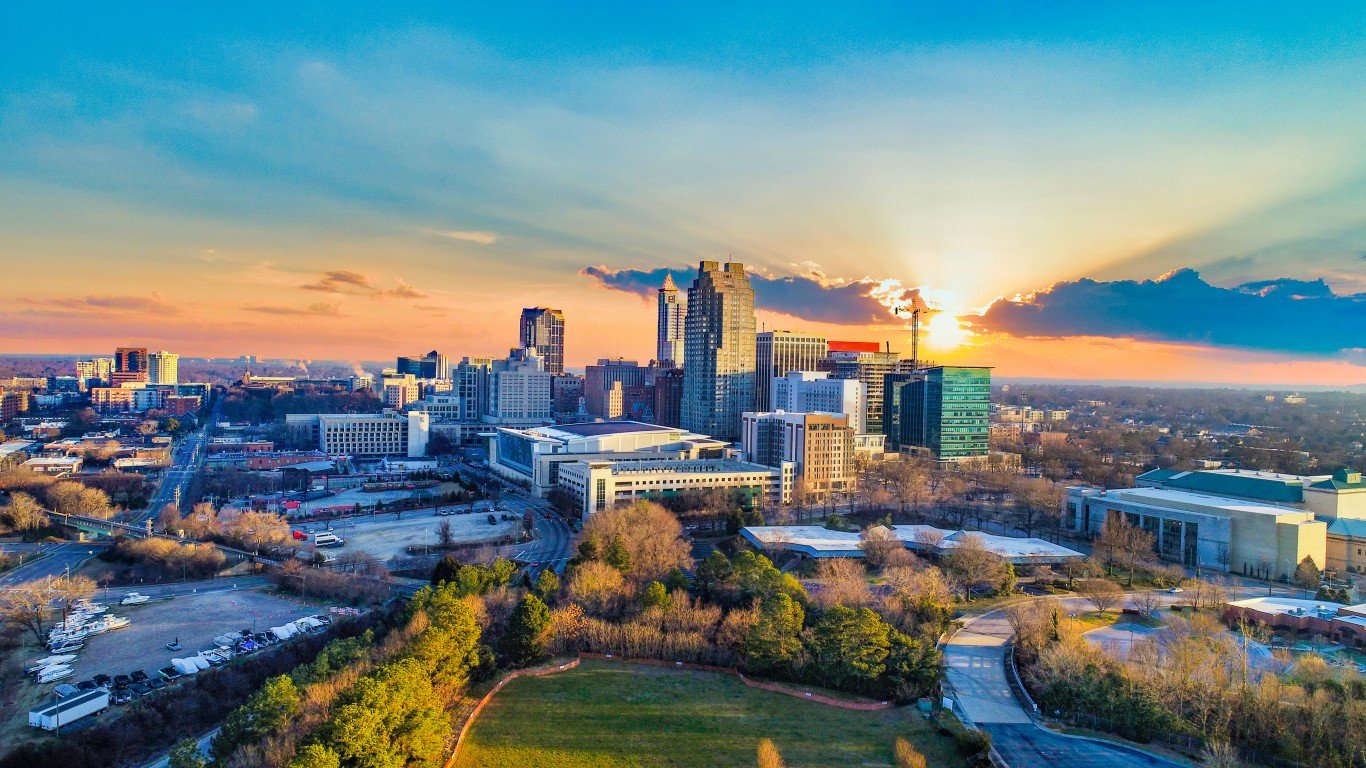
- 2017-2022 pop. growth: 11.2% (149,259)
- 2022 population: 1,484,338 — #41 highest out of 387
- 2017 population: 1,335,079 — #43 highest out of 387
- 2017-2022 employment change: +12.3% — #23 largest increase of 257
- Unemployment rate, Dec 2022: 3.1% — compared to 3.5% national
- 2018-2022 median home value change: 58.7% — compared to 39.7% nationwide
- Median home value, 2022: $424,700 — #60 highest out of 387
41. Cape Coral-Fort Myers, FL
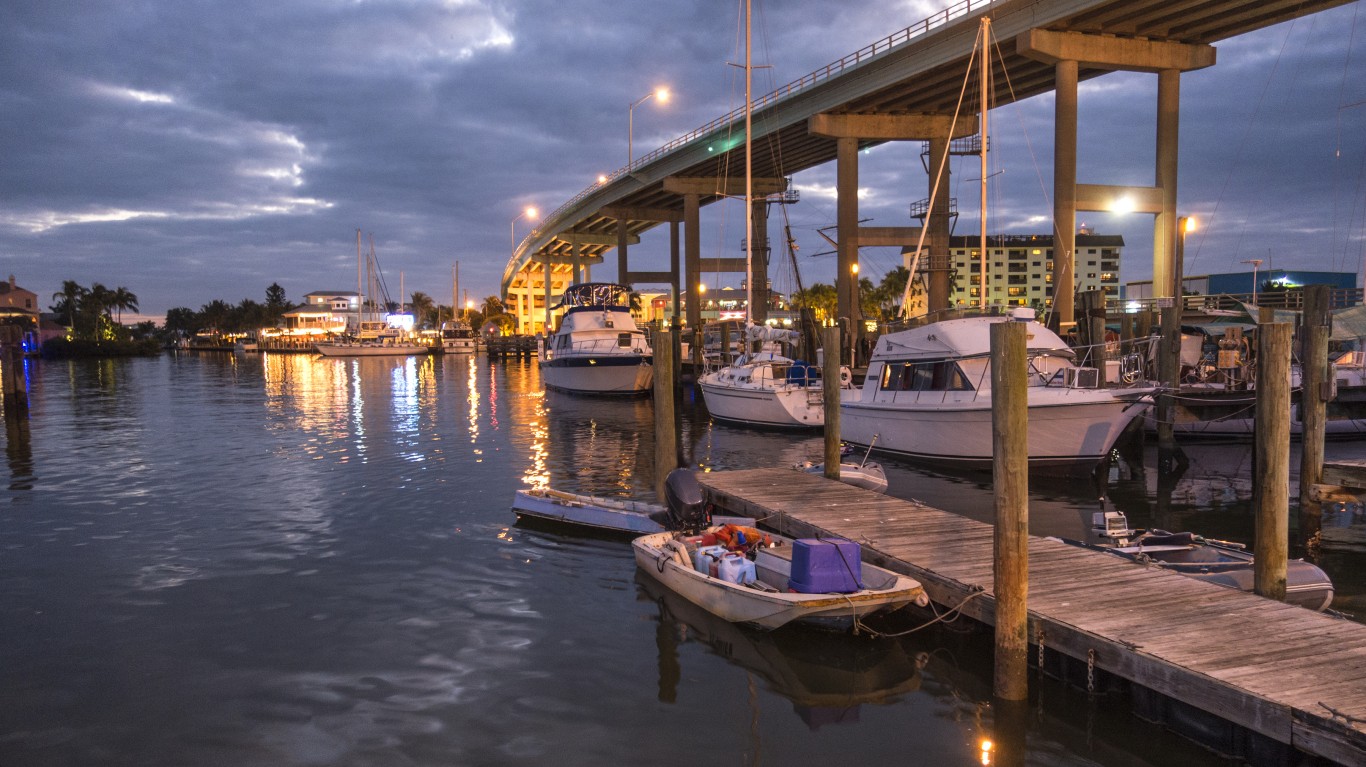
- 2017-2022 pop. growth: 11.3% (83,229)
- 2022 population: 822,453 — #74 highest out of 387
- 2017 population: 739,224 — #76 highest out of 387
- 2017-2022 employment change: +14.3% — #10 largest increase of 257
- Unemployment rate, Dec 2022: 2.6% — compared to 3.5% national
- 2018-2022 median home value change: 53.8% — compared to 39.7% nationwide
- Median home value, 2022: $361,400 — #90 highest out of 387
40. Punta Gorda, FL
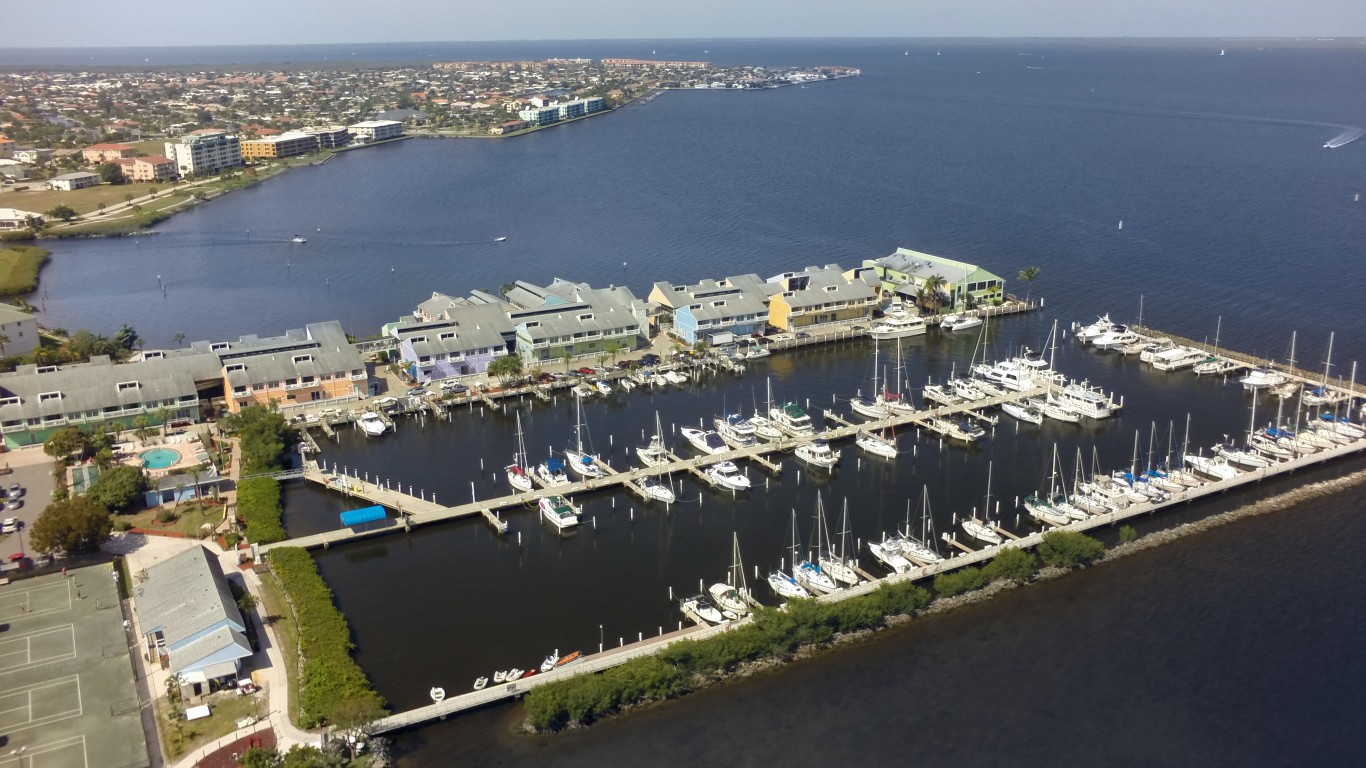
- 2017-2022 pop. growth: 11.3% (20,628)
- 2022 population: 202,661 — #221 highest out of 387
- 2017 population: 182,033 — #228 highest out of 387
- 2017-2022 employment change: +12.3% — #22 largest increase of 257
- Unemployment rate, Dec 2022: 2.8% — compared to 3.5% national
- 2018-2022 median home value change: 65.9% — compared to 39.7% nationwide
- Median home value, 2022: $342,700 — #106 highest out of 387
39. Jacksonville, FL

- 2017-2022 pop. growth: 11.3% (170,688)
- 2022 population: 1,675,668 — #38 highest out of 387
- 2017 population: 1,504,980 — #40 highest out of 387
- 2017-2022 employment change: +11.8% — #25 largest increase of 257
- Unemployment rate, Dec 2022: 2.6% — compared to 3.5% national
- 2018-2022 median home value change: 59.8% — compared to 39.7% nationwide
- Median home value, 2022: $347,000 — #102 highest out of 387
38. Sioux Falls, SD
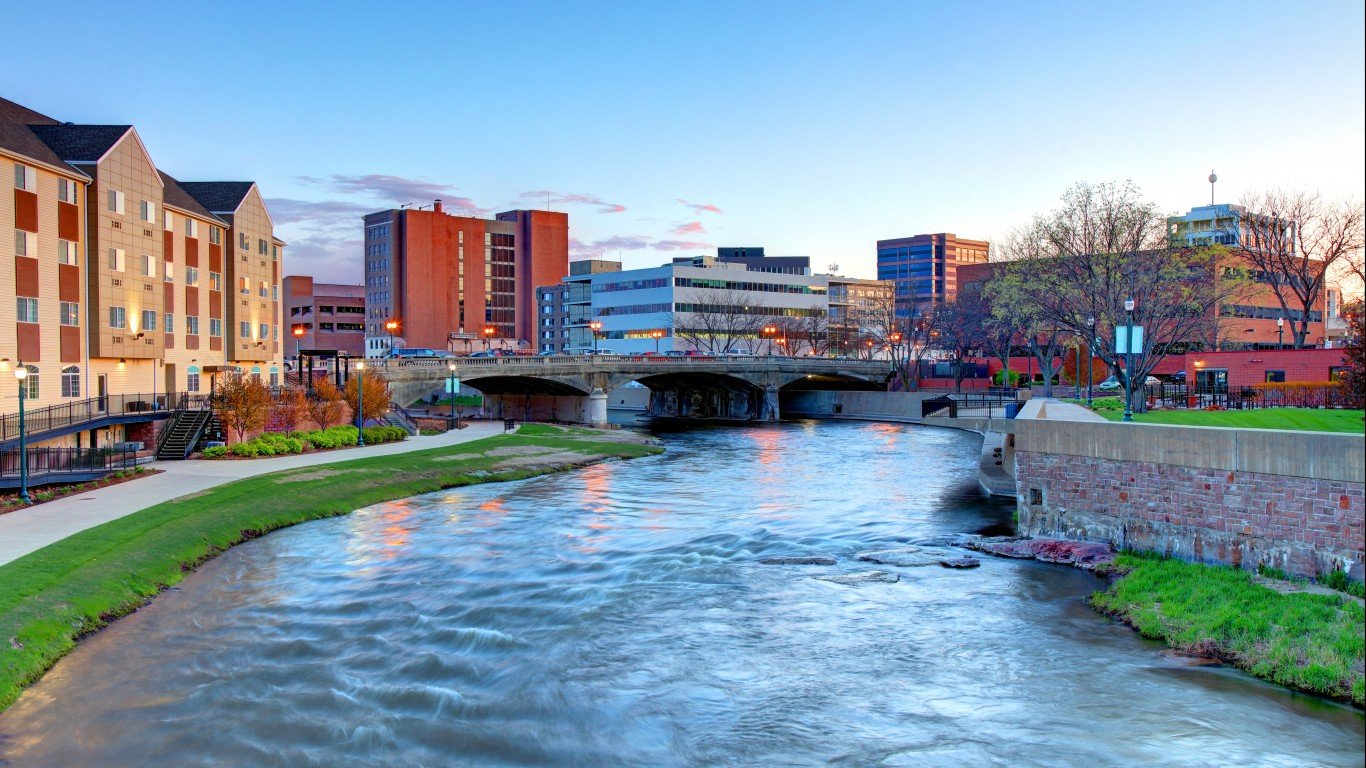
- 2017-2022 pop. growth: 11.4% (29,645)
- 2022 population: 289,295 — #172 highest out of 387
- 2017 population: 259,650 — #185 highest out of 387
- 2017-2022 employment change: +8.5% — #53 largest increase of 257
- Unemployment rate, Dec 2022: 1.9% — compared to 3.5% national
- 2018-2022 median home value change: 41.5% — compared to 39.7% nationwide
- Median home value, 2022: $282,200 — #158 highest out of 387
37. Homosassa Springs, FL
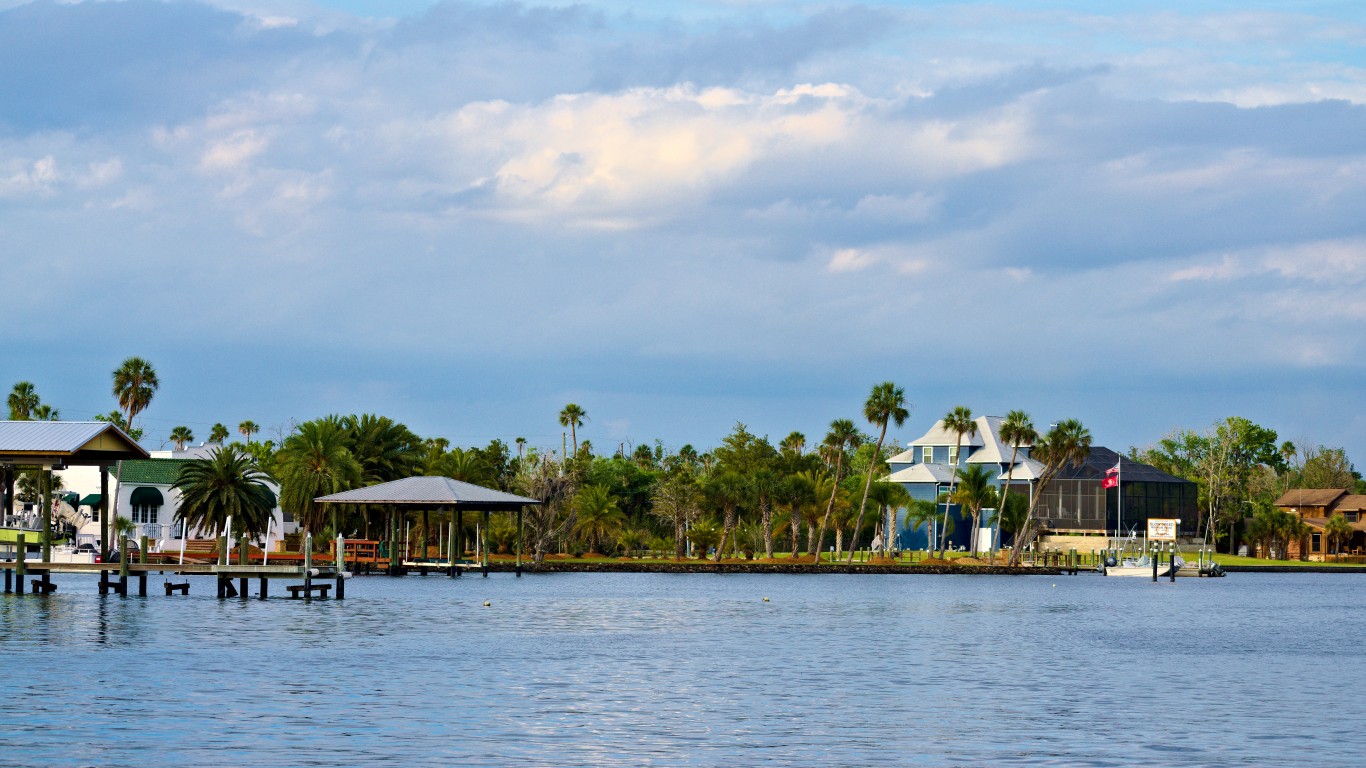
- 2017-2022 pop. growth: 11.6% (16,882)
- 2022 population: 162,529 — #261 highest out of 387
- 2017 population: 145,647 — #284 highest out of 387
- 2017-2022 employment change: +7.3% — #71 largest increase of 257
- Unemployment rate, Dec 2022: 3.9% — compared to 3.5% national
- 2018-2022 median home value change: 74.2% — compared to 39.7% nationwide
- Median home value, 2022: $239,700 — #206 highest out of 387
36. Auburn-Opelika, AL
- 2017-2022 pop. growth: 11.9% (19,169)
- 2022 population: 180,773 — #241 highest out of 387
- 2017 population: 161,604 — #257 highest out of 387
- 2017-2022 employment change: +8.5% — #55 largest increase of 257
- Unemployment rate, Dec 2022: 2.4% — compared to 3.5% national
- 2018-2022 median home value change: 44.4% — compared to 39.7% nationwide
- Median home value, 2022: $263,900 — #176 highest out of 387
35. Ocala, FL
- 2017-2022 pop. growth: 11.9% (42,062)
- 2022 population: 396,415 — #138 highest out of 387
- 2017 population: 354,353 — #148 highest out of 387
- 2017-2022 employment change: +13.8% — #11 largest increase of 257
- Unemployment rate, Dec 2022: 3.2% — compared to 3.5% national
- 2018-2022 median home value change: 61.5% — compared to 39.7% nationwide
- Median home value, 2022: $243,200 — #203 highest out of 387
34. Killeen-Temple, TX
- 2017-2022 pop. growth: 12.1% (53,535)
- 2022 population: 496,228 — #113 highest out of 387
- 2017 population: 442,693 — #121 highest out of 387
- 2017-2022 employment change: +5.1% — #107 largest increase of 257
- Unemployment rate, Dec 2022: 4.3% — compared to 3.5% national
- 2018-2022 median home value change: 53.6% — compared to 39.7% nationwide
- Median home value, 2022: $229,100 — #225 highest out of 387
33. Logan, UT-ID
- 2017-2022 pop. growth: 12.3% (16,977)
- 2022 population: 155,196 — #273 highest out of 387
- 2017 population: 138,219 — #293 highest out of 387
- 2017-2022 employment change: +13.3% — #14 largest increase of 257
- Unemployment rate, Dec 2022: 2.1% — compared to 3.5% national
- 2018-2022 median home value change: 78.5% — compared to 39.7% nationwide
- Median home value, 2022: $456,900 — #48 highest out of 387
32. Des Moines-West Des Moines, IA
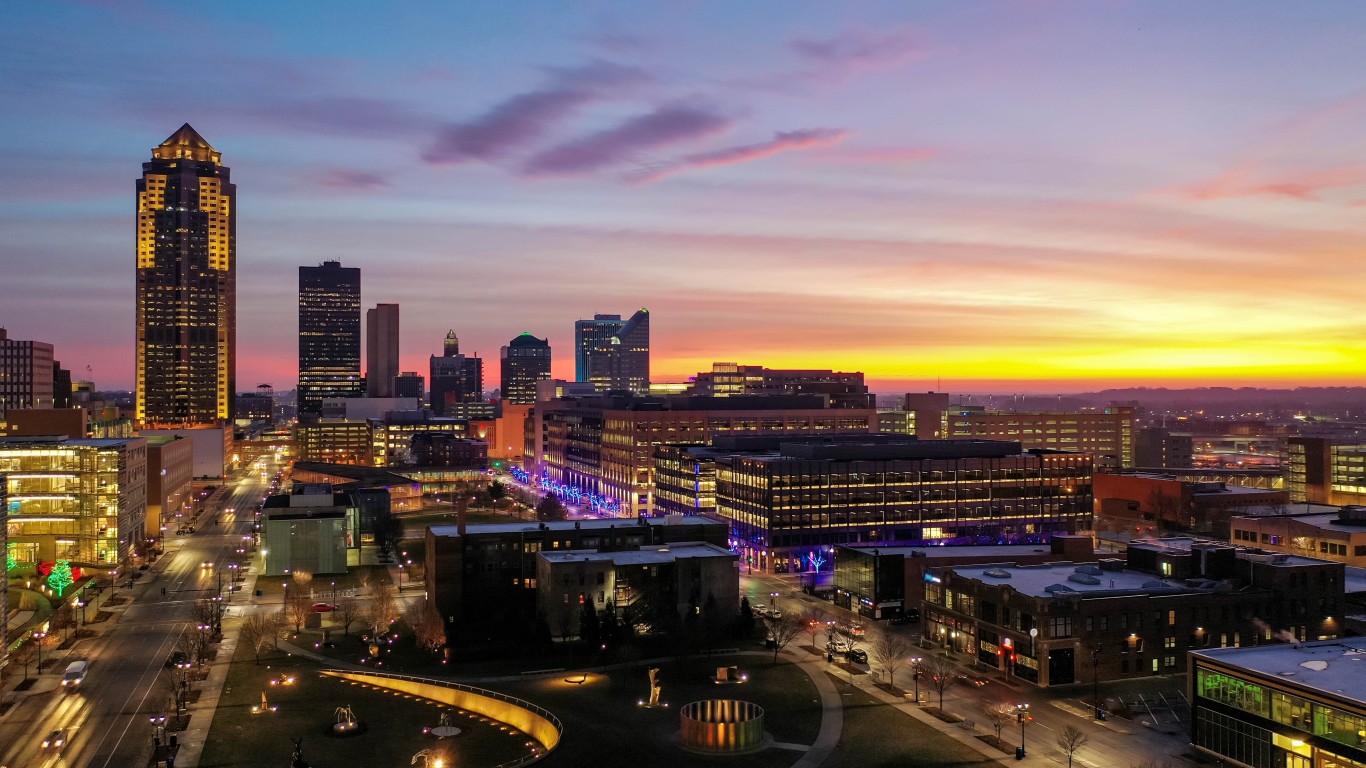
- 2017-2022 pop. growth: 12.9% (83,142)
- 2022 population: 729,053 — #81 highest out of 387
- 2017 population: 645,911 — #88 highest out of 387
- 2017-2022 employment change: +7.2% — #73 largest increase of 257
- Unemployment rate, Dec 2022: 2.7% — compared to 3.5% national
- 2018-2022 median home value change: 32.5% — compared to 39.7% nationwide
- Median home value, 2022: $258,800 — #182 highest out of 387
31. Huntsville, AL
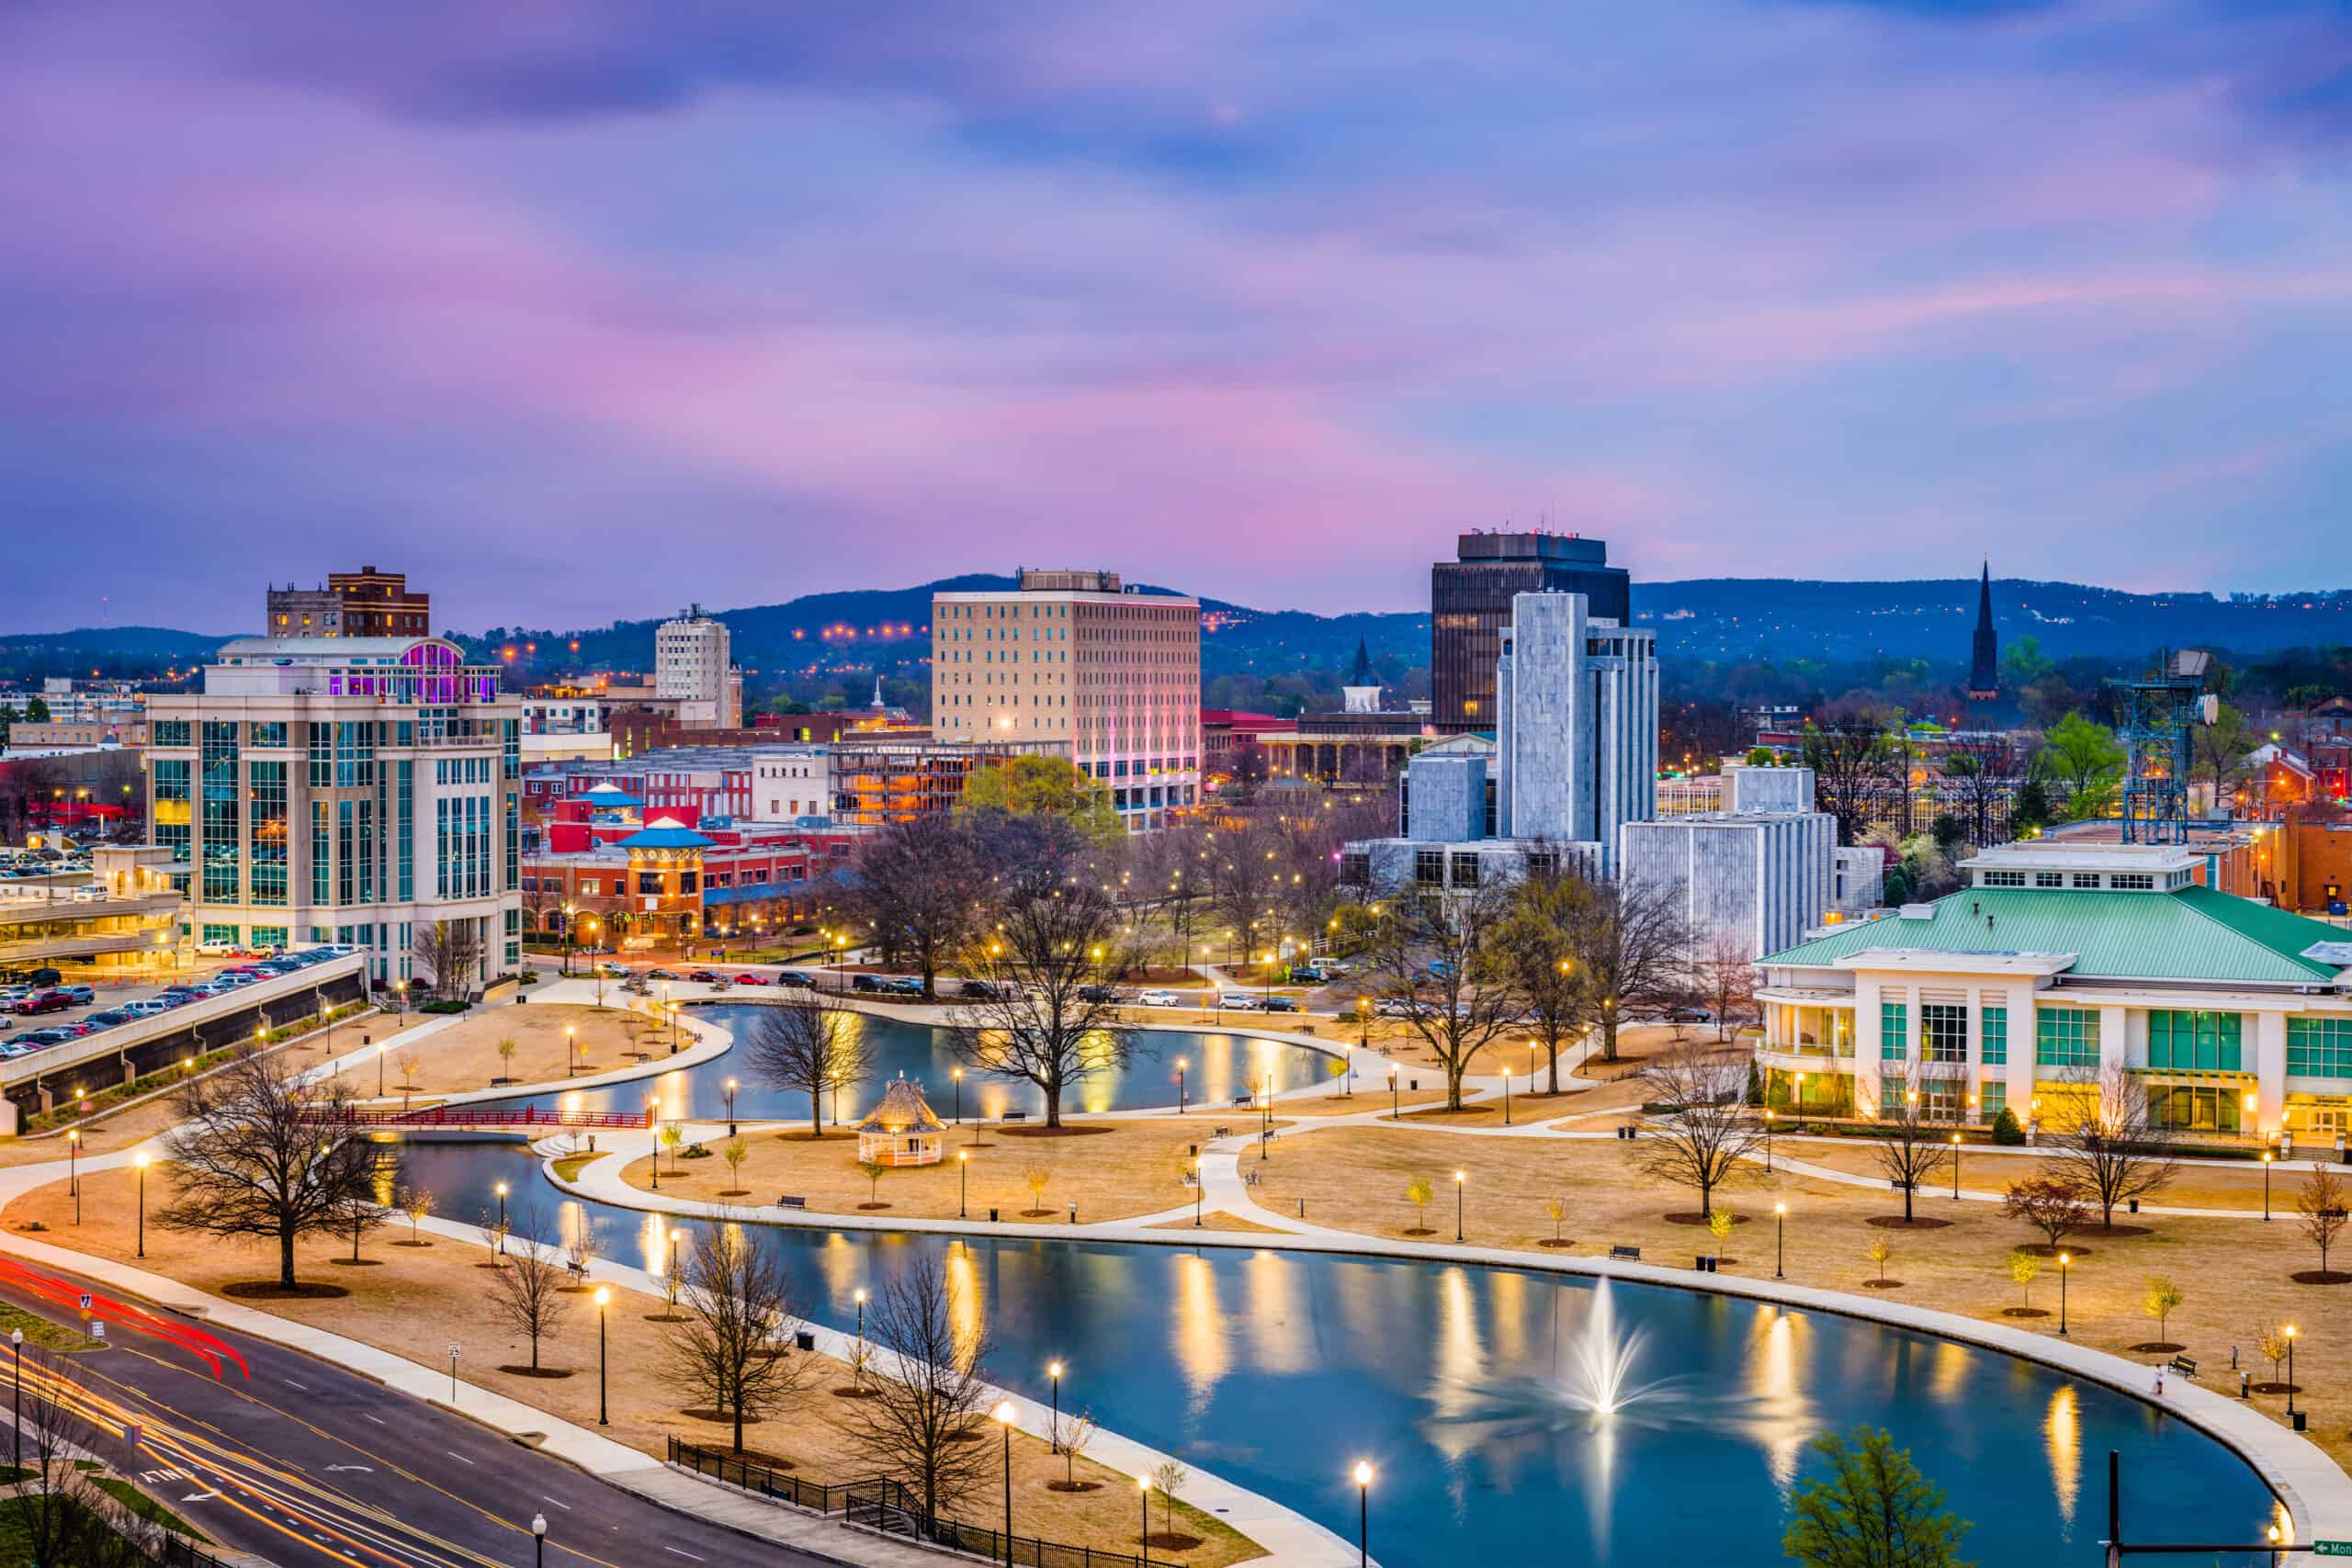
- 2017-2022 pop. growth: 13.0% (59,017)
- 2022 population: 514,465 — #111 highest out of 387
- 2017 population: 455,448 — #116 highest out of 387
- 2017-2022 employment change: +13.5% — #13 largest increase of 257
- Unemployment rate, Dec 2022: 2.1% — compared to 3.5% national
- 2018-2022 median home value change: 56.5% — compared to 39.7% nationwide
- Median home value, 2022: $292,700 — #144 highest out of 387
30. Lansing-East Lansing, MI
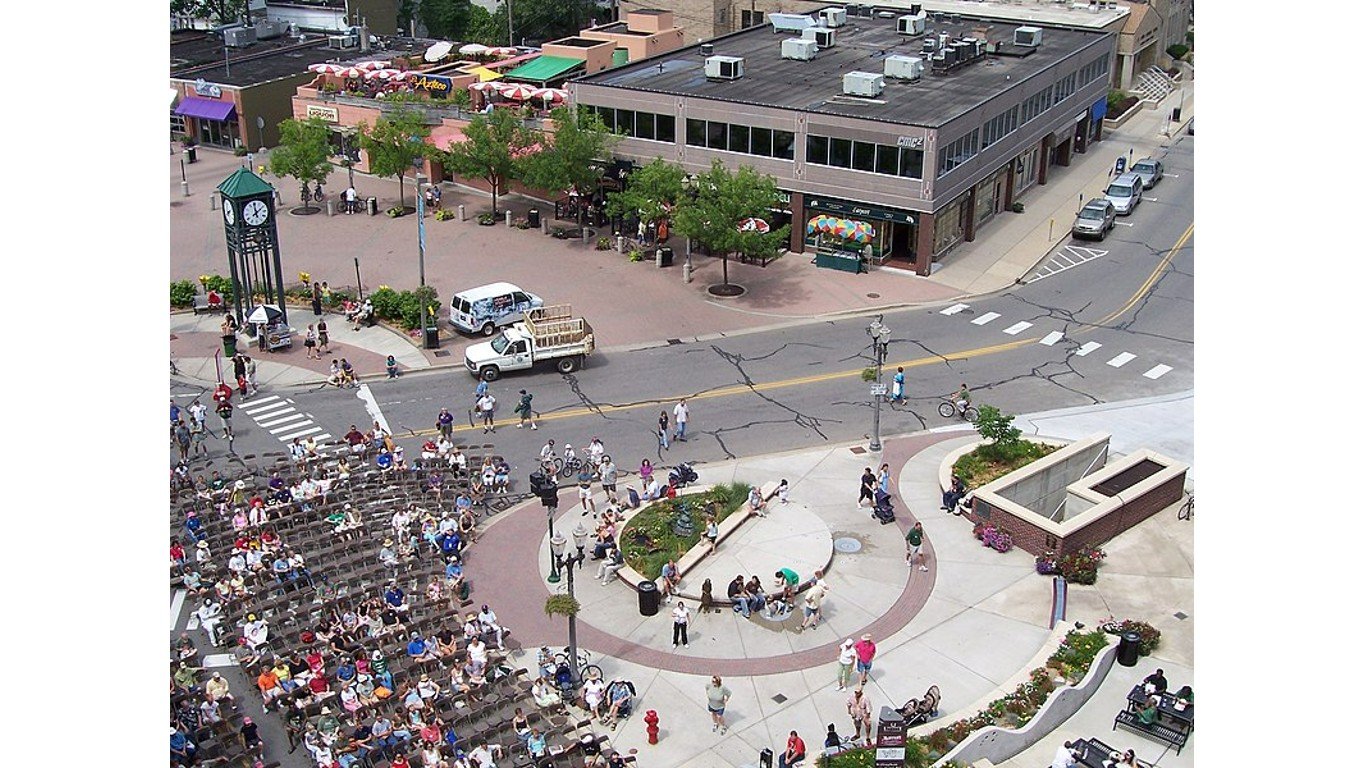
- 2017-2022 pop. growth: 13.2% (63,214)
- 2022 population: 540,870 — #104 highest out of 387
- 2017 population: 477,656 — #109 highest out of 387
- 2017-2022 employment change: -2.8% — #45 largest decrease of 115
- Unemployment rate, Dec 2022: 4.3% — compared to 3.5% national
- 2018-2022 median home value change: 22.6% — compared to 39.7% nationwide
- Median home value, 2022: $194,700 — #284 highest out of 387
29. Monroe, LA

- 2017-2022 pop. growth: 13.7% (24,424)
- 2022 population: 202,869 — #220 highest out of 387
- 2017 population: 178,445 — #235 highest out of 387
- 2017-2022 employment change: +0.7% — #232 largest increase of 257
- Unemployment rate, Dec 2022: 3.7% — compared to 3.5% national
- 2018-2022 median home value change: 6.0% — compared to 39.7% nationwide
- Median home value, 2022: $166,000 — #338 highest out of 387
28. Idaho Falls, ID

- 2017-2022 pop. growth: 13.8% (20,060)
- 2022 population: 165,409 — #258 highest out of 387
- 2017 population: 145,349 — #285 highest out of 387
- 2017-2022 employment change: +15.2% — #8 largest increase of 257
- Unemployment rate, Dec 2022: 2.3% — compared to 3.5% national
- 2018-2022 median home value change: 79.9% — compared to 39.7% nationwide
- Median home value, 2022: $369,600 — #83 highest out of 387
27. Hagerstown-Martinsburg, MD-WV
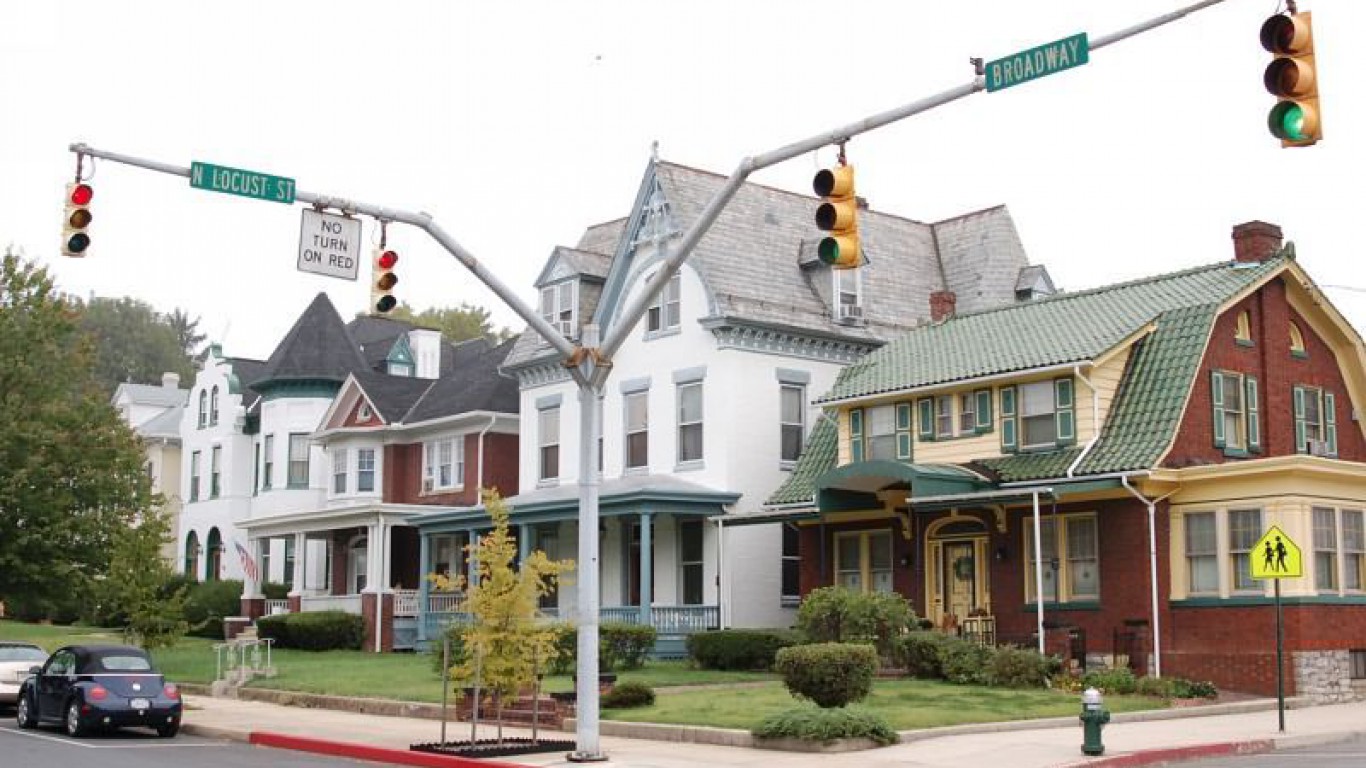
- 2017-2022 pop. growth: 14.4% (38,167)
- 2022 population: 303,665 — #165 highest out of 387
- 2017 population: 265,498 — #183 highest out of 387
- 2017-2022 employment change: +0.1% — #256 largest increase of 257
- Unemployment rate, Dec 2022: 3.2% — compared to 3.5% national
- 2018-2022 median home value change: 38.0% — compared to 39.7% nationwide
- Median home value, 2022: $268,800 — #168 highest out of 387
26. Austin-Round Rock-Georgetown, TX
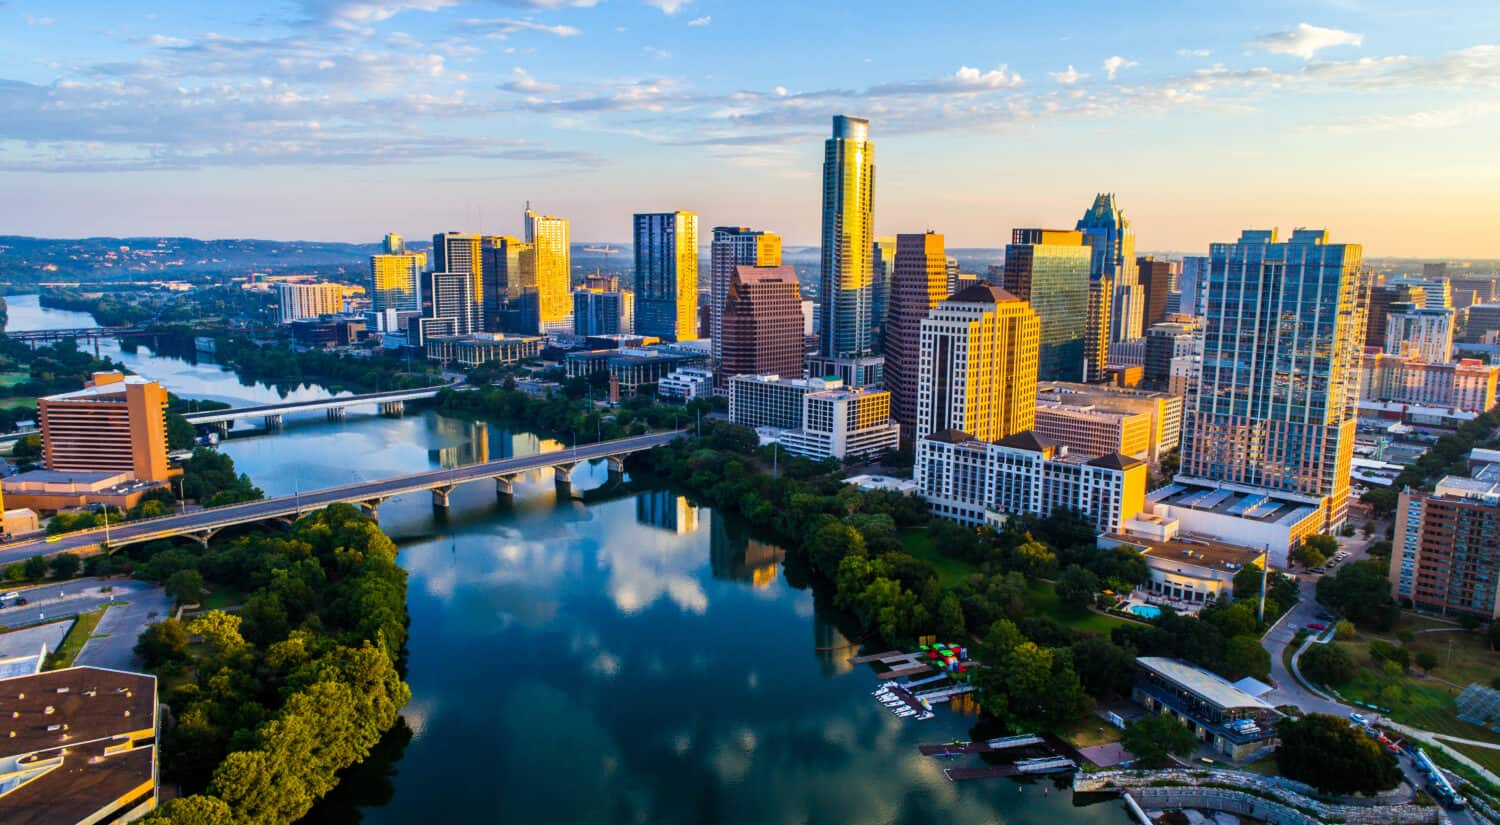
- 2017-2022 pop. growth: 14.4% (305,288)
- 2022 population: 2,421,115 — #26 highest out of 387
- 2017 population: 2,115,827 — #31 highest out of 387
- 2017-2022 employment change: +20.8% — #3 largest increase of 257
- Unemployment rate, Dec 2022: 2.8% — compared to 3.5% national
- 2018-2022 median home value change: 60.9% — compared to 39.7% nationwide
- Median home value, 2022: $490,000 — #39 highest out of 387
25. Tuscaloosa, AL
- 2017-2022 pop. growth: 14.4% (34,995)
- 2022 population: 277,274 — #178 highest out of 387
- 2017 population: 242,279 — #188 highest out of 387
- 2017-2022 employment change: +3.3% — #153 largest increase of 257
- Unemployment rate, Dec 2022: 2.6% — compared to 3.5% national
- 2018-2022 median home value change: 44.9% — compared to 39.7% nationwide
- Median home value, 2022: $237,300 — #212 highest out of 387
24. Boise City, ID

- 2017-2022 pop. growth: 14.6% (103,478)
- 2022 population: 813,801 — #75 highest out of 387
- 2017 population: 710,323 — #79 highest out of 387
- 2017-2022 employment change: +15.8% — #7 largest increase of 257
- Unemployment rate, Dec 2022: 2.5% — compared to 3.5% national
- 2018-2022 median home value change: 84.0% — compared to 39.7% nationwide
- Median home value, 2022: $486,500 — #41 highest out of 387
23. Lakeland-Winter Haven, FL
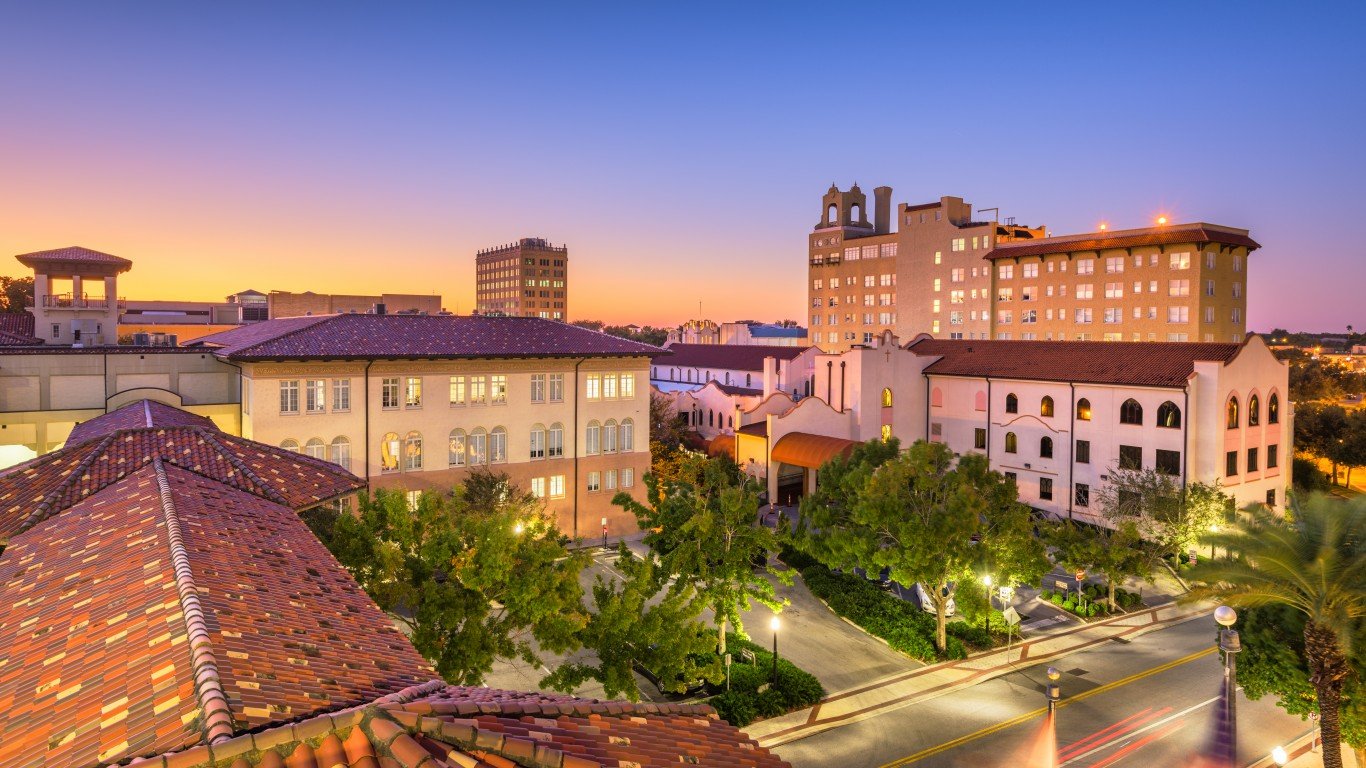
- 2017-2022 pop. growth: 14.7% (100,921)
- 2022 population: 787,404 — #77 highest out of 387
- 2017 population: 686,483 — #81 highest out of 387
- 2017-2022 employment change: +18.7% — #5 largest increase of 257
- Unemployment rate, Dec 2022: 3.2% — compared to 3.5% national
- 2018-2022 median home value change: 65.8% — compared to 39.7% nationwide
- Median home value, 2022: $267,500 — #169 highest out of 387
22. Greeley, CO
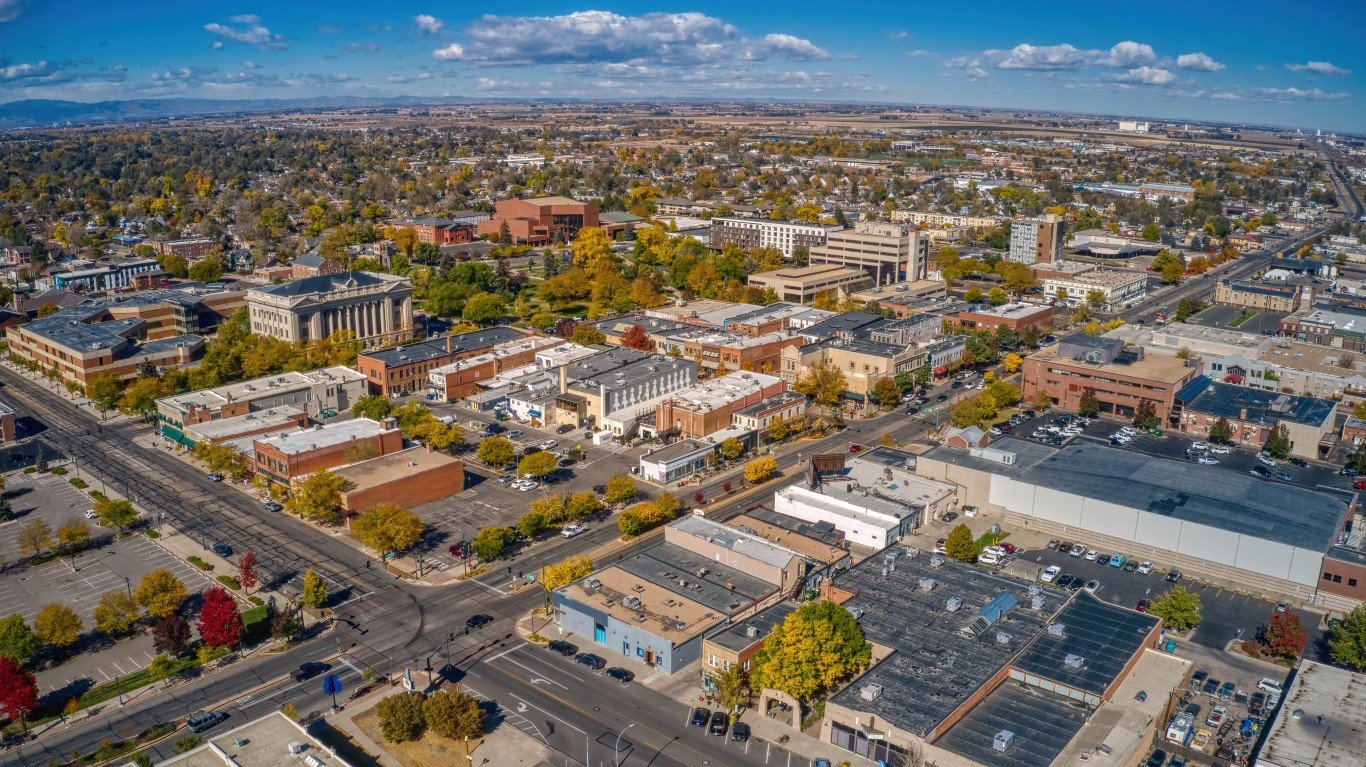
- 2017-2022 pop. growth: 15.0% (45,543)
- 2022 population: 350,176 — #151 highest out of 387
- 2017 population: 304,633 — #162 highest out of 387
- 2017-2022 employment change: +5.6% — #98 largest increase of 257
- Unemployment rate, Dec 2022: 3.0% — compared to 3.5% national
- 2018-2022 median home value change: 40.2% — compared to 39.7% nationwide
- Median home value, 2022: $456,100 — #49 highest out of 387
21. Myrtle Beach-Conway-North Myrtle Beach, SC-NC
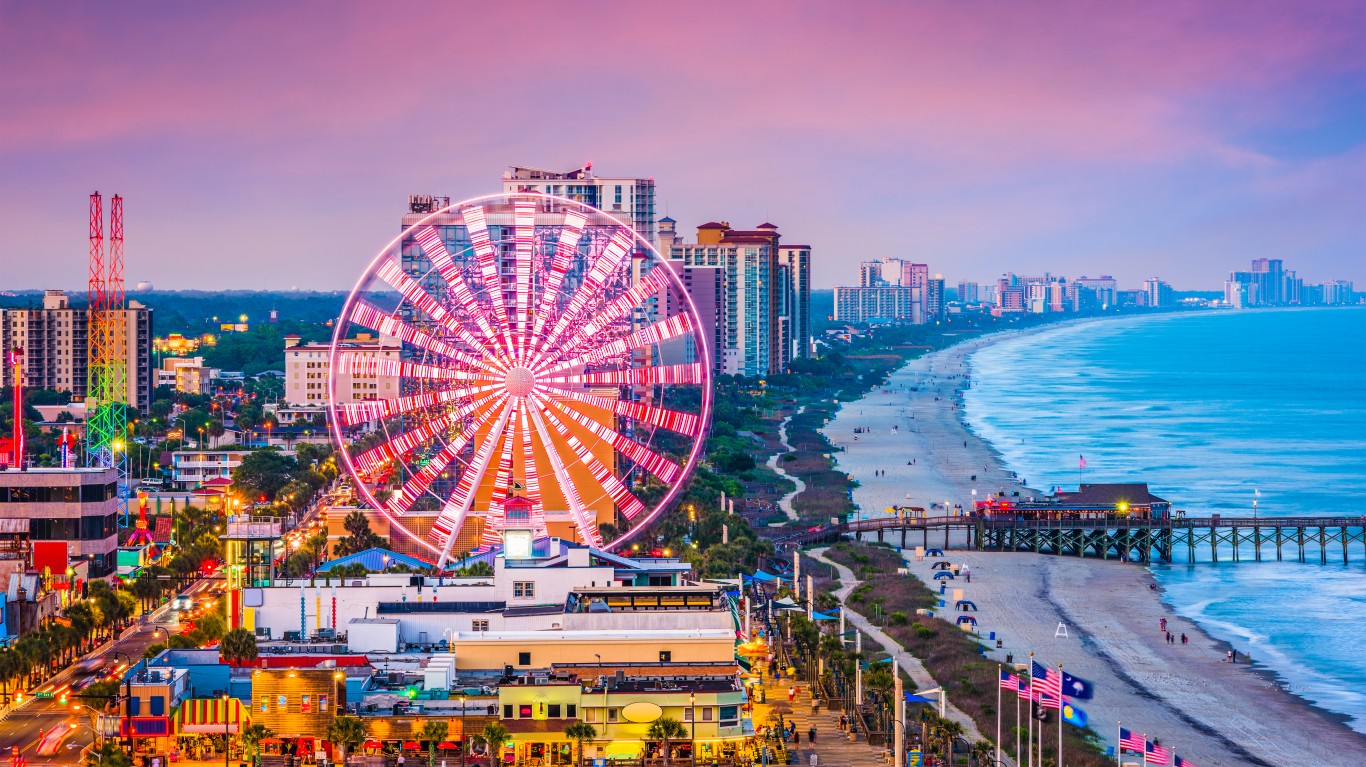
- 2017-2022 pop. growth: 15.5% (72,000)
- 2022 population: 536,165 — #105 highest out of 387
- 2017 population: 464,165 — #113 highest out of 387
- 2017-2022 employment change: +9.8% — #40 largest increase of 257
- Unemployment rate, Dec 2022: 4.0% — compared to 3.5% national
- 2018-2022 median home value change: 53.7% — compared to 39.7% nationwide
- Median home value, 2022: $299,300 — #140 highest out of 387
20. Pocatello, ID
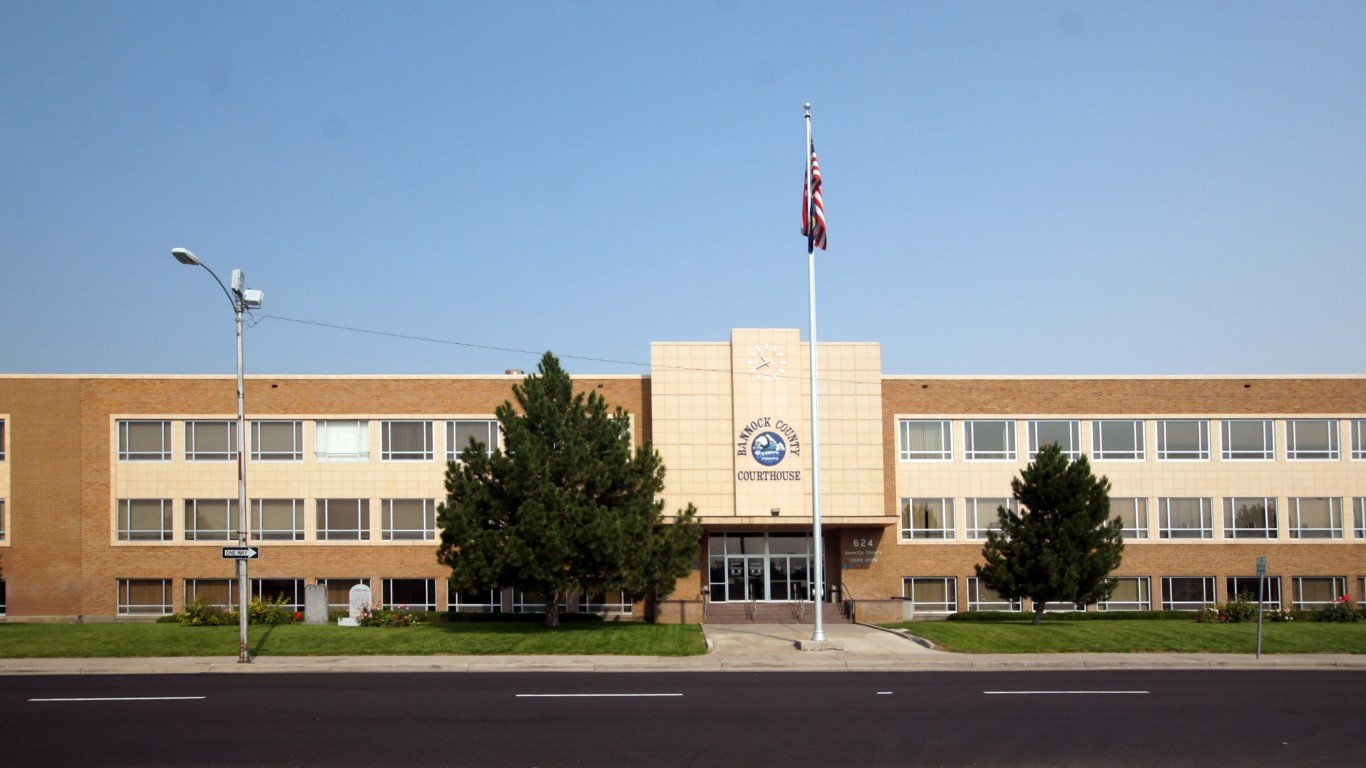
- 2017-2022 pop. growth: 15.6% (13,291)
- 2022 population: 98,560 — #358 highest out of 387
- 2017 population: 85,269 — #369 highest out of 387
- 2017-2022 employment change: +4.8% — #116 largest increase of 257
- Unemployment rate, Dec 2022: 2.7% — compared to 3.5% national
- 2018-2022 median home value change: 87.7% — compared to 39.7% nationwide
- Median home value, 2022: $311,200 — #125 highest out of 387
19. Provo-Orem, UT
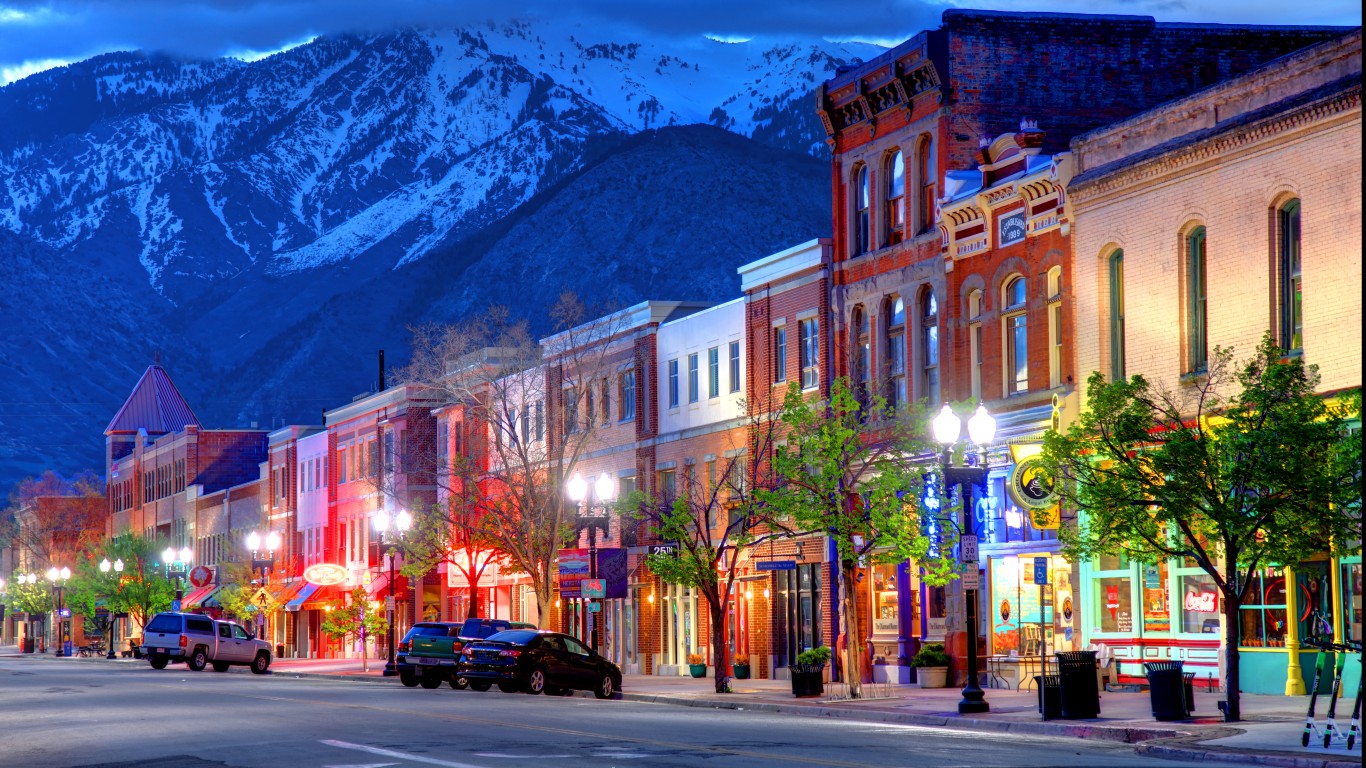
- 2017-2022 pop. growth: 15.7% (96,776)
- 2022 population: 714,454 — #83 highest out of 387
- 2017 population: 617,678 — #90 highest out of 387
- 2017-2022 employment change: +17.3% — #6 largest increase of 257
- Unemployment rate, Dec 2022: 2.3% — compared to 3.5% national
- 2018-2022 median home value change: 65.6% — compared to 39.7% nationwide
- Median home value, 2022: $546,500 — #27 highest out of 387
18. The Villages, FL
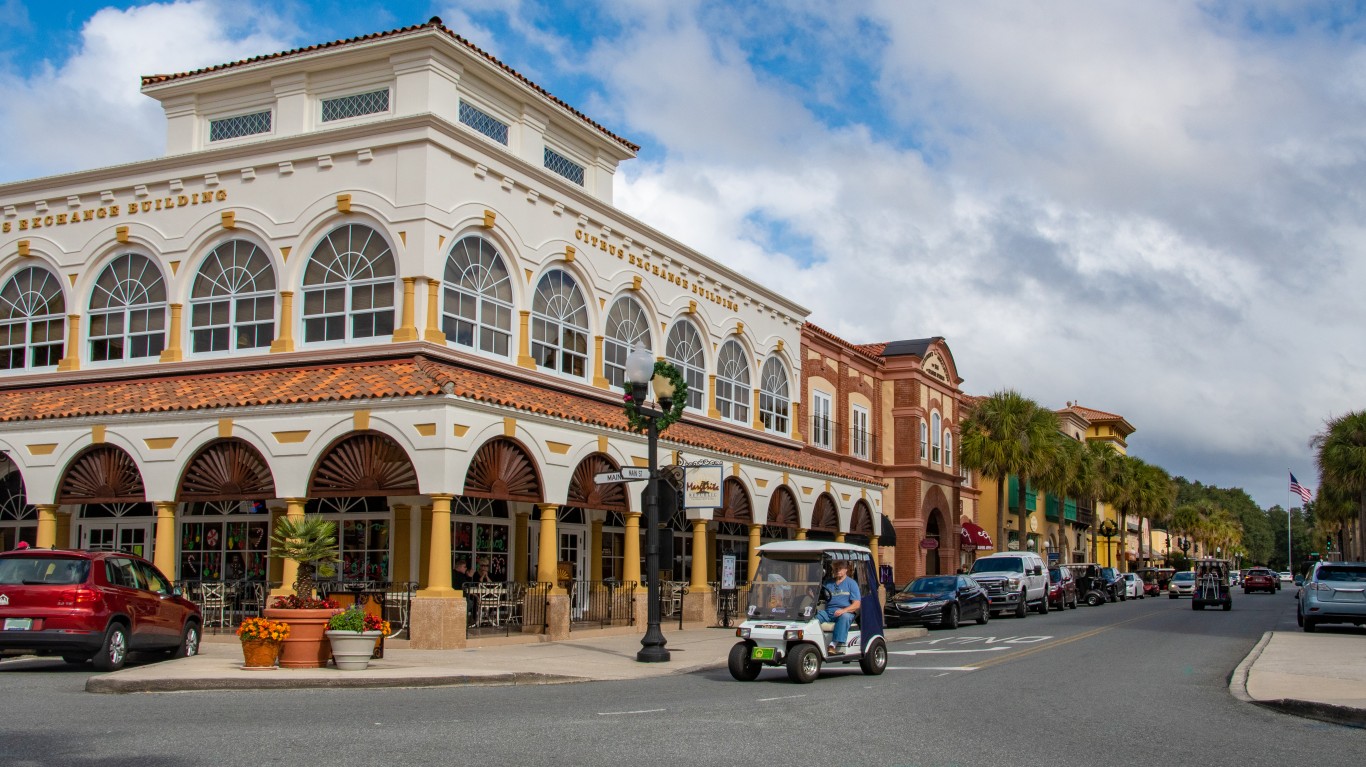
- 2017-2022 pop. growth: 15.8% (19,805)
- 2022 population: 144,970 — #288 highest out of 387
- 2017 population: 125,165 — #313 highest out of 387
- 2017-2022 employment change: +25.6% — #1 largest increase of 257
- Unemployment rate, Dec 2022: 3.7% — compared to 3.5% national
- 2018-2022 median home value change: 43.9% — compared to 39.7% nationwide
- Median home value, 2022: $367,200 — #84 highest out of 387
17. Daphne-Fairhope-Foley, AL
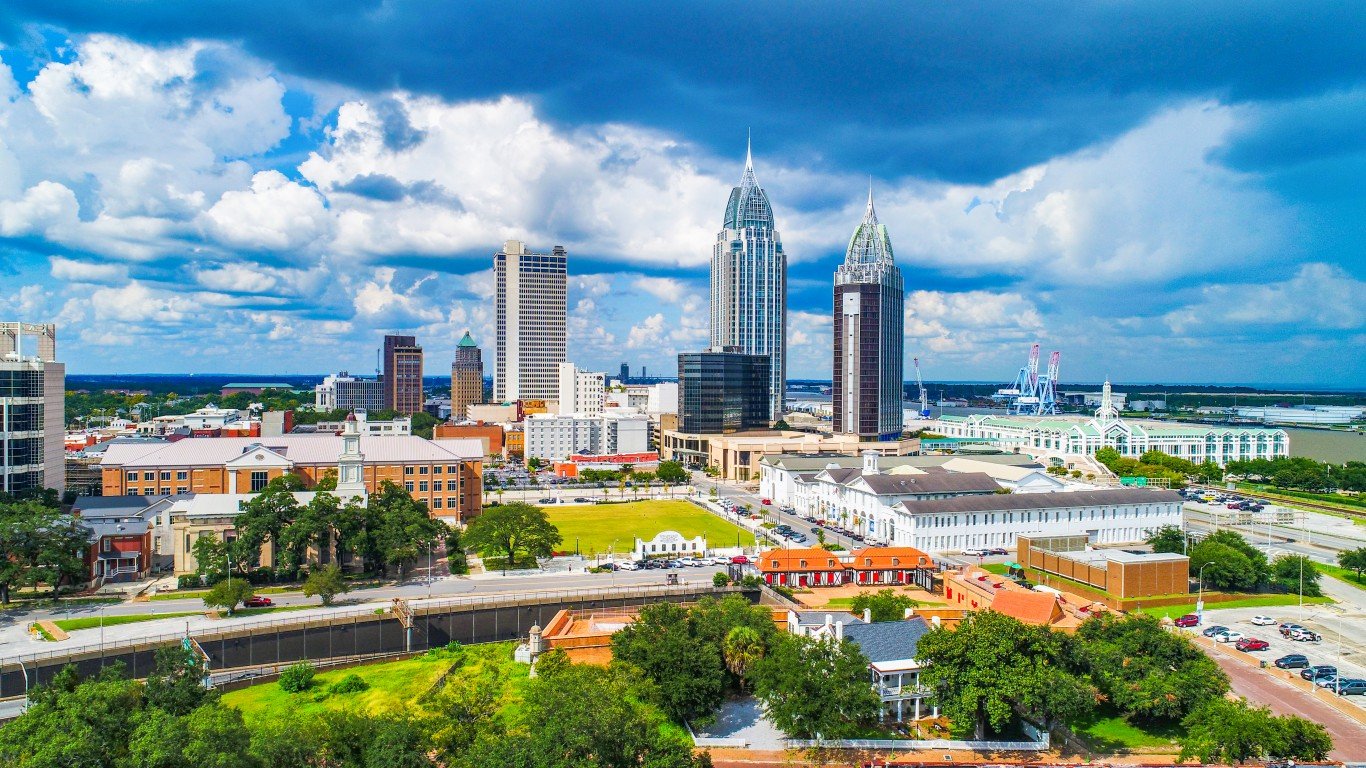
- 2017-2022 pop. growth: 15.9% (33,807)
- 2022 population: 246,435 — #192 highest out of 387
- 2017 population: 212,628 — #208 highest out of 387
- 2017-2022 employment change: +11.6% — #26 largest increase of 257
- Unemployment rate, Dec 2022: 2.3% — compared to 3.5% national
- 2018-2022 median home value change: 57.2% — compared to 39.7% nationwide
- Median home value, 2022: $304,600 — #134 highest out of 387
16. Coeur d’Alene, ID

- 2017-2022 pop. growth: 16.5% (25,941)
- 2022 population: 183,578 — #234 highest out of 387
- 2017 population: 157,637 — #259 highest out of 387
- 2017-2022 employment change: +9.5% — #42 largest increase of 257
- Unemployment rate, Dec 2022: 3.3% — compared to 3.5% national
- 2018-2022 median home value change: 98.1% — compared to 39.7% nationwide
- Median home value, 2022: $547,800 — #26 highest out of 387
15. Charleston, WV

- 2017-2022 pop. growth: 16.5% (35,465)
- 2022 population: 250,554 — #190 highest out of 387
- 2017 population: 215,089 — #206 highest out of 387
- 2017-2022 employment change: -4.1% — #25 largest decrease of 115
- Unemployment rate, Dec 2022: 3.9% — compared to 3.5% national
- 2018-2022 median home value change: 13.5% — compared to 39.7% nationwide
- Median home value, 2022: $128,400 — #375 highest out of 387
14. Durham-Chapel Hill, NC
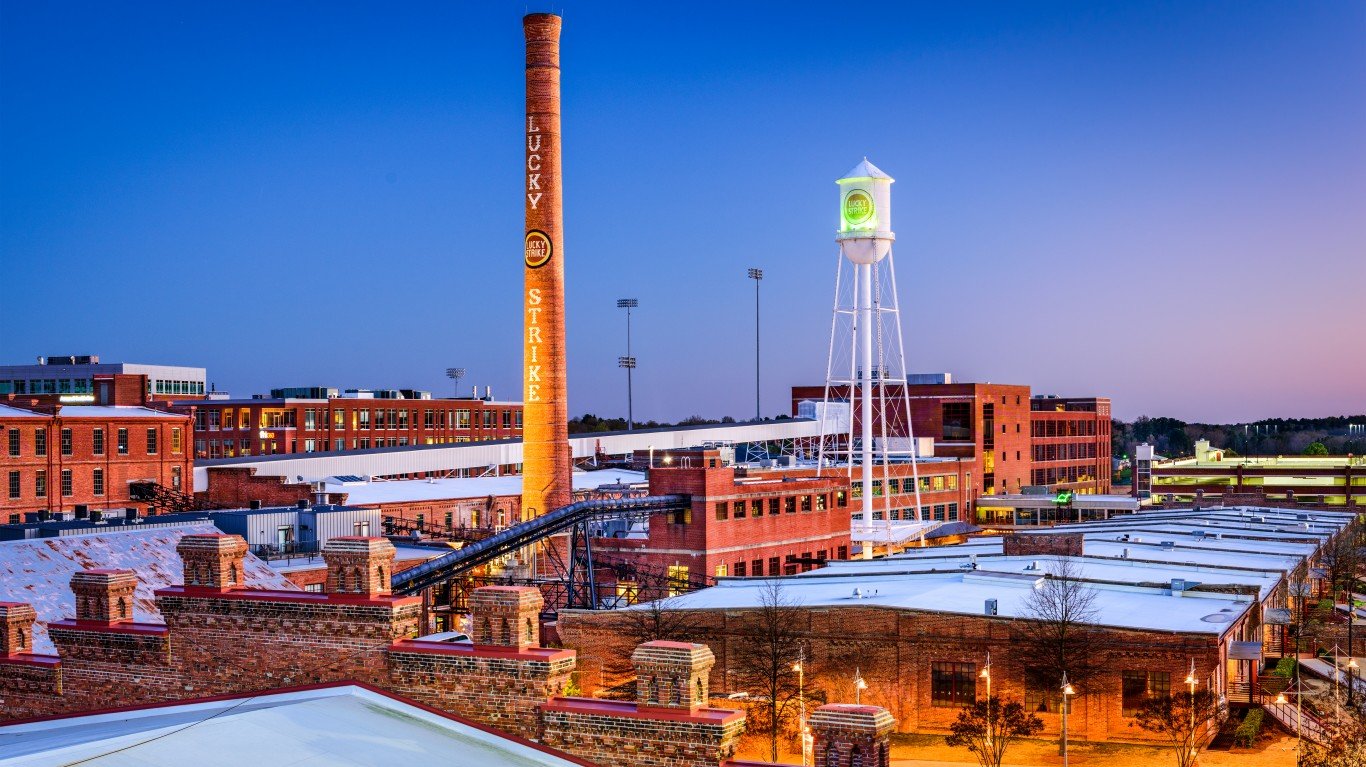
- 2017-2022 pop. growth: 17.1% (96,882)
- 2022 population: 664,310 — #89 highest out of 387
- 2017 population: 567,428 — #96 highest out of 387
- 2017-2022 employment change: +8.7% — #51 largest increase of 257
- Unemployment rate, Dec 2022: 3.2% — compared to 3.5% national
- 2018-2022 median home value change: 46.3% — compared to 39.7% nationwide
- Median home value, 2022: $366,000 — #85 highest out of 387
13. Hattiesburg, MS

- 2017-2022 pop. growth: 17.6% (25,733)
- 2022 population: 172,263 — #249 highest out of 387
- 2017 population: 146,530 — #282 highest out of 387
- 2017-2022 employment change: +2.4% — #179 largest increase of 257
- Unemployment rate, Dec 2022: 3.5% — compared to 3.5% national
- 2018-2022 median home value change: 11.7% — compared to 39.7% nationwide
- Median home value, 2022: $172,300 — #325 highest out of 387
12. Clarksville, TN-KY
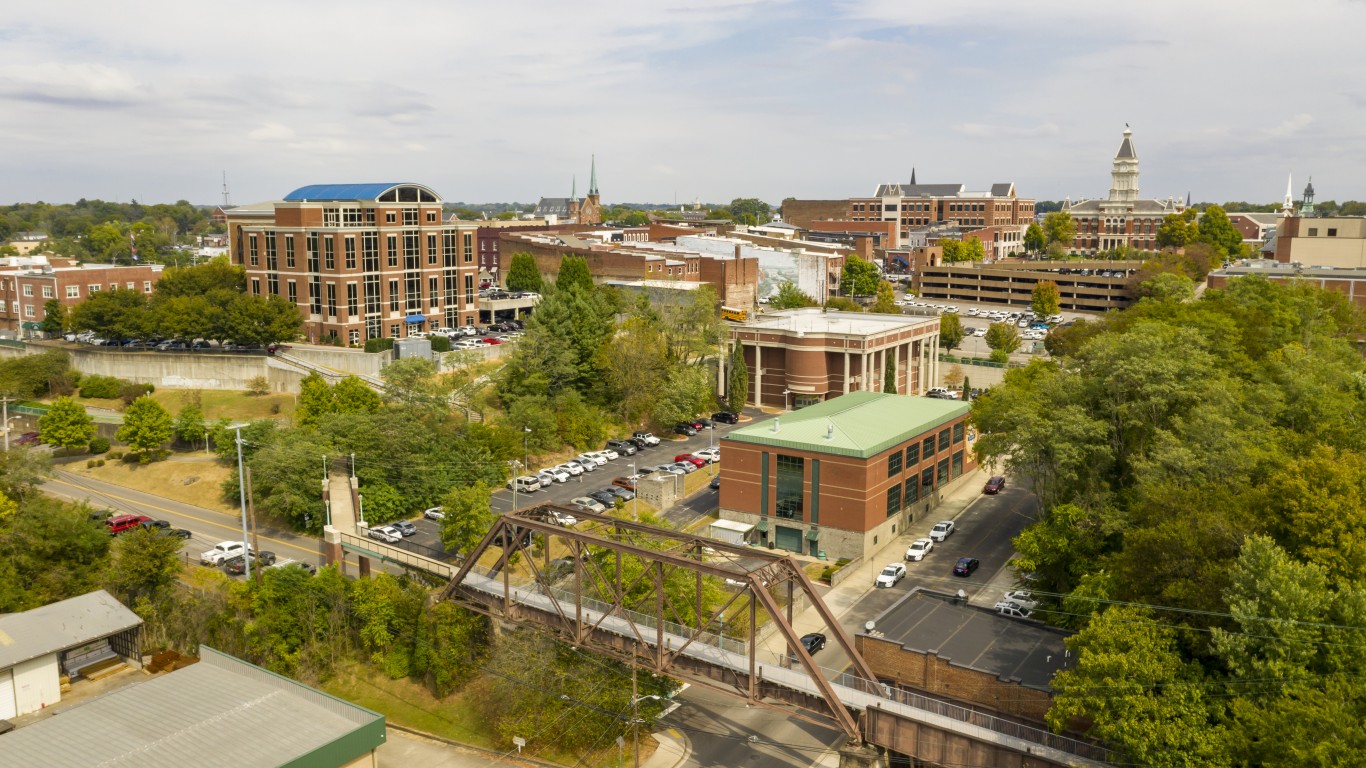
- 2017-2022 pop. growth: 17.8% (50,845)
- 2022 population: 336,447 — #154 highest out of 387
- 2017 population: 285,602 — #166 highest out of 387
- 2017-2022 employment change: +5.0% — #111 largest increase of 257
- Unemployment rate, Dec 2022: 4.0% — compared to 3.5% national
- 2018-2022 median home value change: 49.3% — compared to 39.7% nationwide
- Median home value, 2022: $251,800 — #189 highest out of 387
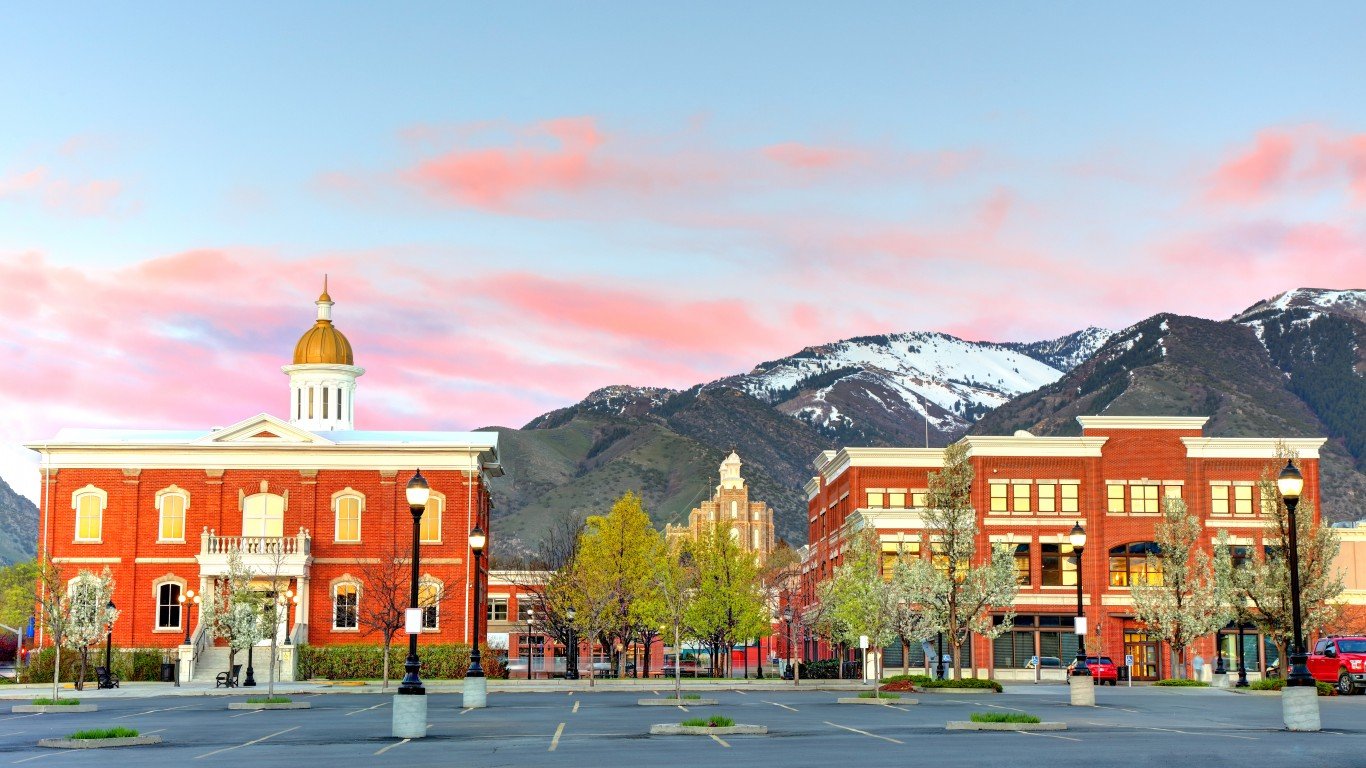
11. St. George, UT

- 2017-2022 pop. growth: 19.3% (32,018)
- 2022 population: 197,680 — #226 highest out of 387
- 2017 population: 165,662 — #253 highest out of 387
- 2017-2022 employment change: +21.8% — #2 largest increase of 257
- Unemployment rate, Dec 2022: 2.6% — compared to 3.5% national
- 2018-2022 median home value change: 68.8% — compared to 39.7% nationwide
- Median home value, 2022: $528,400 — #35 highest out of 387
10. Columbia, MO

- 2017-2022 pop. growth: 20.5% (36,478)
- 2022 population: 214,749 — #210 highest out of 387
- 2017 population: 178,271 — #236 highest out of 387
- 2017-2022 employment change: +3.2% — #158 largest increase of 257
- Unemployment rate, Dec 2022: 2.0% — compared to 3.5% national
- 2018-2022 median home value change: 30.4% — compared to 39.7% nationwide
- Median home value, 2022: $250,700 — #191 highest out of 387
9. Wausau-Weston, WI
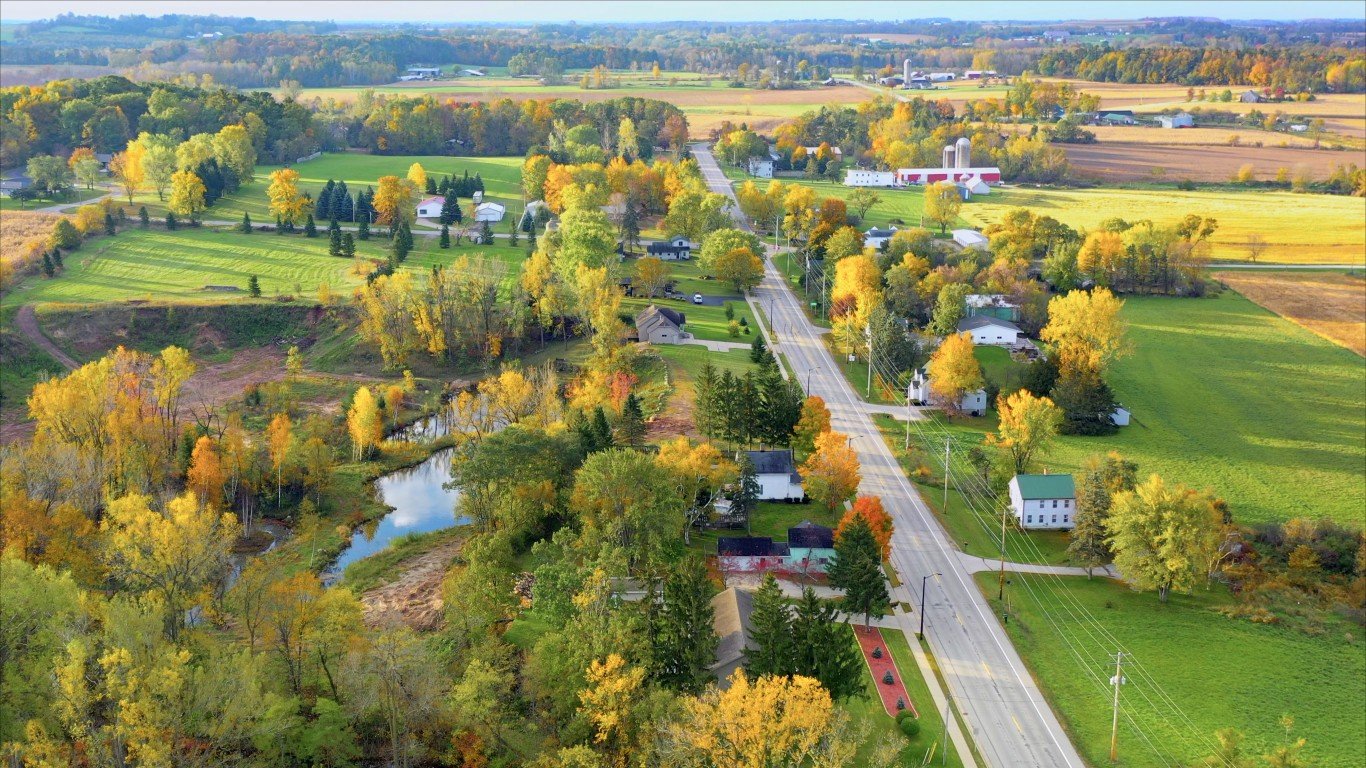
- 2017-2022 pop. growth: 22.5% (30,602)
- 2022 population: 166,334 — #257 highest out of 387
- 2017 population: 135,732 — #295 highest out of 387
- 2017-2022 employment change: -2.5% — #52 largest decrease of 115
- Unemployment rate, Dec 2022: 2.5% — compared to 3.5% national
- 2018-2022 median home value change: 19.3% — compared to 39.7% nationwide
- Median home value, 2022: $196,600 — #281 highest out of 387
8. Gainesville, FL
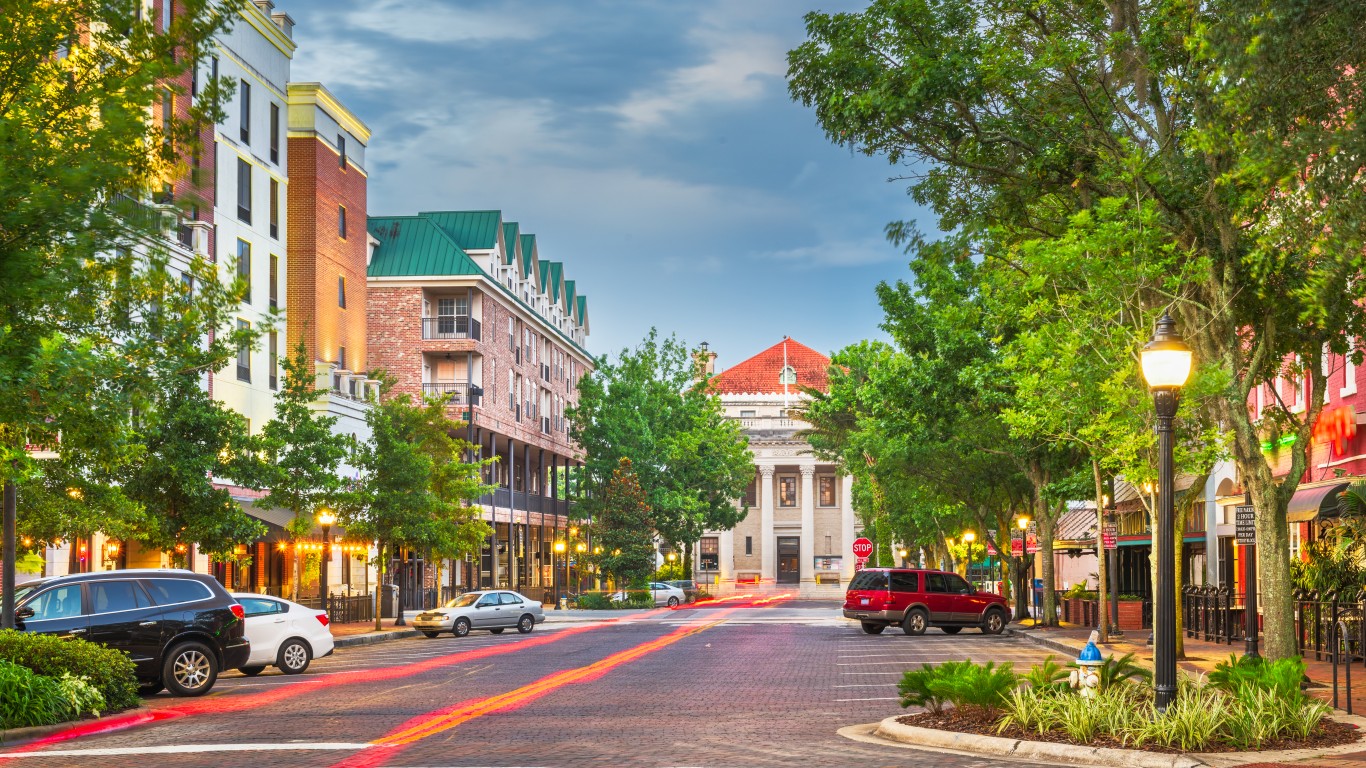
- 2017-2022 pop. growth: 23.0% (65,529)
- 2022 population: 350,903 — #150 highest out of 387
- 2017 population: 285,374 — #167 highest out of 387
- 2017-2022 employment change: +6.9% — #81 largest increase of 257
- Unemployment rate, Dec 2022: 2.6% — compared to 3.5% national
- 2018-2022 median home value change: 43.7% — compared to 39.7% nationwide
- Median home value, 2022: $264,500 — #174 highest out of 387
7. Morristown, TN
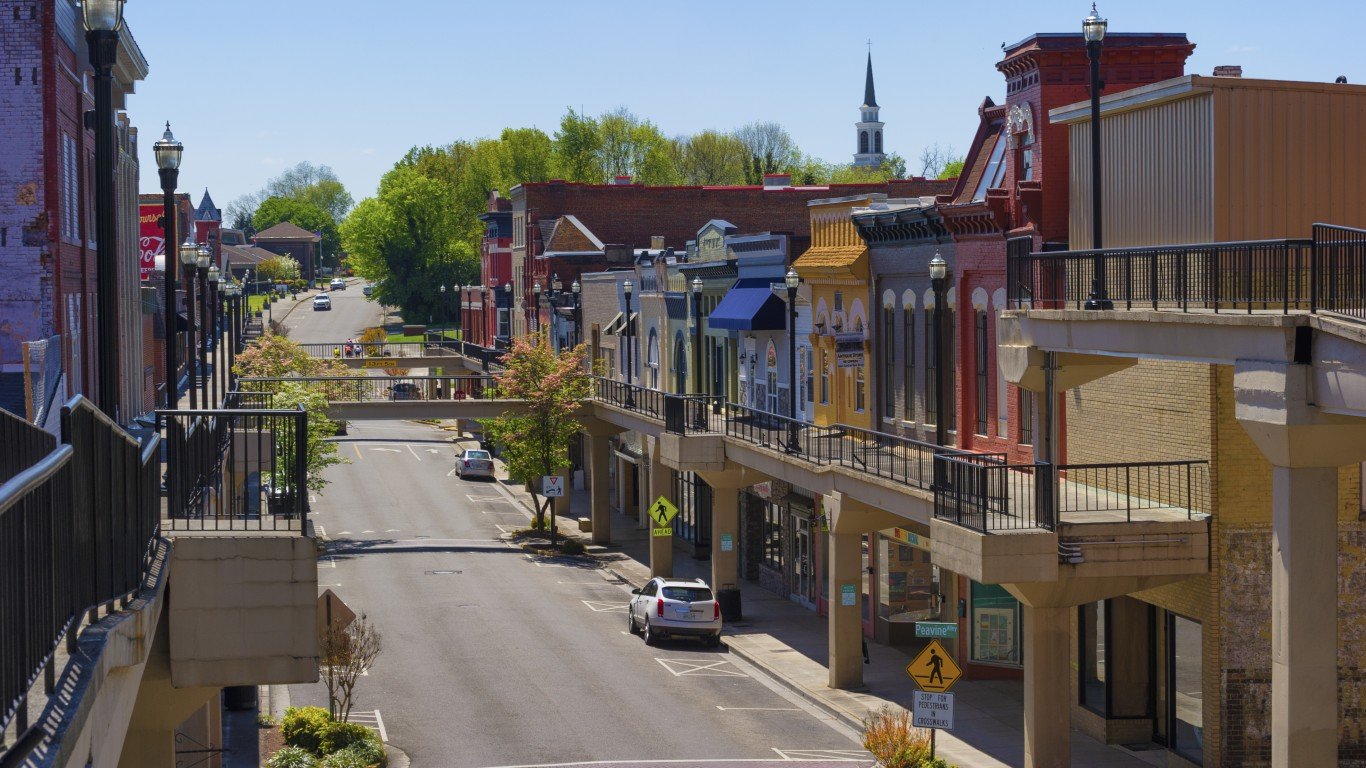
- 2017-2022 pop. growth: 23.8% (28,091)
- 2022 population: 146,172 — #286 highest out of 387
- 2017 population: 118,081 — #327 highest out of 387
- 2017-2022 employment change: +2.4% — #180 largest increase of 257
- Unemployment rate, Dec 2022: 3.6% — compared to 3.5% national
- 2018-2022 median home value change: 38.7% — compared to 39.7% nationwide
- Median home value, 2022: $203,500 — #265 highest out of 387
6. Sumter, SC

- 2017-2022 pop. growth: 26.3% (28,078)
- 2022 population: 134,925 — #302 highest out of 387
- 2017 population: 106,847 — #341 highest out of 387
- 2017-2022 employment change: -2.0% — #65 largest decrease of 115
- Unemployment rate, Dec 2022: 3.9% — compared to 3.5% national
- 2018-2022 median home value change: 41.2% — compared to 39.7% nationwide
- Median home value, 2022: $160,600 — #349 highest out of 387
5. Ames, IA

- 2017-2022 pop. growth: 29.5% (28,780)
- 2022 population: 126,282 — #317 highest out of 387
- 2017 population: 97,502 — #360 highest out of 387
- 2017-2022 employment change: +1.8% — #199 largest increase of 257
- Unemployment rate, Dec 2022: 2.1% — compared to 3.5% national
- 2018-2022 median home value change: 25.4% — compared to 39.7% nationwide
- Median home value, 2022: $239,900 — #205 highest out of 387
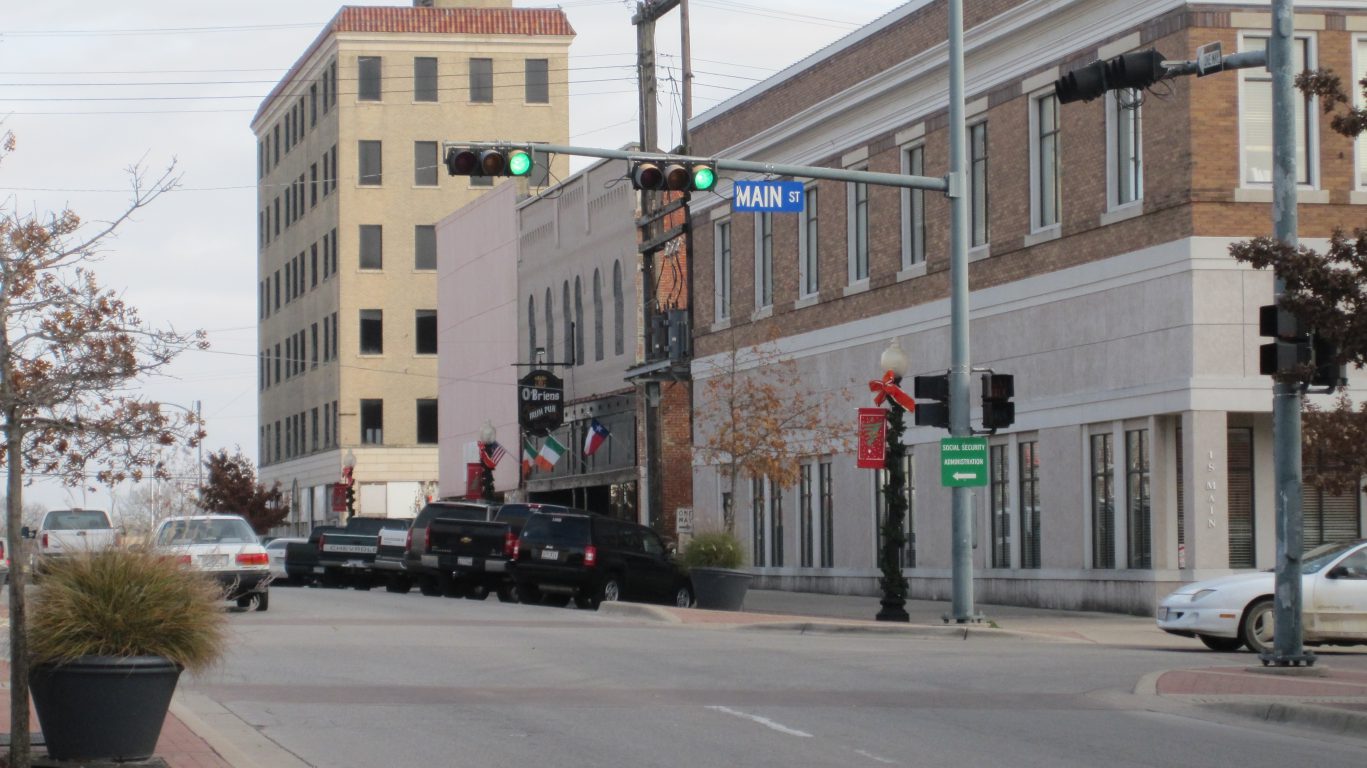
4. Longview, TX
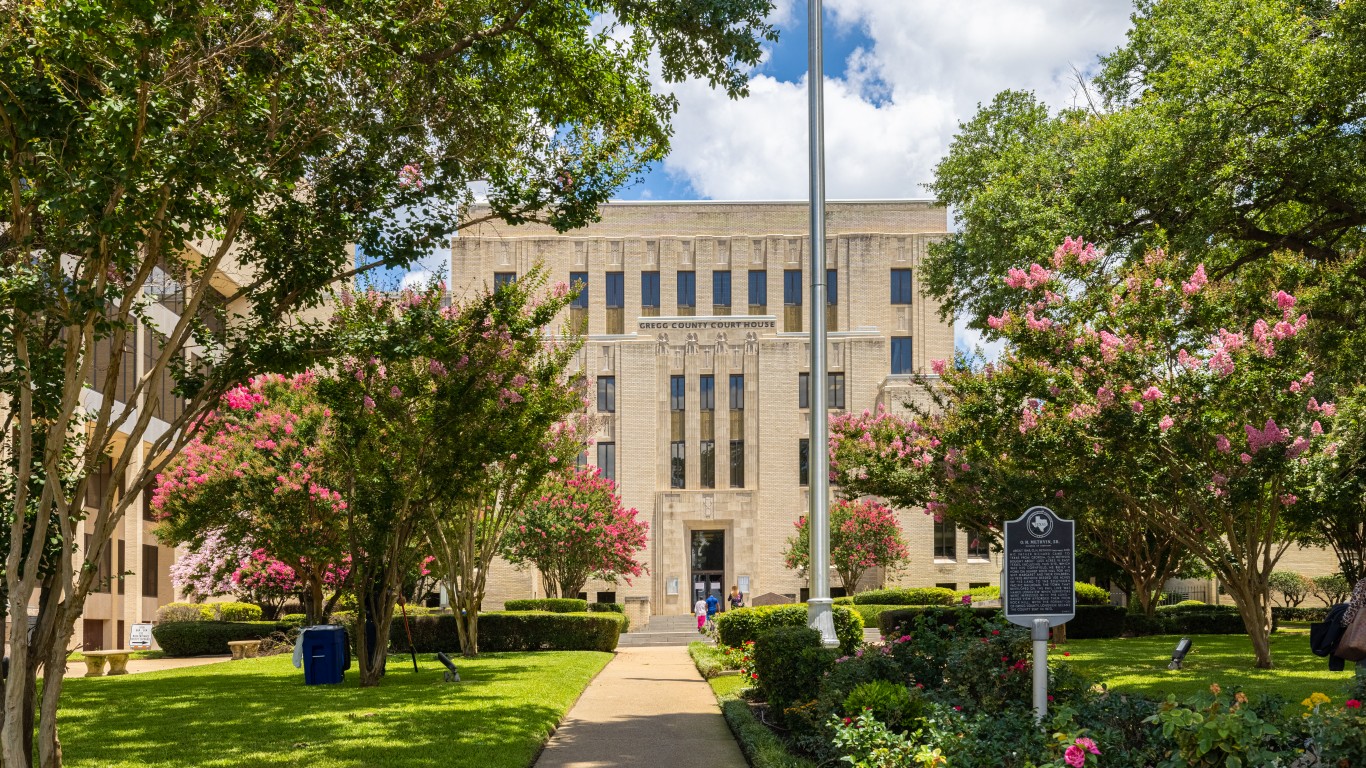
- 2017-2022 pop. growth: 33.9% (73,738)
- 2022 population: 291,219 — #170 highest out of 387
- 2017 population: 217,481 — #202 highest out of 387
- 2017-2022 employment change: +1.3% — #216 largest increase of 257
- Unemployment rate, Dec 2022: 4.1% — compared to 3.5% national
- 2018-2022 median home value change: 21.8% — compared to 39.7% nationwide
- Median home value, 2022: $167,600 — #332 highest out of 387
3. Manhattan, KS

- 2017-2022 pop. growth: 35.7% (34,992)
- 2022 population: 133,072 — #307 highest out of 387
- 2017 population: 98,080 — #358 highest out of 387
- 2017-2022 employment change: -0.3% — #110 largest decrease of 115
- Unemployment rate, Dec 2022: 2.8% — compared to 3.5% national
- 2018-2022 median home value change: 0.6% — compared to 39.7% nationwide
- Median home value, 2022: $214,000 — #247 highest out of 387
2. Fayetteville, NC
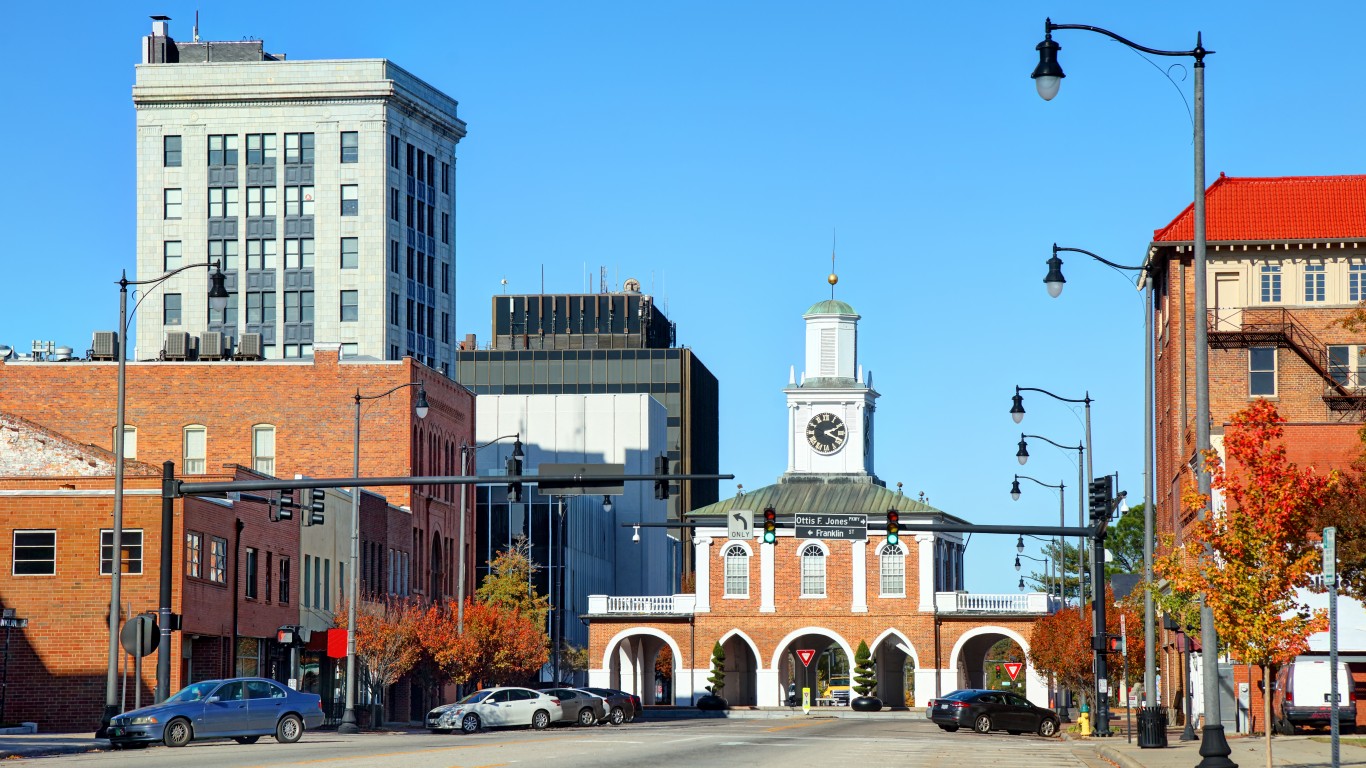
- 2017-2022 pop. growth: 36.9% (142,656)
- 2022 population: 529,318 — #107 highest out of 387
- 2017 population: 386,662 — #137 highest out of 387
- 2017-2022 employment change: +1.4% — #215 largest increase of 257
- Unemployment rate, Dec 2022: 5.1% — compared to 3.5% national
- 2018-2022 median home value change: 49.2% — compared to 39.7% nationwide
- Median home value, 2022: $206,900 — #260 highest out of 387
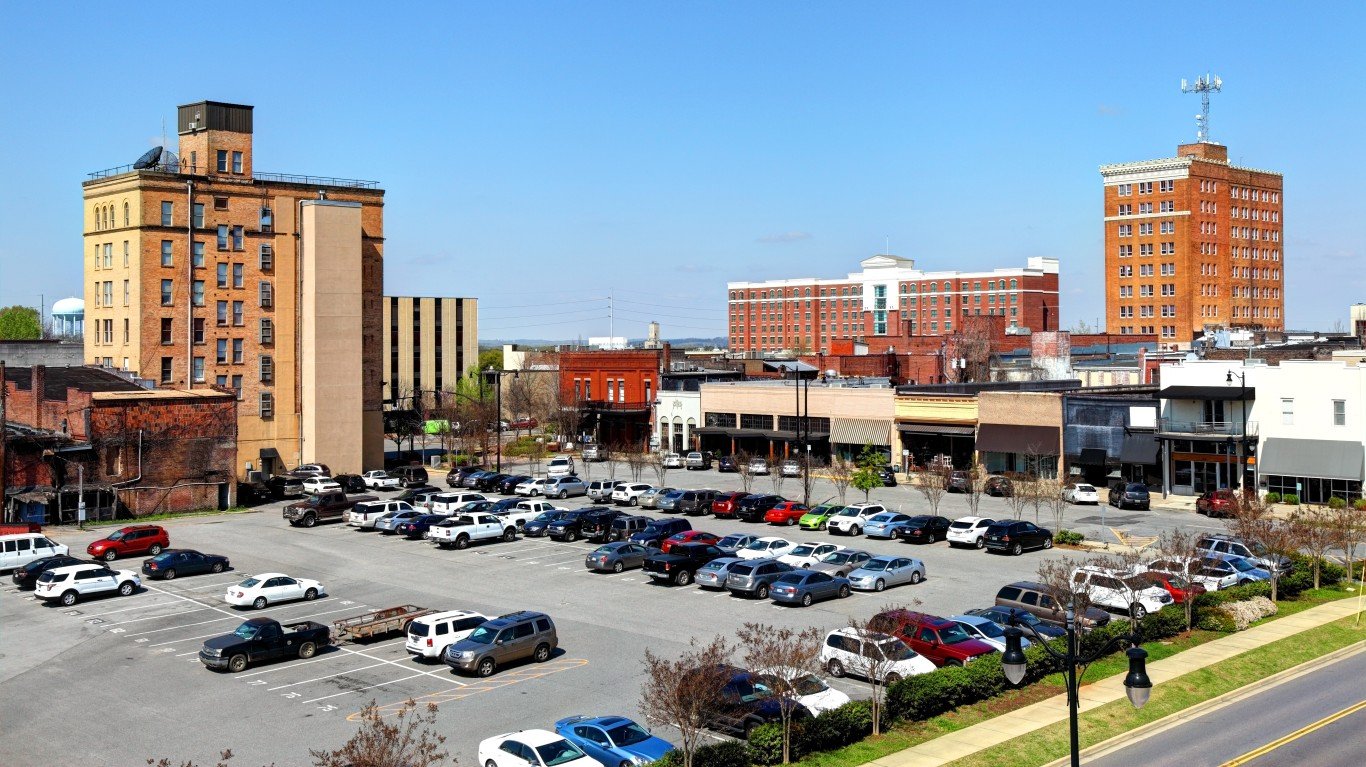
1. Jackson, TN

- 2017-2022 pop. growth: 40.5% (52,344)
- 2022 population: 181,579 — #238 highest out of 387
- 2017 population: 129,235 — #304 highest out of 387
- 2017-2022 employment change: +0.6% — #234 largest increase of 257
- Unemployment rate, Dec 2022: 3.4% — compared to 3.5% national
- 2018-2022 median home value change: 40.1% — compared to 39.7% nationwide
- Median home value, 2022: $174,100 — #321 highest out of 387
Take This Retirement Quiz To Get Matched With An Advisor Now (Sponsored)
Are you ready for retirement? Planning for retirement can be overwhelming, that’s why it could be a good idea to speak to a fiduciary financial advisor about your goals today.
Start by taking this retirement quiz right here from SmartAsset that will match you with up to 3 financial advisors that serve your area and beyond in 5 minutes. Smart Asset is now matching over 50,000 people a month.
Click here now to get started.
The post You’ve Never Heard of this Town, But It’s the Fastest Growing in the Country appeared first on 24/7 Wall St..