24/7 Wall St. Insights
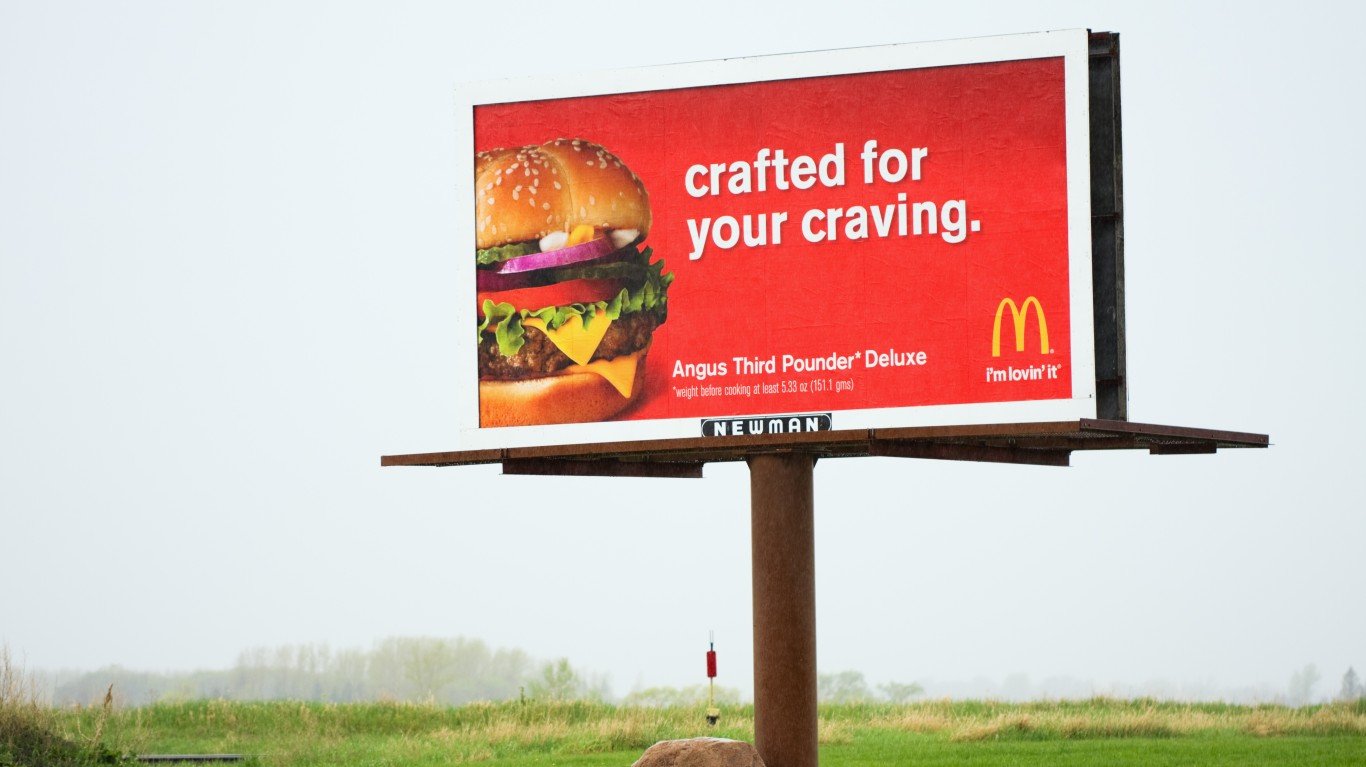
- In one state, you’ll pay 37.1% higher than the national average price for a Big Mac — are you ready to grab your wallet?
- The Big Mac Index was developed by the Economist as a measure of financial parity across borders.
- Higher fast food costs signal a higher cost of living, which can have detrimental effects on mental health (financial stress) or quality-of-life (housing issues).
- Also: 2 Dividend Legends to Hold Forever
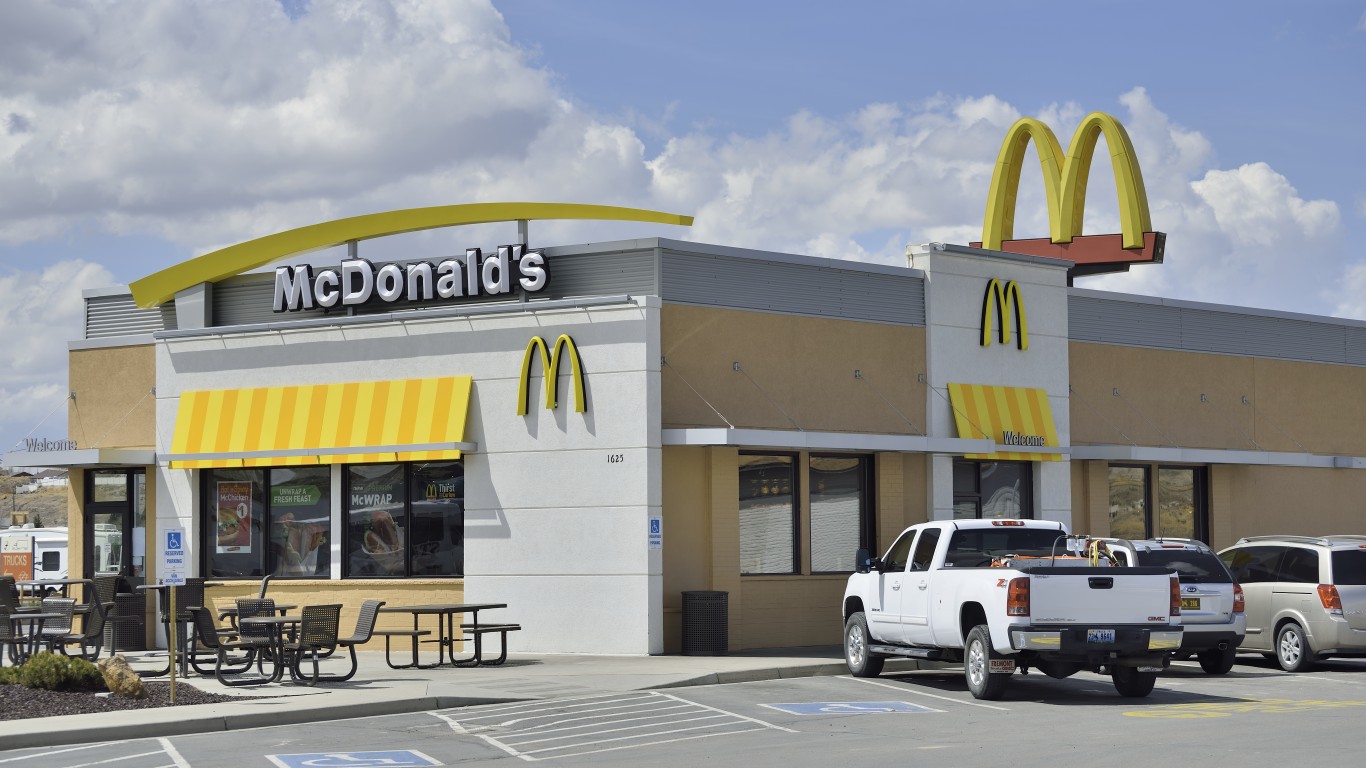
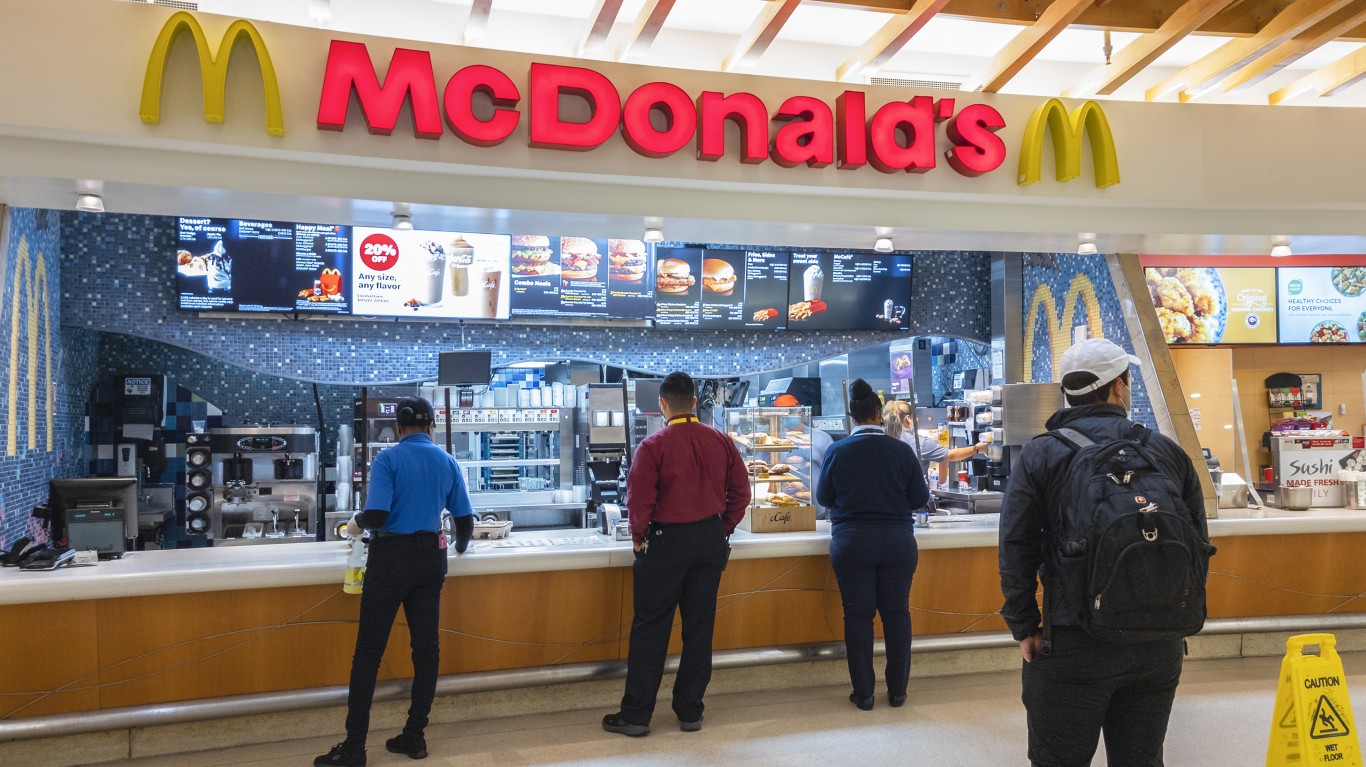
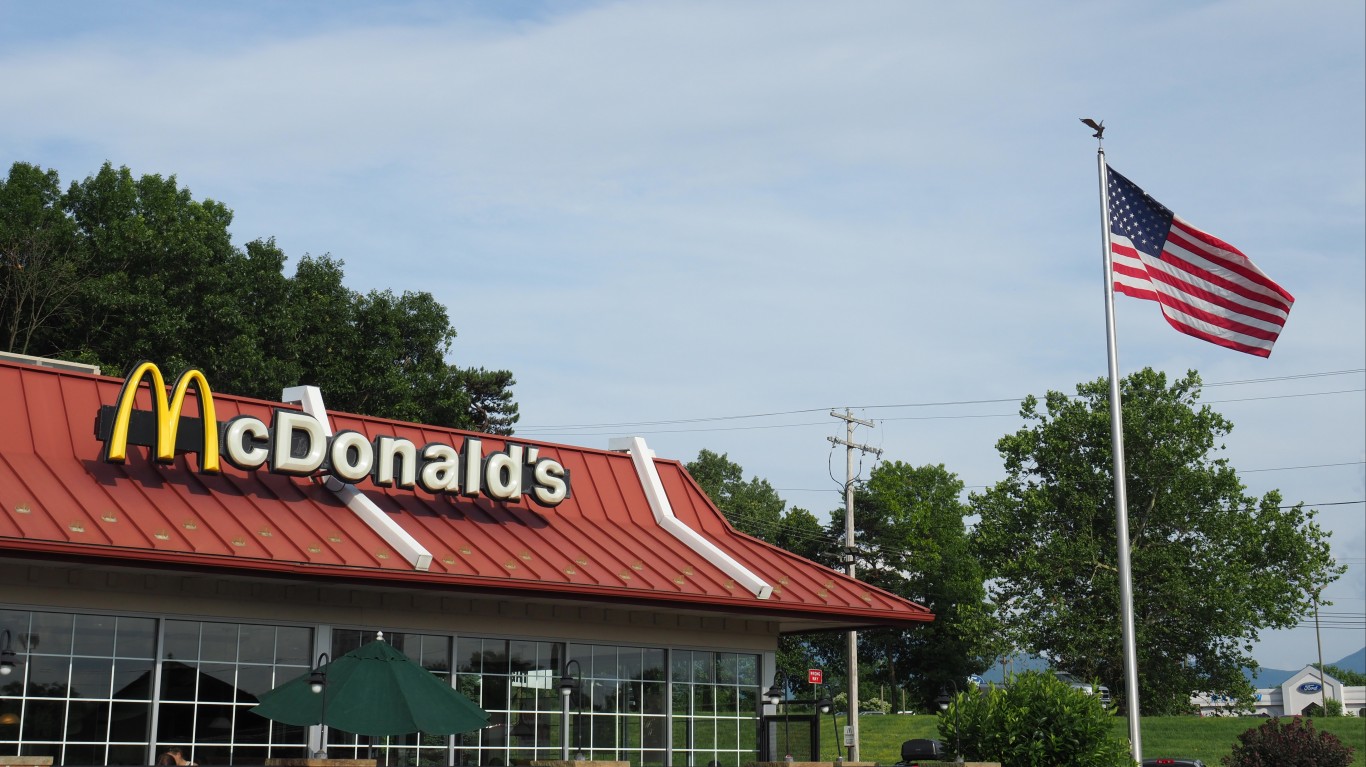
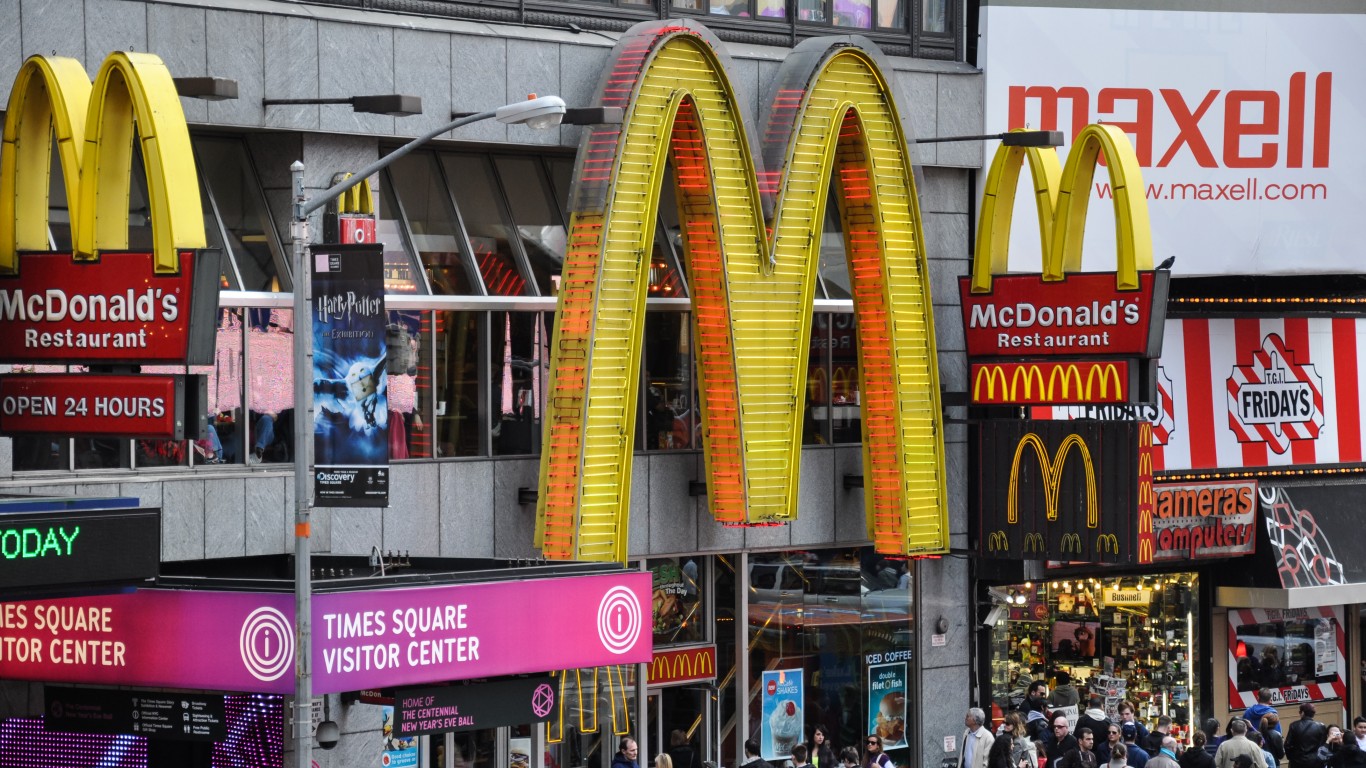
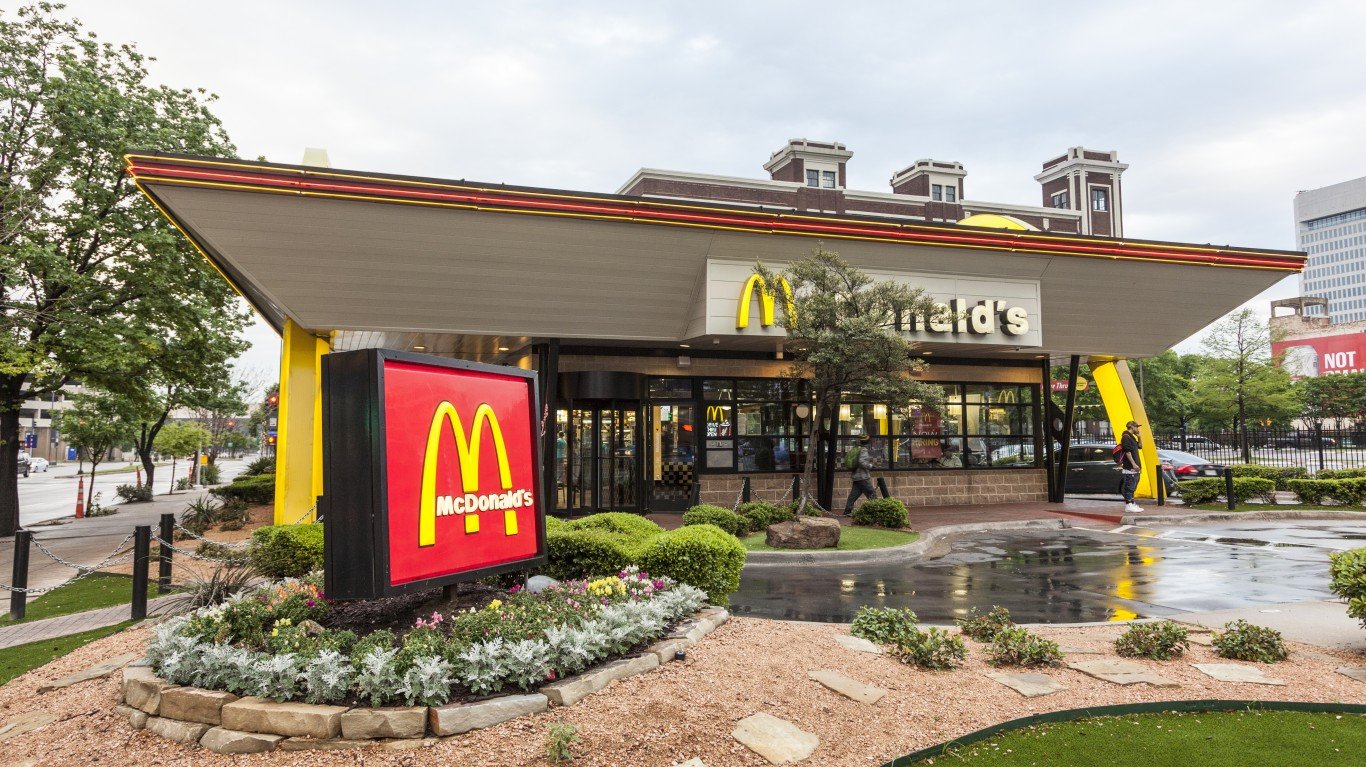
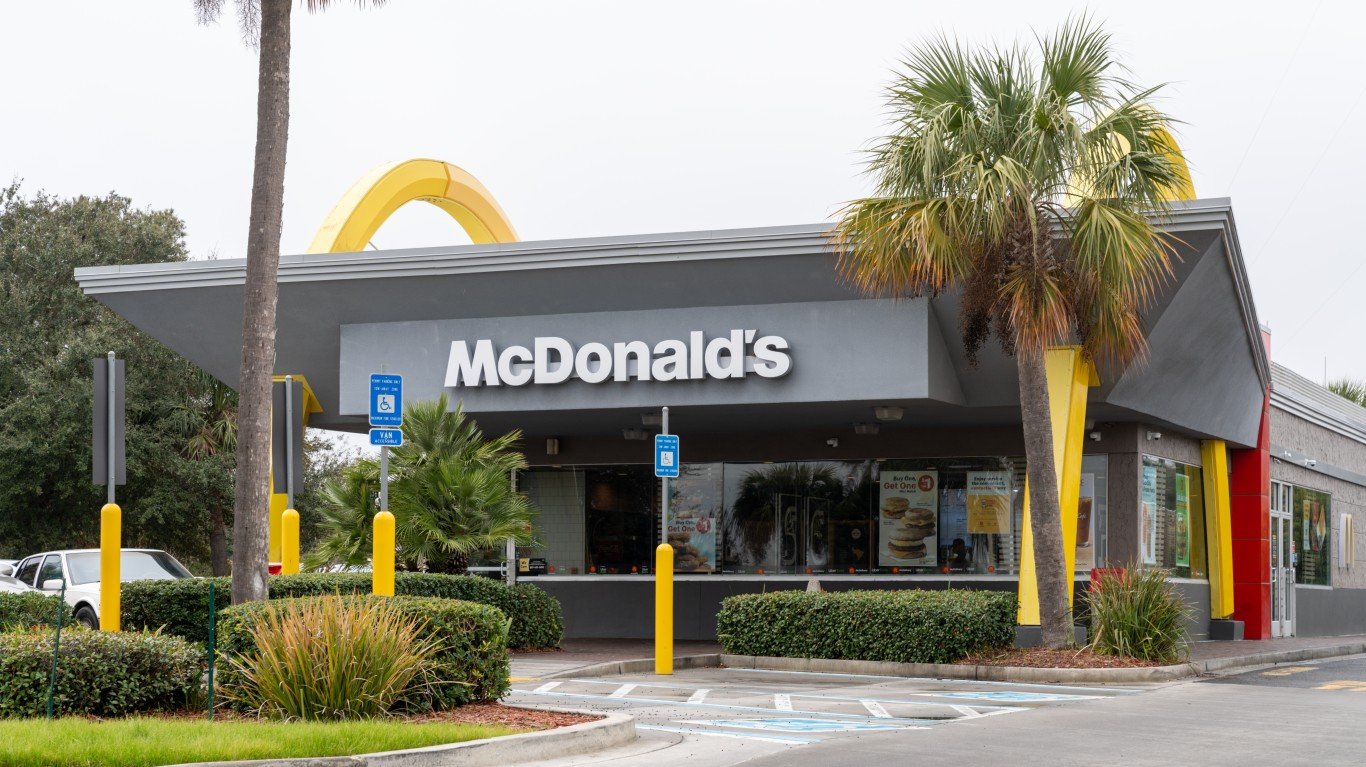
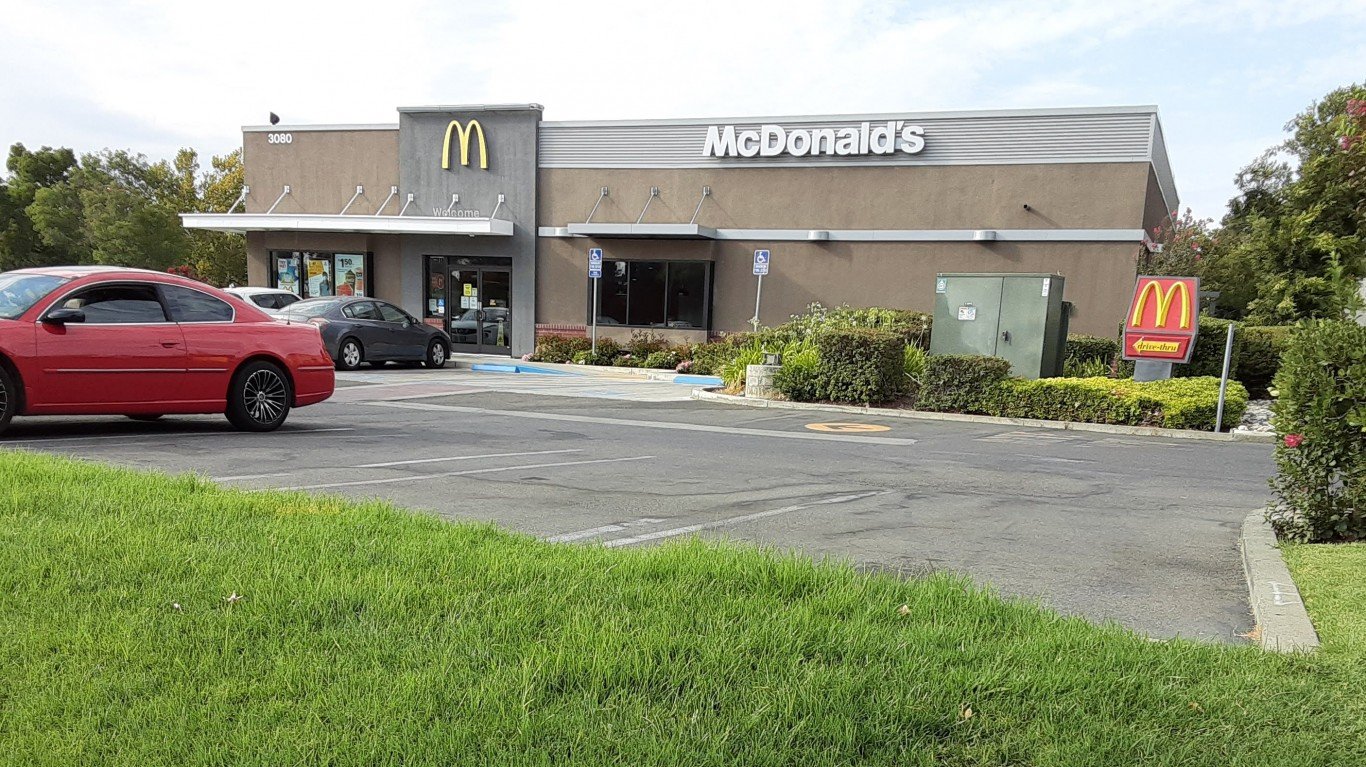
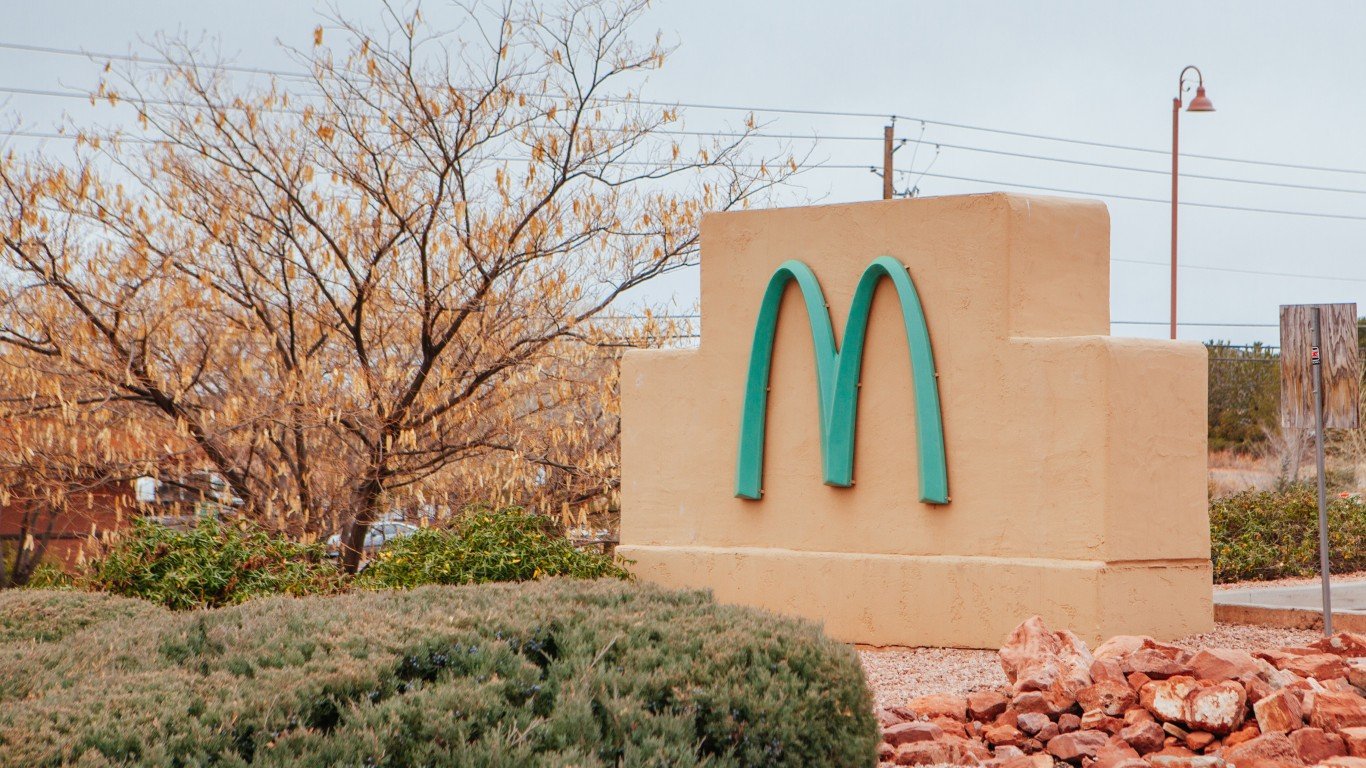
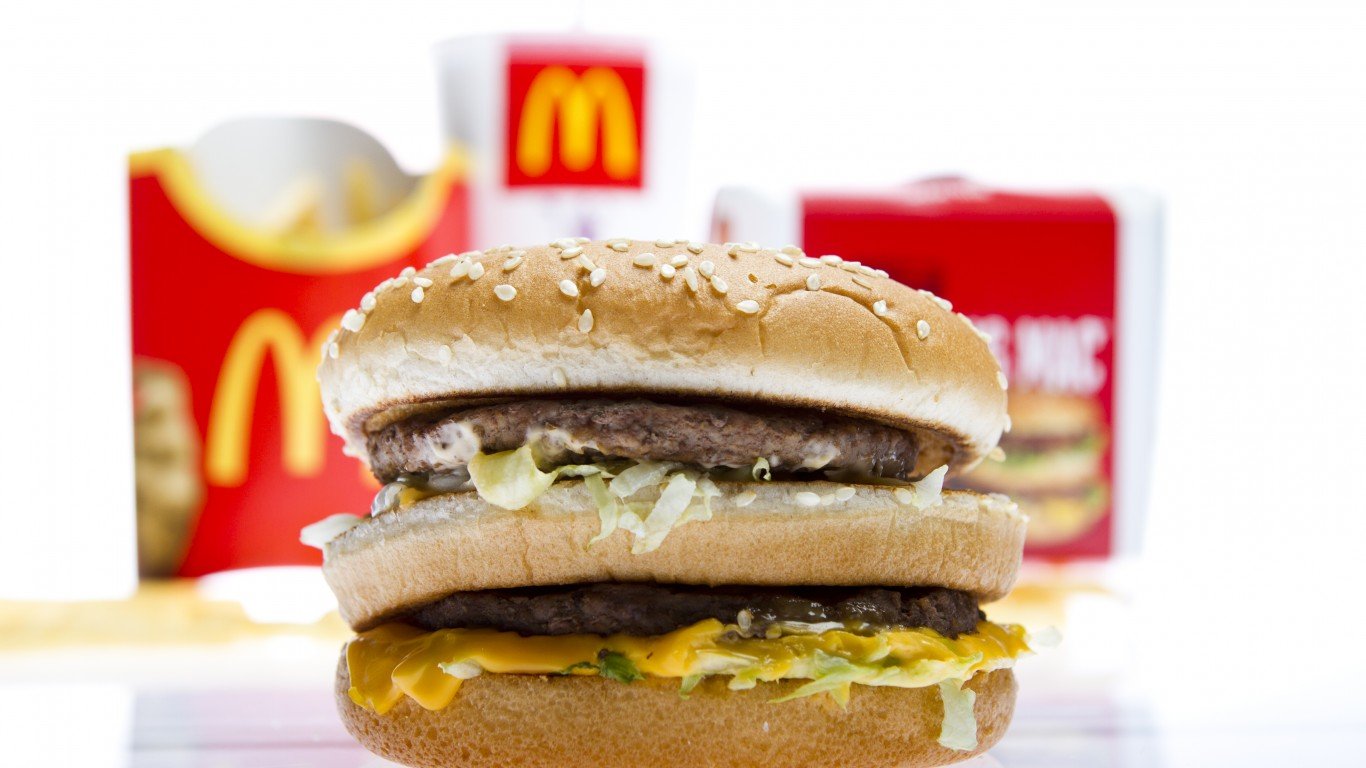
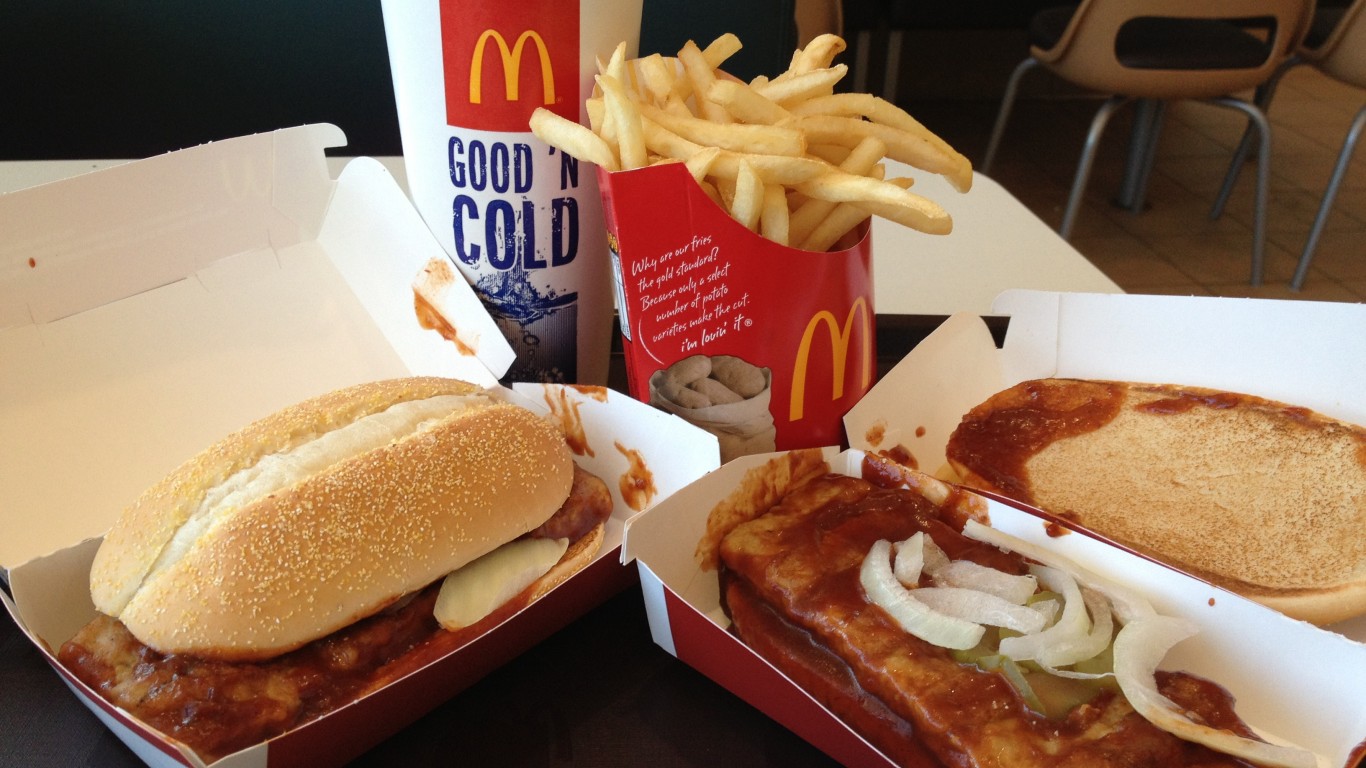
Introduced in 1967 in Pittsburgh, and in the greater United States the following year, McDonald’s’ Big Mac is synonymous with the fast food giant — and America’s love of delicious, convenient dining options. Made with two beef patties stacked with cheese, lettuce, onions, pickles, and that special sauce we all know and love, the Big Mac has captured the taste buds of millions. The price reflects both growing food and living costs across the country. In short, the Big Mac is actually a great indicator of economic trends. (Is the McDonald’s $5 value meal in trouble?)
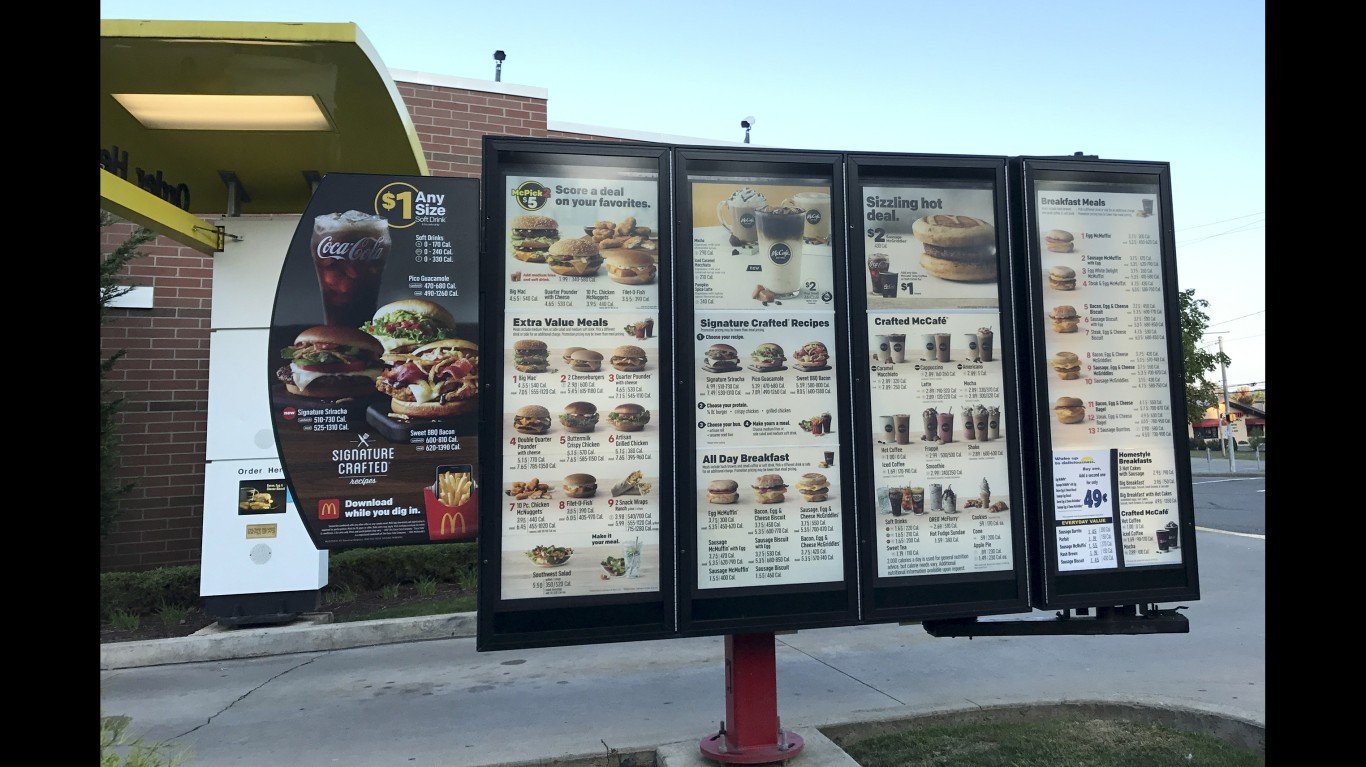
To this end, the Economist, a weekly newspaper focused on covering culture, politics, and international business, developed the Big Mac Index. By showing how the price of the Big Mac differs from state to state, and even across international borders, the Big Mac Index underscores financial parity. The current average Big Mac price is $5.17, though prices range between $4.19 and $7.09. After adjusting for income, taxes, and cost of living, the “true price” of a Big Mac ranges from $3.44 to $6.54. Using the Big Mac Index, this suggests that states with higher Big Mac costs may also have higher costs-of-living in general. Higher costs of living may correlate with higher levels of debt, hosuing challenges, and difficulties with savings. (These are the most expensive states to live in.)
To identify the “true cost” of a Big Mac in each state, 24/7 Wall St. adjusted the average price by the state’s disposable income per capita (income after taxes) and cost of living (based on regional price parities.) In other words, considering income, taxes, cost of living, and actual Big Mac price in each state — we calculated the true cost for residents living in that state. The 50 states were then ranked by the “true cost” of a Big Mac.
The prices for each state and the national average price of $5.17 came from Zippia’s How Much A Big Mac Costs In Every State and are as of August 2023. Disposable income per capita figures, which are income per capita figures after taxes, are for 2022 and came from the Bureau of Labor Statistics. The national per capita disposable income was $55,832 that year. Regional price parities for 2021, which express the cost of living in the state, are from the Bureau of Economic Analysis. Population data came from the Census Bureau’s 2022 American Community Survey. This is the most up-to-date information available at this time. Additionally, we should note the idea came from Pantry and Larder, though we took a different approach.
Why Are We Writing About the Big Mac?

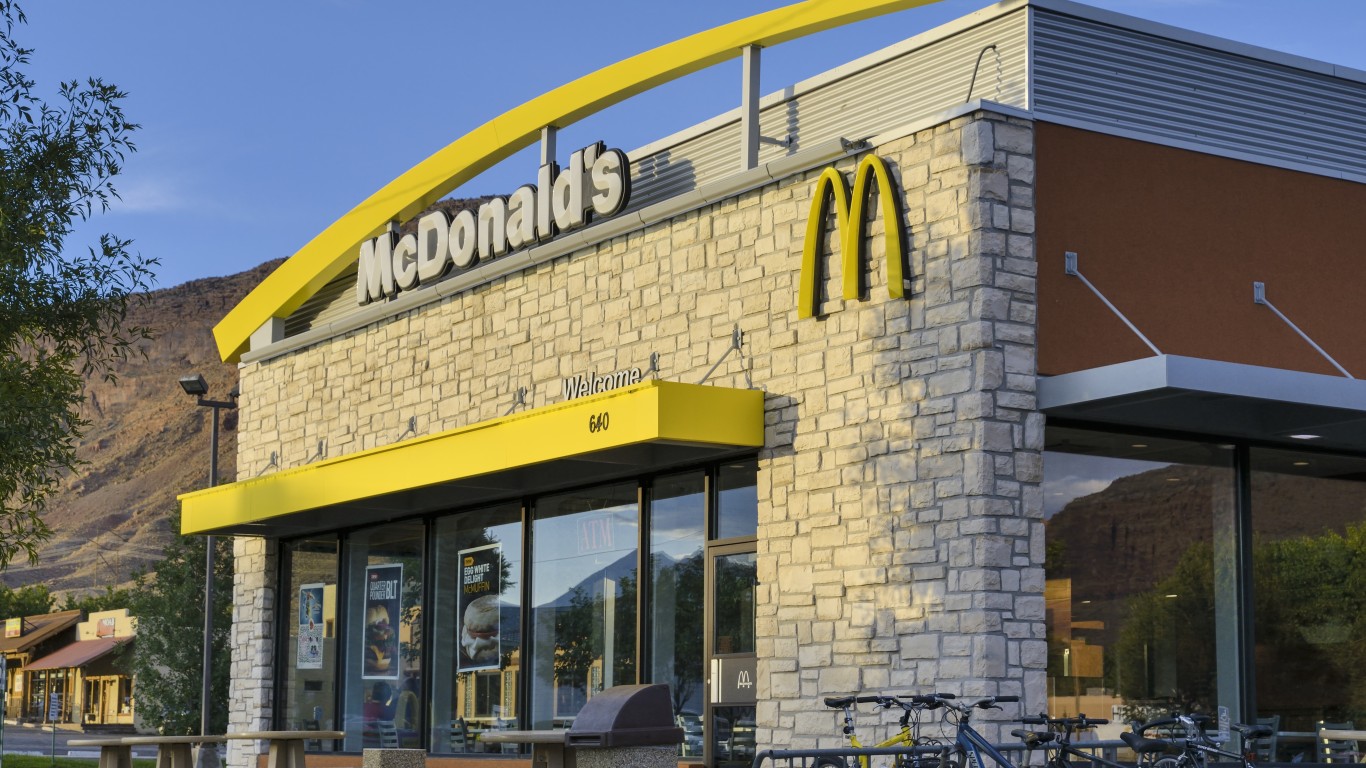
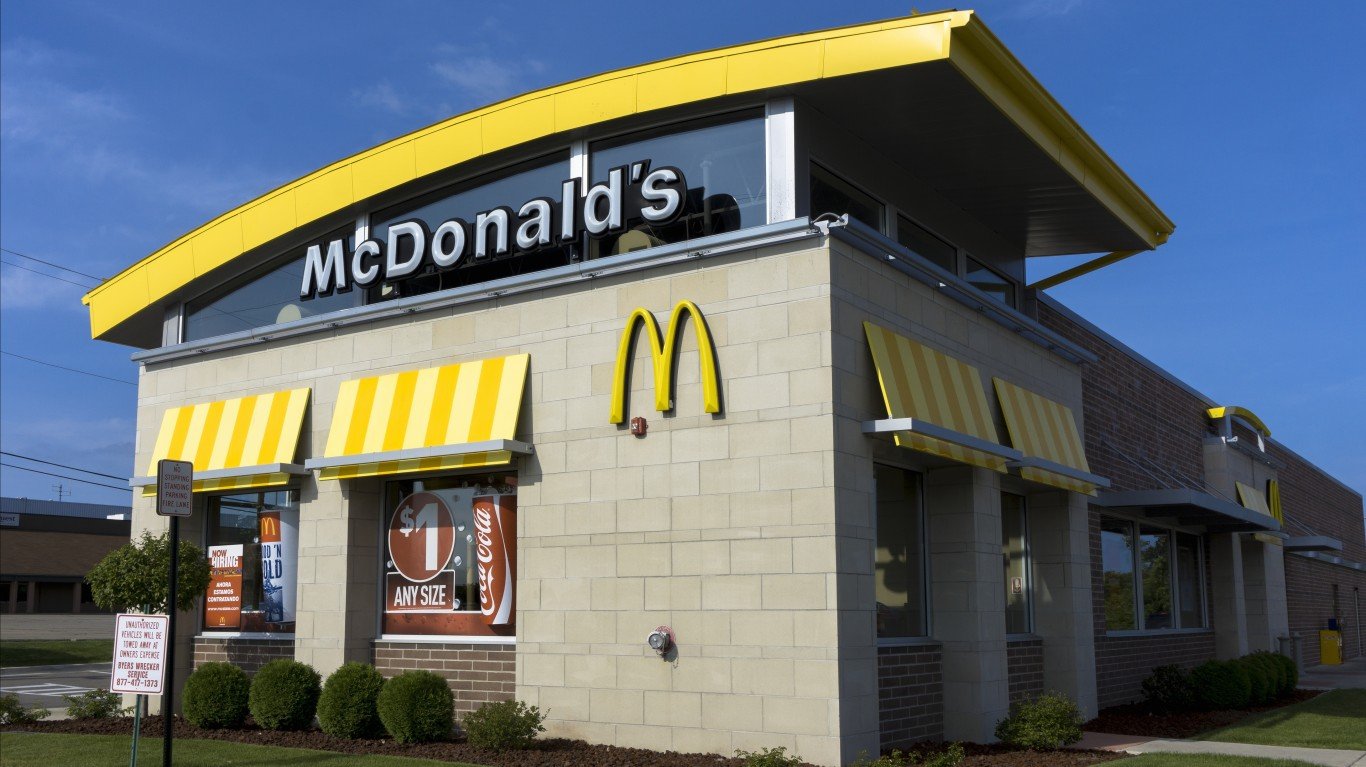
The Big Mac Index is just one of many ways economists assess the different factors that impact the “ordinary” person and how much money they have to spend. Since its opening in April 1955, McDonald’s has reigned supreme worldwide. With around 40,275 locations around the globe, it’s easy to see how many menu items are increasingly popular. The Big Mac was first introduced in 1967, and this popular burger has come a long way since. It is estimated that 900 million are sold annually globally, and 550 million are sold in the US alone. But with increasing inflation and cost-of-living, it could signal the downfall of fast food — especially if some options cost too much to handle.
Here are the states where a Big Mac is unaffordable:
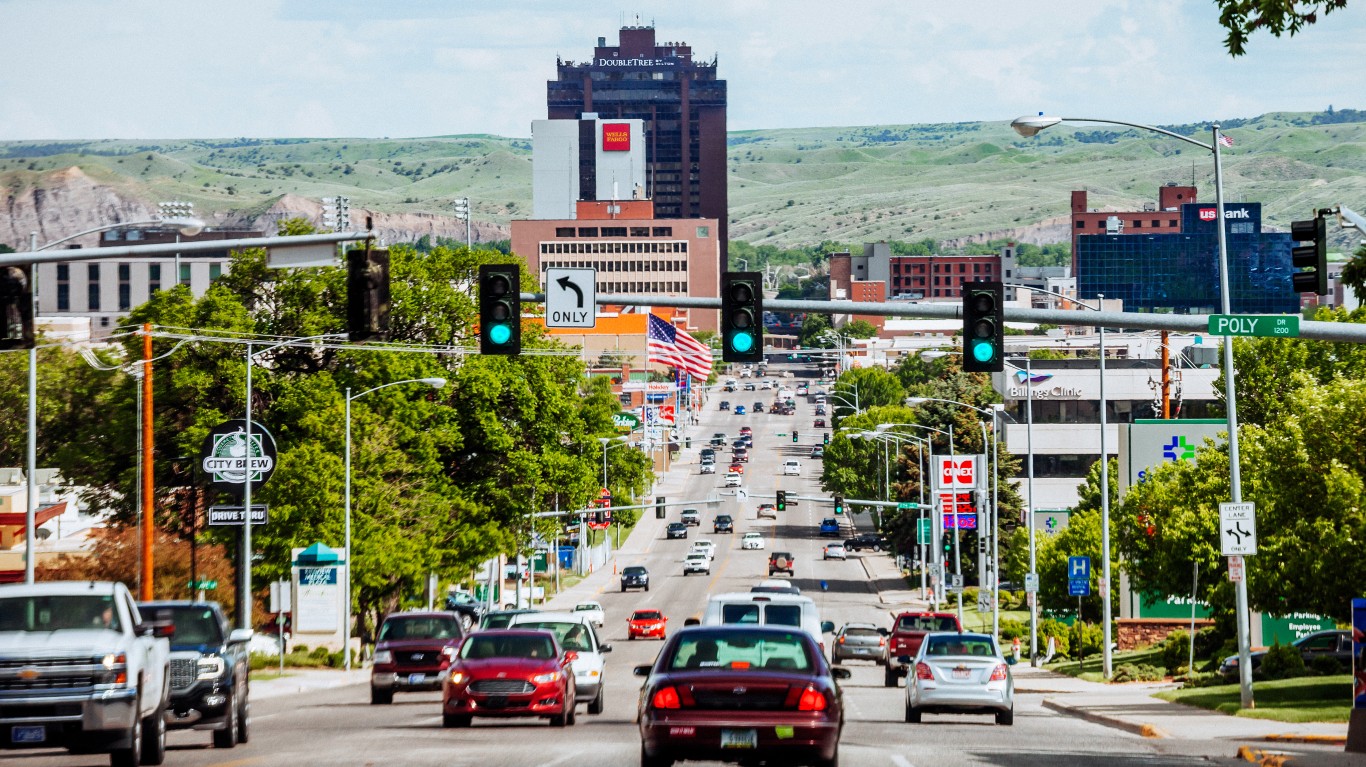
50. Wyoming
- “True cost” of a Big Mac considering income and cost of living: $3.44
- Actual price of a Big Mac, Aug 2023: $4.19, 19.0% lower than national avg price – 2nd lowest
- Disposable income, 2022: $62,227, 11.5% higher than national avg – 9th highest
- Cost of living, 2021: 8.6% lower than national avg – 14th lowest
- Population, 2022: 581,381
49. South Dakota
- “True cost” of a Big Mac considering income and cost of living: $3.83
- Actual price of a Big Mac, Aug 2023: $4.54, 12.2% lower than national avg price – 12th lowest
- Disposable income, 2022: $59,688, 6.9% higher than national avg – 11th highest
- Cost of living, 2021: 9.9% lower than national avg – 7th lowest
- Population, 2022: 909,824
48. Nebraska
- “True cost” of a Big Mac considering income and cost of living: $3.94
- Actual price of a Big Mac, Aug 2023: $4.29, 17.0% lower than national avg price – 6th lowest
- Disposable income, 2022: $55,766, 0.1% lower than national avg – 19th highest
- Cost of living, 2021: 8.2% lower than national avg – 16th lowest
- Population, 2022: 1,967,923
47. Pennsylvania
- “True cost” of a Big Mac considering income and cost of living: $4.12
- Actual price of a Big Mac, Aug 2023: $4.29, 17.0% lower than national avg price – 6th lowest
- Disposable income, 2022: $56,034, 0.4% higher than national avg – 18th highest
- Cost of living, 2021: 3.6% lower than national avg – 23rd highest
- Population, 2022: 12,972,008
46. Washington
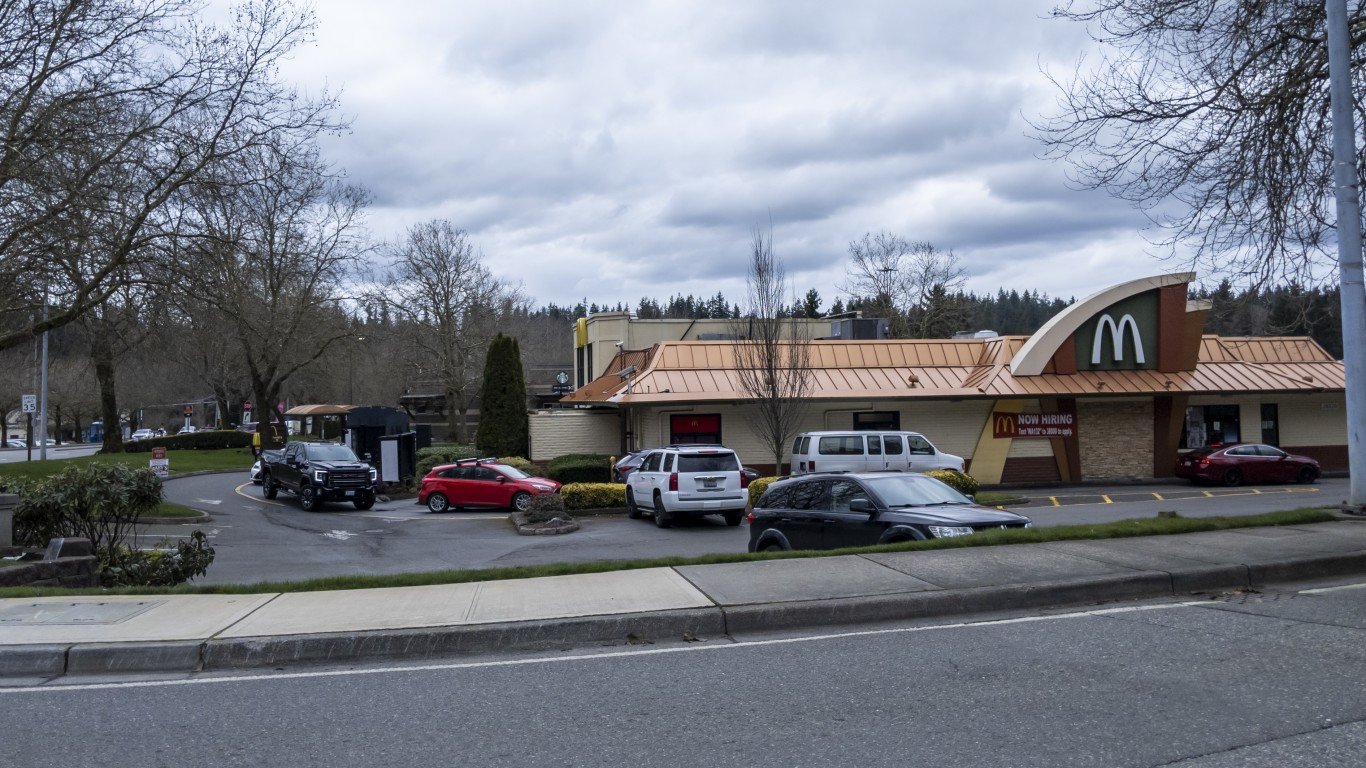
- “True cost” of a Big Mac considering income and cost of living: $4.19
- Actual price of a Big Mac, Aug 2023: $4.49, 13.2% lower than national avg price – 11th lowest
- Disposable income, 2022: $65,210, 16.8% higher than national avg – 4th highest
- Cost of living, 2021: 8.9% higher than national avg – 5th highest
- Population, 2022: 7,785,786
45. Kansas
- “True cost” of a Big Mac considering income and cost of living: $4.35
- Actual price of a Big Mac, Aug 2023: $4.49, 13.2% lower than national avg price – 11th lowest
- Disposable income, 2022: $52,484, 6.0% lower than national avg – 23rd lowest
- Cost of living, 2021: 8.8% lower than national avg – 12th lowest
- Population, 2022: 2,937,150
44. Ohio
- “True cost” of a Big Mac considering income and cost of living: $4.38
- Actual price of a Big Mac, Aug 2023: $4.29, 17.0% lower than national avg price – 6th lowest
- Disposable income, 2022: $50,577, 9.4% lower than national avg – 18th lowest
- Cost of living, 2021: 7.5% lower than national avg – 19th lowest
- Population, 2022: 11,756,058
43. North Carolina
- “True cost” of a Big Mac considering income and cost of living: $4.41
- Actual price of a Big Mac, Aug 2023: $4.19, 19.0% lower than national avg price – 2nd lowest
- Disposable income, 2022: $49,728, 10.9% lower than national avg – 16th lowest
- Cost of living, 2021: 6.2% lower than national avg – 23rd lowest
- Population, 2022: 10,698,973
42. Florida
- “True cost” of a Big Mac considering income and cost of living: $4.45
- Actual price of a Big Mac, Aug 2023: $4.29, 17.0% lower than national avg price – 6th lowest
- Disposable income, 2022: $54,596, 2.2% lower than national avg – 21st highest
- Cost of living, 2021: 1.4% higher than national avg – 15th highest
- Population, 2022: 22,244,823
41. Indiana
- “True cost” of a Big Mac considering income and cost of living: $4.48
- Actual price of a Big Mac, Aug 2023: $4.40, 14.9% lower than national avg price – 8th lowest
- Disposable income, 2022: $50,796, 9.0% lower than national avg – 19th lowest
- Cost of living, 2021: 7.3% lower than national avg – 20th lowest
- Population, 2022: 6,833,037
40. Iowa
- “True cost” of a Big Mac considering income and cost of living: $4.50
- Actual price of a Big Mac, Aug 2023: $4.69, 9.3% lower than national avg price – 17th lowest
- Disposable income, 2022: $52,071, 6.7% lower than national avg – 20th lowest
- Cost of living, 2021: 10.4% lower than national avg – 5th lowest
- Population, 2022: 3,200,517
39. Wisconsin

- “True cost” of a Big Mac considering income and cost of living: $4.51
- Actual price of a Big Mac, Aug 2023: $4.59, 11.2% lower than national avg price – 13th lowest
- Disposable income, 2022: $53,062, 5.0% lower than national avg – 25th highest
- Cost of living, 2021: 6.7% lower than national avg – 21st lowest
- Population, 2022: 5,892,539
38. Nevada
- “True cost” of a Big Mac considering income and cost of living: $4.51
- Actual price of a Big Mac, Aug 2023: $4.49, 13.2% lower than national avg price – 11th lowest
- Disposable income, 2022: $53,076, 4.9% lower than national avg – 24th highest
- Cost of living, 2021: 4.5% lower than national avg – 25th highest
- Population, 2022: 3,177,772
37. Minnesota
- “True cost” of a Big Mac considering income and cost of living: $4.60
- Actual price of a Big Mac, Aug 2023: $4.80, 7.2% lower than national avg price – 21st lowest
- Disposable income, 2022: $57,359, 2.7% higher than national avg – 16th highest
- Cost of living, 2021: 1.6% lower than national avg – 19th highest
- Population, 2022: 5,717,184
36. Utah
- “True cost” of a Big Mac considering income and cost of living: $4.67
- Actual price of a Big Mac, Aug 2023: $4.39, 15.1% lower than national avg price – 7th lowest
- Disposable income, 2022: $49,632, 11.1% lower than national avg – 15th lowest
- Cost of living, 2021: 5.4% lower than national avg – 25th lowest
- Population, 2022: 3,380,800
35. North Dakota

- “True cost” of a Big Mac considering income and cost of living: $4.67
- Actual price of a Big Mac, Aug 2023: $5.39, 4.3% higher than national avg price – 17th highest
- Disposable income, 2022: $58,659, 5.1% higher than national avg – 13th highest
- Cost of living, 2021: 8.9% lower than national avg – 11th lowest
- Population, 2022: 779,261
34. Oklahoma
- “True cost” of a Big Mac considering income and cost of living: $4.79
- Actual price of a Big Mac, Aug 2023: $4.69, 9.3% lower than national avg price – 17th lowest
- Disposable income, 2022: $49,398, 11.5% lower than national avg – 12th lowest
- Cost of living, 2021: 9.7% lower than national avg – 8th lowest
- Population, 2022: 4,019,800
33. Louisiana
- “True cost” of a Big Mac considering income and cost of living: $4.89
- Actual price of a Big Mac, Aug 2023: $4.69, 9.3% lower than national avg price – 17th lowest
- Disposable income, 2022: $48,882, 12.4% lower than national avg – 9th lowest
- Cost of living, 2021: 8.7% lower than national avg – 13th lowest
- Population, 2022: 4,590,241
32. Virginia
- “True cost” of a Big Mac considering income and cost of living: $4.93
- Actual price of a Big Mac, Aug 2023: $4.99, 3.5% lower than national avg price – 24th lowest
- Disposable income, 2022: $57,789, 3.5% higher than national avg – 15th highest
- Cost of living, 2021: 2.3% higher than national avg – 13th highest
- Population, 2022: 8,683,619
31. Tennessee
- “True cost” of a Big Mac considering income and cost of living: $4.94
- Actual price of a Big Mac, Aug 2023: $5.09, 1.5% lower than national avg price – 25th highest
- Disposable income, 2022: $52,262, 6.4% lower than national avg – 22nd lowest
- Cost of living, 2021: 9.1% lower than national avg – 10th lowest
- Population, 2022: 7,051,339
30. Connecticut

- “True cost” of a Big Mac considering income and cost of living: $5.04
- Actual price of a Big Mac, Aug 2023: $6.09, 17.8% higher than national avg price – 6th highest
- Disposable income, 2022: $69,247, 24.0% higher than national avg – 2nd highest
- Cost of living, 2021: 2.6% higher than national avg – 11th highest
- Population, 2022: 3,626,205
29. Kentucky
- “True cost” of a Big Mac considering income and cost of living: $5.07
- Actual price of a Big Mac, Aug 2023: $4.69, 9.3% lower than national avg price – 17th lowest
- Disposable income, 2022: $46,016, 17.6% lower than national avg – 4th lowest
- Cost of living, 2021: 10.9% lower than national avg – 3rd lowest
- Population, 2022: 4,512,310
28. Michigan
- “True cost” of a Big Mac considering income and cost of living: $5.12
- Actual price of a Big Mac, Aug 2023: $4.79, 7.4% lower than national avg price – 20th lowest
- Disposable income, 2022: $49,256, 11.8% lower than national avg – 10th lowest
- Cost of living, 2021: 5.7% lower than national avg – 24th lowest
- Population, 2022: 10,034,118
27. New York
- “True cost” of a Big Mac considering income and cost of living: $5.12
- Actual price of a Big Mac, Aug 2023: $5.29, 2.3% higher than national avg price – 21st highest
- Disposable income, 2022: $63,118, 13.0% higher than national avg – 7th highest
- Cost of living, 2021: 9.5% higher than national avg – 3rd highest
- Population, 2022: 19,677,151
26. Alabama
- “True cost” of a Big Mac considering income and cost of living: $5.13
- Actual price of a Big Mac, Aug 2023: $4.70, 9.1% lower than national avg price – 18th lowest
- Disposable income, 2022: $45,079, 19.3% lower than national avg – 3rd lowest
- Cost of living, 2021: 11.9% lower than national avg – 2nd lowest
- Population, 2022: 5,074,296
25. Maryland
- “True cost” of a Big Mac considering income and cost of living: $5.19
- Actual price of a Big Mac, Aug 2023: $5.19, 0.4% higher than national avg price – 22nd highest
- Disposable income, 2022: $59,307, 6.2% higher than national avg – 12th highest
- Cost of living, 2021: 6.2% higher than national avg – 7th highest
- Population, 2022: 6,164,660
24. Colorado
- “True cost” of a Big Mac considering income and cost of living: $5.20
- Actual price of a Big Mac, Aug 2023: $5.69, 10.1% higher than national avg price – 11th highest
- Disposable income, 2022: $62,984, 12.8% higher than national avg – 8th highest
- Cost of living, 2021: 3.0% higher than national avg – 10th highest
- Population, 2022: 5,839,926
23. Montana
- “True cost” of a Big Mac considering income and cost of living: $5.31
- Actual price of a Big Mac, Aug 2023: $5.19, 0.4% higher than national avg price – 22nd highest
- Disposable income, 2022: $49,936, 10.6% lower than national avg – 17th lowest
- Cost of living, 2021: 8.4% lower than national avg – 15th lowest
- Population, 2022: 1,122,867
22. New Jersey

- “True cost” of a Big Mac considering income and cost of living: $5.36
- Actual price of a Big Mac, Aug 2023: $5.79, 12.0% higher than national avg price – 10th highest
- Disposable income, 2022: $65,844, 17.9% higher than national avg – 3rd highest
- Cost of living, 2021: 9.1% higher than national avg – 4th highest
- Population, 2022: 9,261,699
21. Oregon

- “True cost” of a Big Mac considering income and cost of living: $5.39
- Actual price of a Big Mac, Aug 2023: $5.00, 3.3% lower than national avg price – 25th lowest
- Disposable income, 2022: $53,361, 4.4% lower than national avg – 23rd highest
- Cost of living, 2021: 3.0% higher than national avg – 9th highest
- Population, 2022: 4,240,137
20. Texas
- “True cost” of a Big Mac considering income and cost of living: $5.41
- Actual price of a Big Mac, Aug 2023: $5.36, 3.7% higher than national avg price – 19th highest
- Disposable income, 2022: $54,488, 2.4% lower than national avg – 22nd highest
- Cost of living, 2021: 1.5% lower than national avg – 18th highest
- Population, 2022: 30,029,572
19. New Mexico
- “True cost” of a Big Mac considering income and cost of living: $5.41
- Actual price of a Big Mac, Aug 2023: $4.99, 3.5% lower than national avg price – 24th lowest
- Disposable income, 2022: $46,270, 17.1% lower than national avg – 6th lowest
- Cost of living, 2021: 10.1% lower than national avg – 6th lowest
- Population, 2022: 2,113,344
18. South Carolina
- “True cost” of a Big Mac considering income and cost of living: $5.48
- Actual price of a Big Mac, Aug 2023: $4.89, 5.4% lower than national avg price – 22nd lowest
- Disposable income, 2022: $46,720, 16.3% lower than national avg – 7th lowest
- Cost of living, 2021: 6.3% lower than national avg – 22nd lowest
- Population, 2022: 5,282,634
17. West Virginia

- “True cost” of a Big Mac considering income and cost of living: $5.52
- Actual price of a Big Mac, Aug 2023: $4.79, 7.4% lower than national avg price – 20th lowest
- Disposable income, 2022: $43,972, 21.2% lower than national avg – 2nd lowest
- Cost of living, 2021: 9.2% lower than national avg – 9th lowest
- Population, 2022: 1,775,156
16. New Hampshire

- “True cost” of a Big Mac considering income and cost of living: $5.55
- Actual price of a Big Mac, Aug 2023: $6.29, 21.7% higher than national avg price – 3rd highest
- Disposable income, 2022: $64,826, 16.1% higher than national avg – 5th highest
- Cost of living, 2021: 2.5% higher than national avg – 12th highest
- Population, 2022: 1,395,231
15. Georgia
- “True cost” of a Big Mac considering income and cost of living: $5.56
- Actual price of a Big Mac, Aug 2023: $5.15, 0.4% lower than national avg price – 24th highest
- Disposable income, 2022: $49,538, 11.3% lower than national avg – 14th lowest
- Cost of living, 2021: 4.2% lower than national avg – 24th highest
- Population, 2022: 10,912,876
14. Delaware

- “True cost” of a Big Mac considering income and cost of living: $5.69
- Actual price of a Big Mac, Aug 2023: $5.49, 6.2% higher than national avg price – 14th highest
- Disposable income, 2022: $52,591, 5.8% lower than national avg – 25th lowest
- Cost of living, 2021: 2.3% lower than national avg – 20th highest
- Population, 2022: 1,018,396
13. Idaho
- “True cost” of a Big Mac considering income and cost of living: $5.77
- Actual price of a Big Mac, Aug 2023: $5.39, 4.3% higher than national avg price – 17th highest
- Disposable income, 2022: $47,859, 14.3% lower than national avg – 8th lowest
- Cost of living, 2021: 8.2% lower than national avg – 17th lowest
- Population, 2022: 1,939,033
12. California
- “True cost” of a Big Mac considering income and cost of living: $5.82
- Actual price of a Big Mac, Aug 2023: $5.89, 13.9% higher than national avg price – 9th highest
- Disposable income, 2022: $63,219, 13.2% higher than national avg – 6th highest
- Cost of living, 2021: 11.8% higher than national avg – 2nd highest
- Population, 2022: 39,029,342
11. Illinois
- “True cost” of a Big Mac considering income and cost of living: $5.90
- Actual price of a Big Mac, Aug 2023: $6.09, 17.8% higher than national avg price – 6th highest
- Disposable income, 2022: $58,437, 4.7% higher than national avg – 14th highest
- Cost of living, 2021: 1.4% higher than national avg – 16th highest
- Population, 2022: 12,582,032
10. Missouri
- “True cost” of a Big Mac considering income and cost of living: $5.92
- Actual price of a Big Mac, Aug 2023: $5.69, 10.1% higher than national avg price – 11th highest
- Disposable income, 2022: $49,367, 11.6% lower than national avg – 11th lowest
- Cost of living, 2021: 8.0% lower than national avg – 18th lowest
- Population, 2022: 6,177,957
9. Arkansas
- “True cost” of a Big Mac considering income and cost of living: $5.93
- Actual price of a Big Mac, Aug 2023: $5.49, 6.2% higher than national avg price – 14th highest
- Disposable income, 2022: $46,218, 17.2% lower than national avg – 5th lowest
- Cost of living, 2021: 10.6% lower than national avg – 4th lowest
- Population, 2022: 3,045,637
8. Rhode Island
- “True cost” of a Big Mac considering income and cost of living: $6.06
- Actual price of a Big Mac, Aug 2023: $5.99, 15.9% higher than national avg price – 8th highest
- Disposable income, 2022: $56,289, 0.8% higher than national avg – 17th highest
- Cost of living, 2021: 2.1% higher than national avg – 14th highest
- Population, 2022: 1,093,734
7. Massachusetts
- “True cost” of a Big Mac considering income and cost of living: $6.09
- Actual price of a Big Mac, Aug 2023: $7.09, 37.1% higher than national avg price – the highest
- Disposable income, 2022: $69,316, 24.2% higher than national avg – the highest
- Cost of living, 2021: 6.6% higher than national avg – 6th highest
- Population, 2022: 6,981,974
6. Arizona
- “True cost” of a Big Mac considering income and cost of living: $6.10
- Actual price of a Big Mac, Aug 2023: $5.59, 8.1% higher than national avg price – 13th highest
- Disposable income, 2022: $49,493, 11.4% lower than national avg – 13th lowest
- Cost of living, 2021: 3.3% lower than national avg – 22nd highest
- Population, 2022: 7,359,197
5. Alaska
- “True cost” of a Big Mac considering income and cost of living: $6.11
- Actual price of a Big Mac, Aug 2023: $6.50, 25.7% higher than national avg price – 2nd highest
- Disposable income, 2022: $62,045, 11.1% higher than national avg – 10th highest
- Cost of living, 2021: 4.4% higher than national avg – 8th highest
- Population, 2022: 733,583
4. Mississippi

- “True cost” of a Big Mac considering income and cost of living: $6.23
- Actual price of a Big Mac, Aug 2023: $5.40, 4.4% higher than national avg price – 16th highest
- Disposable income, 2022: $41,887, 25.0% lower than national avg – the lowest
- Cost of living, 2021: 13.4% lower than national avg – the lowest
- Population, 2022: 2,940,057
3. Vermont
- “True cost” of a Big Mac considering income and cost of living: $6.33
- Actual price of a Big Mac, Aug 2023: $6.29, 21.7% higher than national avg price – 3rd highest
- Disposable income, 2022: $54,714, 2.0% lower than national avg – 20th highest
- Cost of living, 2021: 1.3% lower than national avg – 17th highest
- Population, 2022: 647,064
2. Hawaii
- “True cost” of a Big Mac considering income and cost of living: $6.39
- Actual price of a Big Mac, Aug 2023: $5.31, 2.7% higher than national avg price – 20th highest
- Disposable income, 2022: $52,515, 5.9% lower than national avg – 24th lowest
- Cost of living, 2021: 13.2% higher than national avg – the highest
- Population, 2022: 1,440,196
1. Maine
- “True cost” of a Big Mac considering income and cost of living: $6.54
- Actual price of a Big Mac, Aug 2023: $6.29, 21.7% higher than national avg price – 3rd highest
- Disposable income, 2022: $52,236, 6.4% lower than national avg – 21st lowest
- Cost of living, 2021: 2.8% lower than national avg – 21st highest
- Population, 2022: 1,385,340
ALERT: Take This Retirement Quiz Now (Sponsored)
Take the quiz below to get matched with a financial advisor today.
Each advisor has been vetted by SmartAsset and is held to a fiduciary standard to act in your best interests.
Here’s how it works:
1. Answer SmartAsset advisor match quiz
2. Review your pre-screened matches at your leisure. Check out the advisors’ profiles.
3. Speak with advisors at no cost to you. Have an introductory call on the phone or introduction in person and choose whom to work with in the future
Take the retirement quiz right here.
The post The Price of This Famous Sandwich Is Getting Absurd appeared first on 24/7 Wall St..