24/7 Wall St. Insights
- Out of the 40 cities where the middle class is shrinking, six are in California, five in Florida, and four in Texas — but none of these are where the middle class is shrinking the most.
- The median family income ranges among the cities on the list from $52,443 to $116,103.
- The erosion of the middle class can lead to many negative changes in a city, from less spending and business downturns to shifts in neighborhood populations.
- Also: 2 Dividend Legends to Hold Forever
In 2024, a Gallup poll revealed that 54% of Americans identified themselves as belonging to the middle class. While there’s no concrete definition of “middle class,” the Gallup poll did identify factors that make people consider themselves middle class. Those who self-identified as middle class were more likely to make between $40,000 to $99,999 per year, be ages 18 to 54, and have a political affiliation as Republican or Independent — though Democrats are steadily rising in this category. With inflation significantly changing our understanding of finances — and how much everyone needs to live comfortably — more people are adopting the middle class as their defined social class. (Don’t let the talking heads fool you: inflation is running rampant.)
The average income of the middle class has also shrunk over time, from 62% in 1970. Alternately, those who consider themselves as upper class saw aggregate income increase from 29% to 50%. This is widening the divide between social classes, leading to a phenomenon known as “the missing middle.” So where do we see the middle class shrinking the most, and how is this affecting the way our society progresses?
To determine the cities where the middle class is shrinking, 24/7 Wall St. reviewed five-year data on family income from the U.S. Census Bureau’s American Community Survey. Cities were ranked based on the percentage-point change in the share of family households residing in middle-income census tracts from 2012 to 2022. Middle-income census tracts were defined as census tracts in which the median family income is within 25% of the median family income for the city as a whole. Only census tracts that spatially overlap with city boundaries by at least 50% were considered. Census tract and place boundaries were sourced from the U.S. Census Bureau. Only cities with at least 150,000 residents were considered in our analysis.
Most of the cities on the list, where the middle class shrank the most in the past decade, are not very large cities, with between 150,000 to 250,000 residents. Interestingly, while some might assume that in places where the middle class is shrinking the lower-income class would be increasing, this is not always the case. In many of the places on the list, the share of families in the upper-income class rose during that time, sometimes this happened even as the share of families in the lower-income classes fell, and sometimes when it rose.
Why We Need to Talk About the Middle Class

For as long as many people can remember, the middle class represents the backbone of American society. But this is becoming less and less commonly the case. The middle class’ decline in different cities represents significant changes. This trend often signals some level of income inequality, with more stratification between high-earning and low-earning workers. These changes can also affect everything from the education system to the job market, affecting how the city itself grows and progresses.
Here are the 40 cities where the middle class is shrinking:
40. New Orleans, Louisiana

- Change in share of families in middle-income tracts, 2012 to 2022: -2.7 ppts.
- Change in share of families in upper-income tracts, 2012 to 2022: +8.0 ppts.
- Change in share of families in lower-income tracts, 2012 to 2022: -5.3 ppts.
- Median family income, 2022: $73,549
- Total population, 2022: 380,408
39. Pembroke Pines, Florida
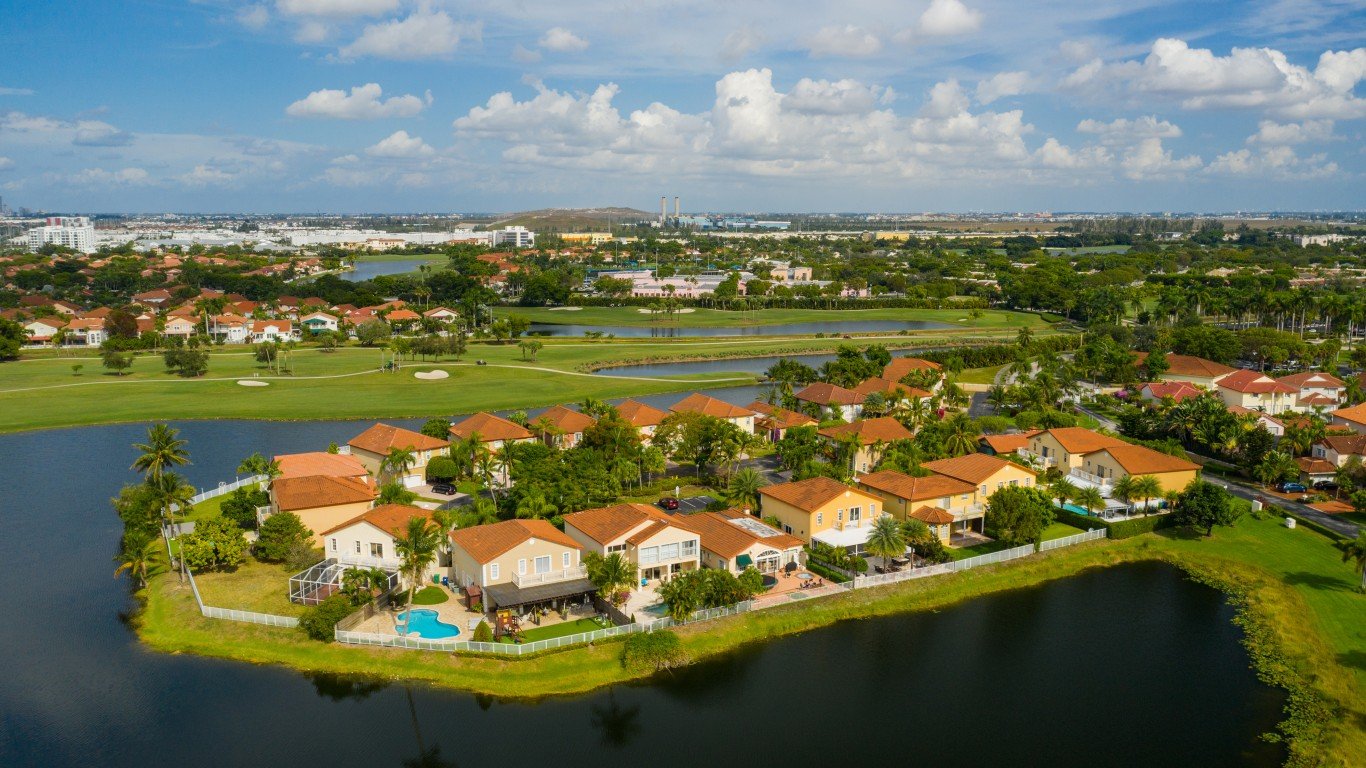
- Change in share of families in middle-income tracts, 2012 to 2022: -2.8 ppts.
- Change in share of families in upper-income tracts, 2012 to 2022: -1.9 ppts.
- Change in share of families in lower-income tracts, 2012 to 2022: +4.6 ppts.
- Median family income, 2022: $94,525
- Total population, 2022: 170,472
38. Des Moines, Iowa

- Change in share of families in middle-income tracts, 2012 to 2022: -2.9 ppts.
- Change in share of families in upper-income tracts, 2012 to 2022: -1.8 ppts.
- Change in share of families in lower-income tracts, 2012 to 2022: +4.7 ppts.
- Median family income, 2022: $76,602
- Total population, 2022: 213,164
37. Portland, Oregon
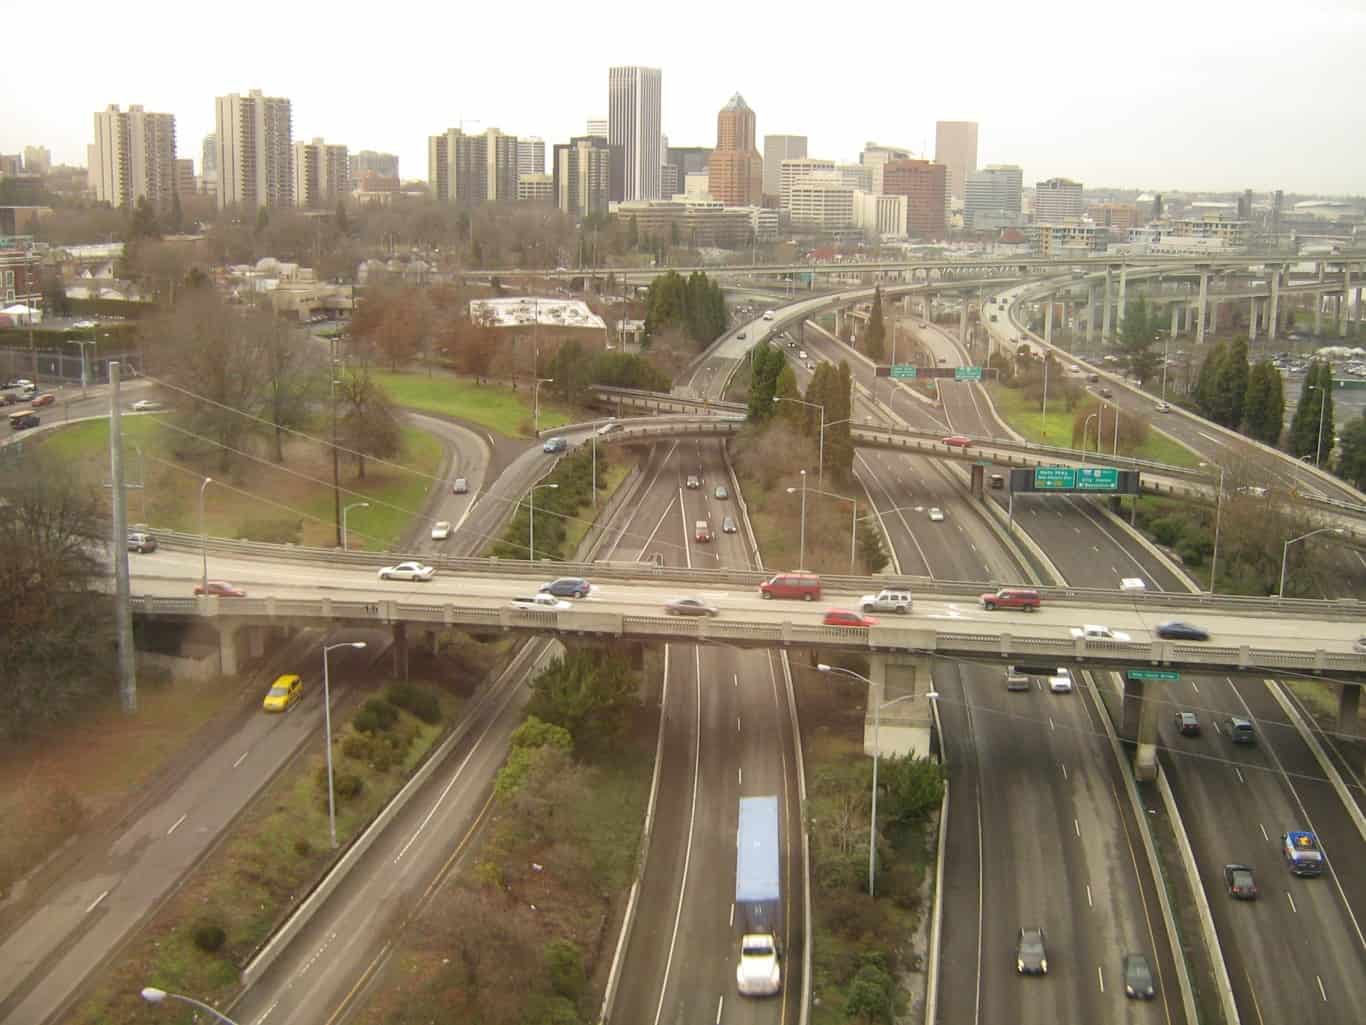
- Change in share of families in middle-income tracts, 2012 to 2022: -3.0 ppts.
- Change in share of families in upper-income tracts, 2012 to 2022: +2.7 ppts.
- Change in share of families in lower-income tracts, 2012 to 2022: +0.3 ppts.
- Median family income, 2022: $116,103
- Total population, 2022: 646,101
36. El Paso, Texas
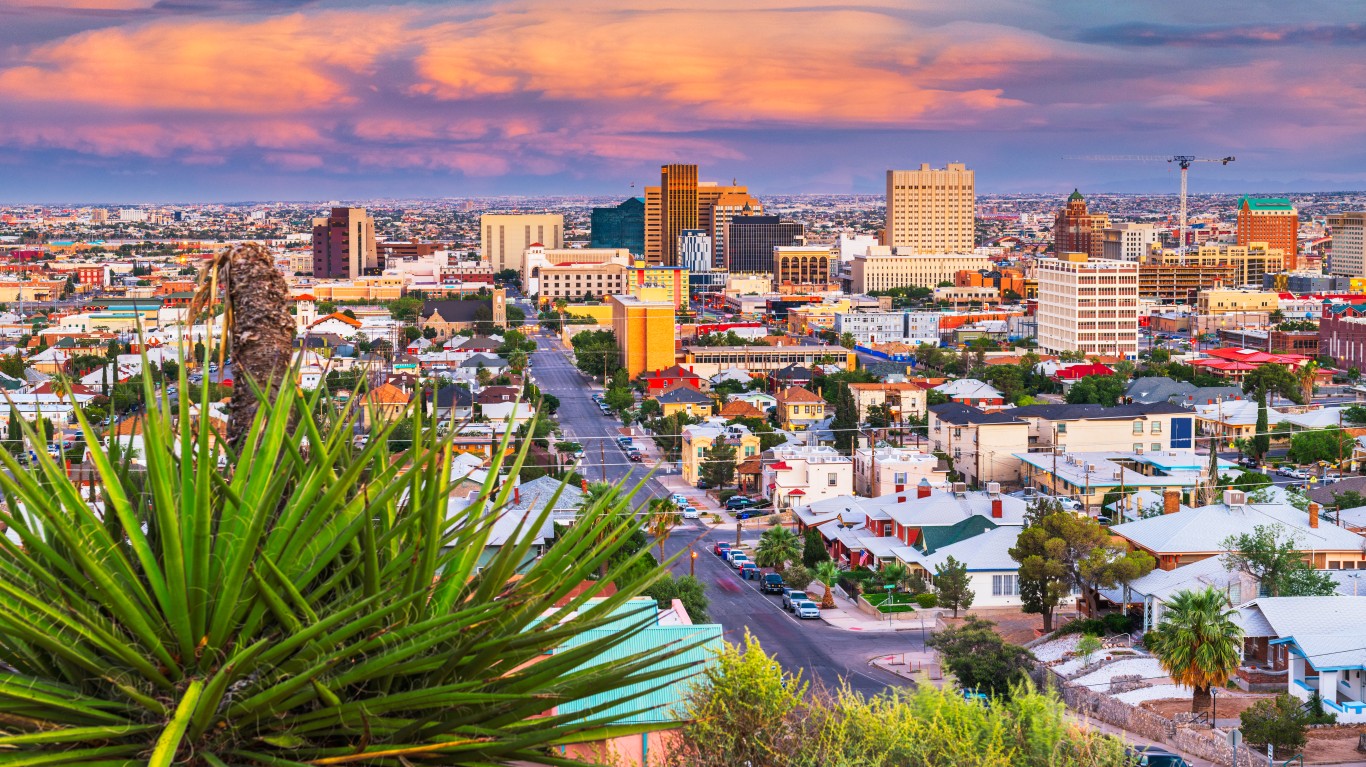
- Change in share of families in middle-income tracts, 2012 to 2022: -3.0 ppts.
- Change in share of families in upper-income tracts, 2012 to 2022: -2.3 ppts.
- Change in share of families in lower-income tracts, 2012 to 2022: +5.3 ppts.
- Median family income, 2022: $63,067
- Total population, 2022: 677,181
35. Santa Rosa, California
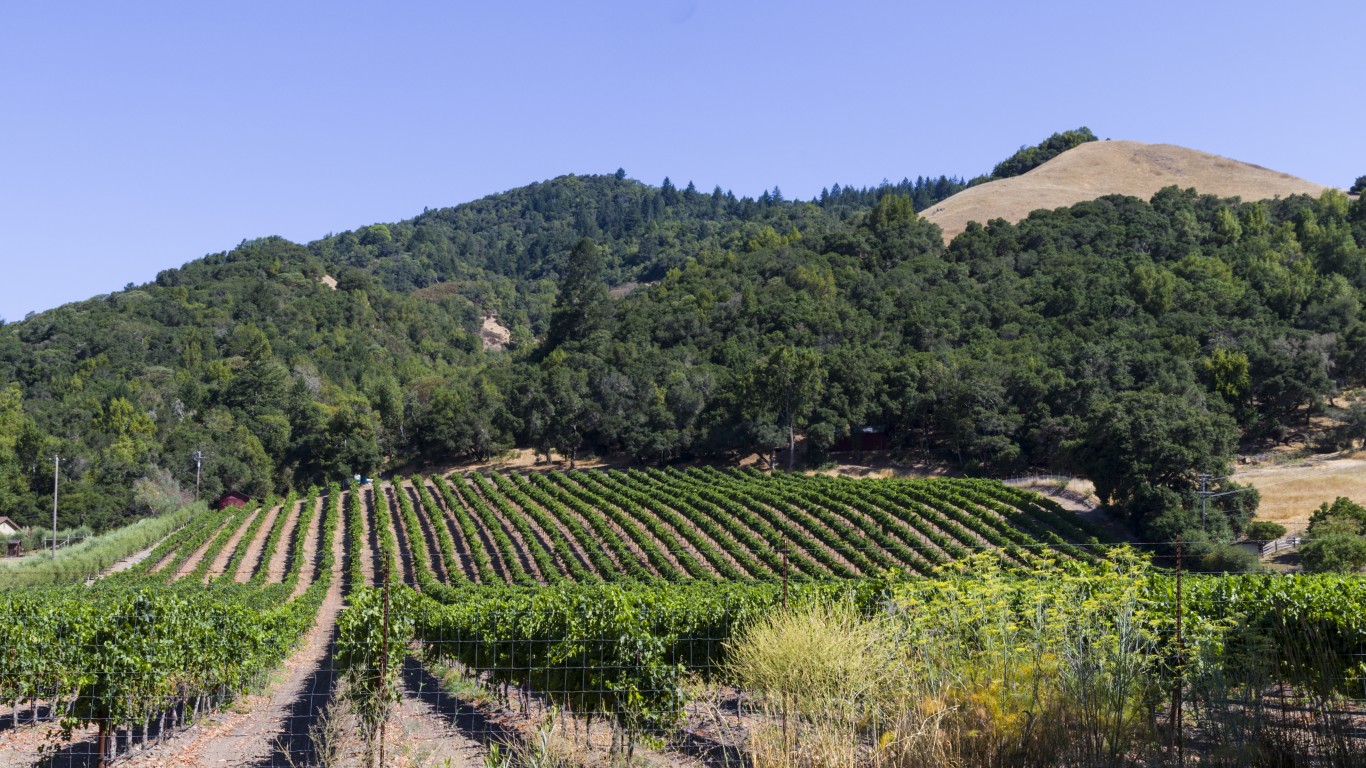
- Change in share of families in middle-income tracts, 2012 to 2022: -3.2 ppts.
- Change in share of families in upper-income tracts, 2012 to 2022: +10.6 ppts.
- Change in share of families in lower-income tracts, 2012 to 2022: -7.4 ppts.
- Median family income, 2022: $110,196
- Total population, 2022: 178,221
34. Escondido, California
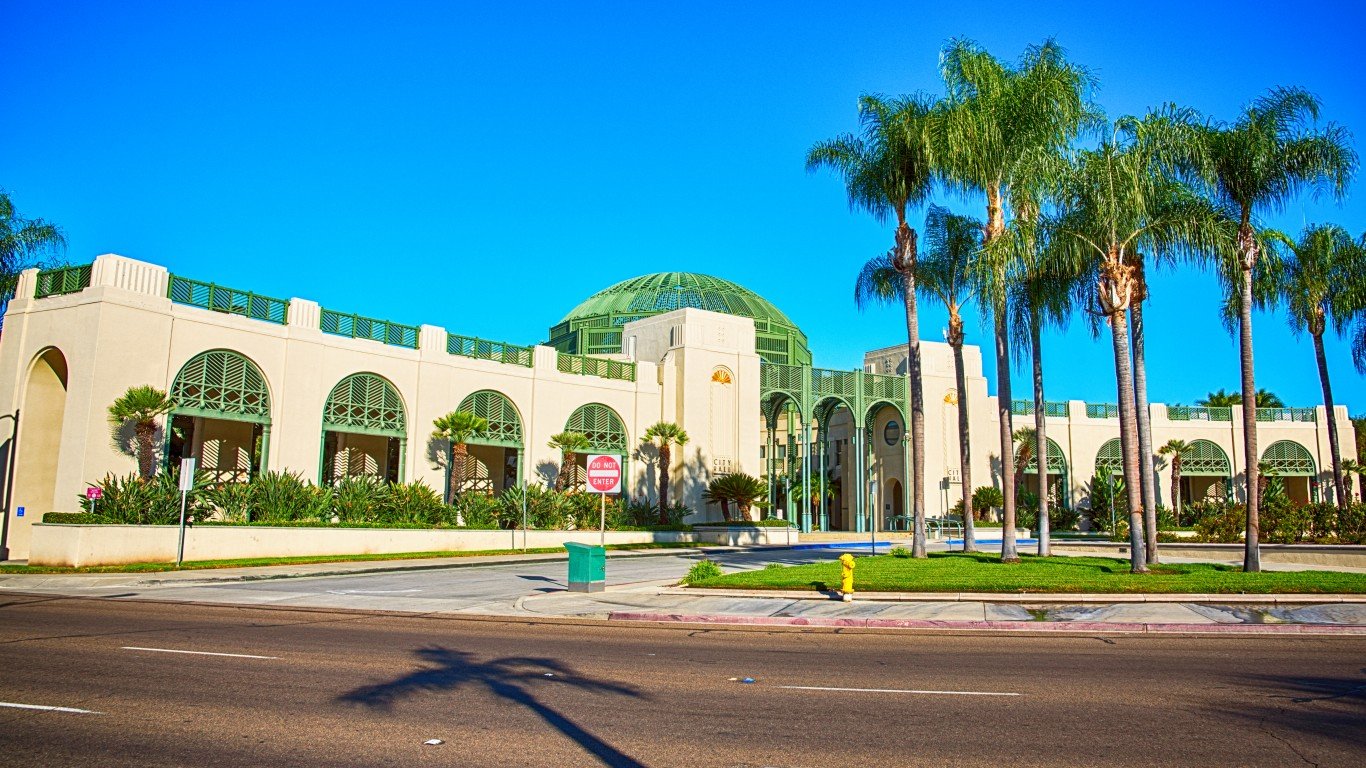
- Change in share of families in middle-income tracts, 2012 to 2022: -3.3 ppts.
- Change in share of families in upper-income tracts, 2012 to 2022: -3.7 ppts.
- Change in share of families in lower-income tracts, 2012 to 2022: +7.0 ppts.
- Median family income, 2022: $89,970
- Total population, 2022: 151,114
33. Peoria, Arizona
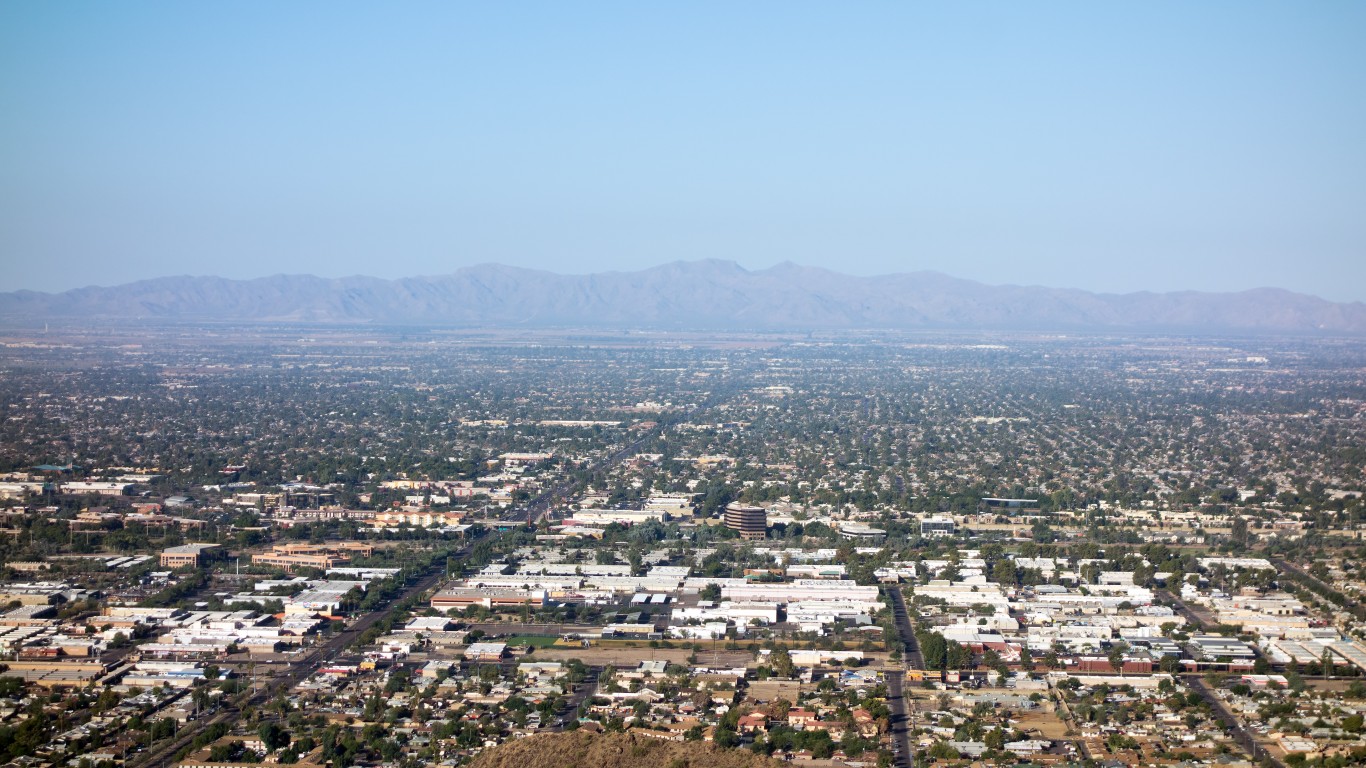
- Change in share of families in middle-income tracts, 2012 to 2022: -3.3 ppts.
- Change in share of families in upper-income tracts, 2012 to 2022: +3.2 ppts.
- Change in share of families in lower-income tracts, 2012 to 2022: +0.1 ppts.
- Median family income, 2022: $102,661
- Total population, 2022: 191,292
32. Glendale, Arizona
- Change in share of families in middle-income tracts, 2012 to 2022: -3.4 ppts.
- Change in share of families in upper-income tracts, 2012 to 2022: +6.0 ppts.
- Change in share of families in lower-income tracts, 2012 to 2022: -2.6 ppts.
- Median family income, 2022: $77,602
- Total population, 2022: 248,083
31. Jackson, Mississippi

- Change in share of families in middle-income tracts, 2012 to 2022: -3.6 ppts.
- Change in share of families in upper-income tracts, 2012 to 2022: +1.0 ppts.
- Change in share of families in lower-income tracts, 2012 to 2022: +2.6 ppts.
- Median family income, 2022: $52,443
- Total population, 2022: 153,271
30. Boston, Massachusetts

- Change in share of families in middle-income tracts, 2012 to 2022: -3.6 ppts.
- Change in share of families in upper-income tracts, 2012 to 2022: +4.6 ppts.
- Change in share of families in lower-income tracts, 2012 to 2022: -1.0 ppts.
- Median family income, 2022: $106,015
- Total population, 2022: 665,945
29. Madison, Wisconsin
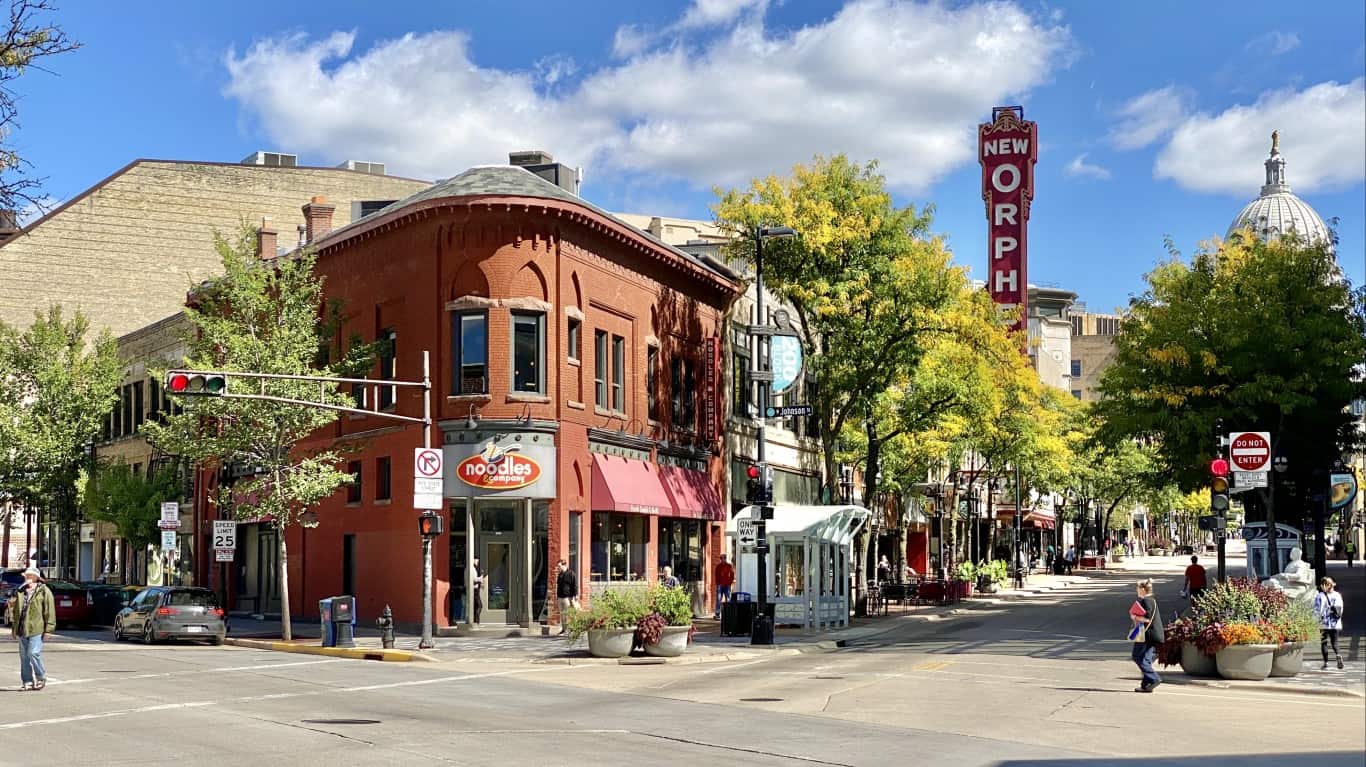
- Change in share of families in middle-income tracts, 2012 to 2022: -4.0 ppts.
- Change in share of families in upper-income tracts, 2012 to 2022: +1.5 ppts.
- Change in share of families in lower-income tracts, 2012 to 2022: +2.6 ppts.
- Median family income, 2022: $111,576
- Total population, 2022: 268,516
28. Spring Valley, Nevada
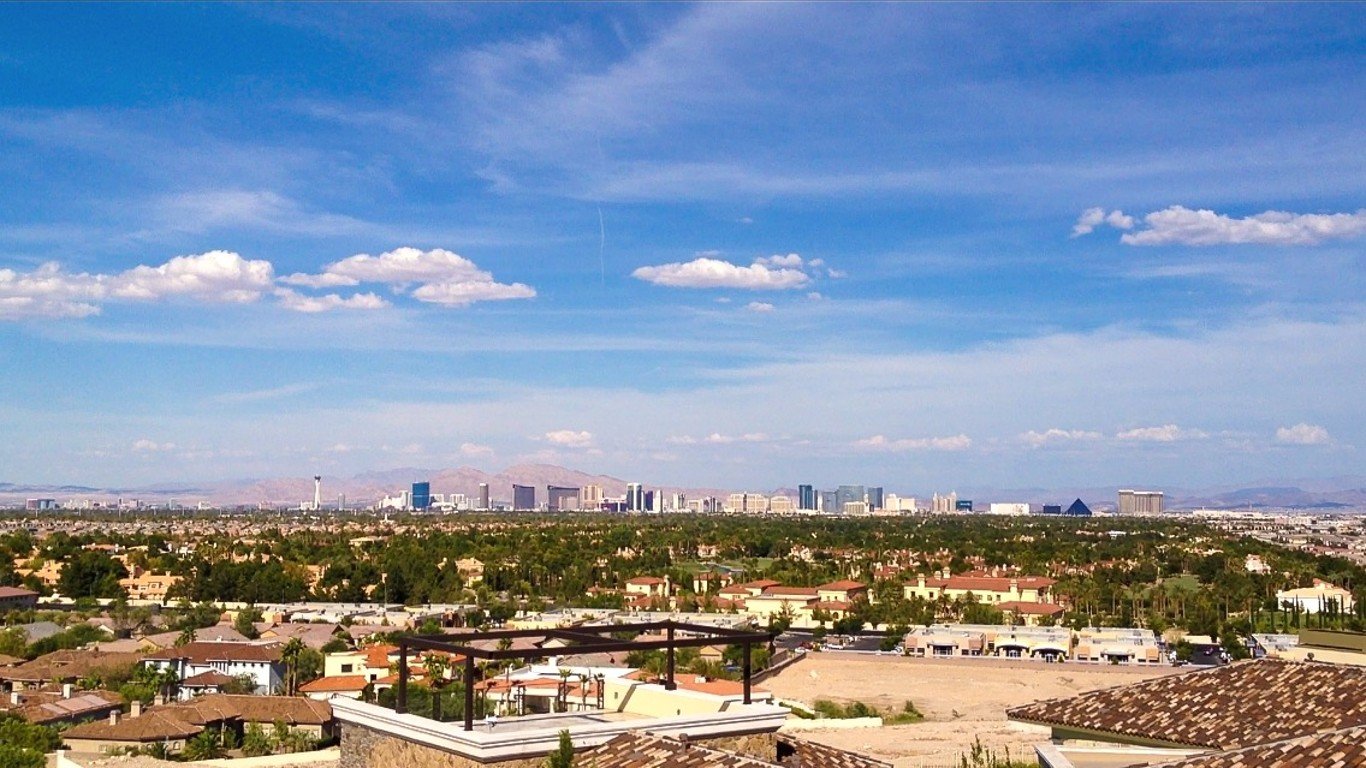
- Change in share of families in middle-income tracts, 2012 to 2022: -4.8 ppts.
- Change in share of families in upper-income tracts, 2012 to 2022: -2.7 ppts.
- Change in share of families in lower-income tracts, 2012 to 2022: +7.4 ppts.
- Median family income, 2022: $79,763
- Total population, 2022: 220,114
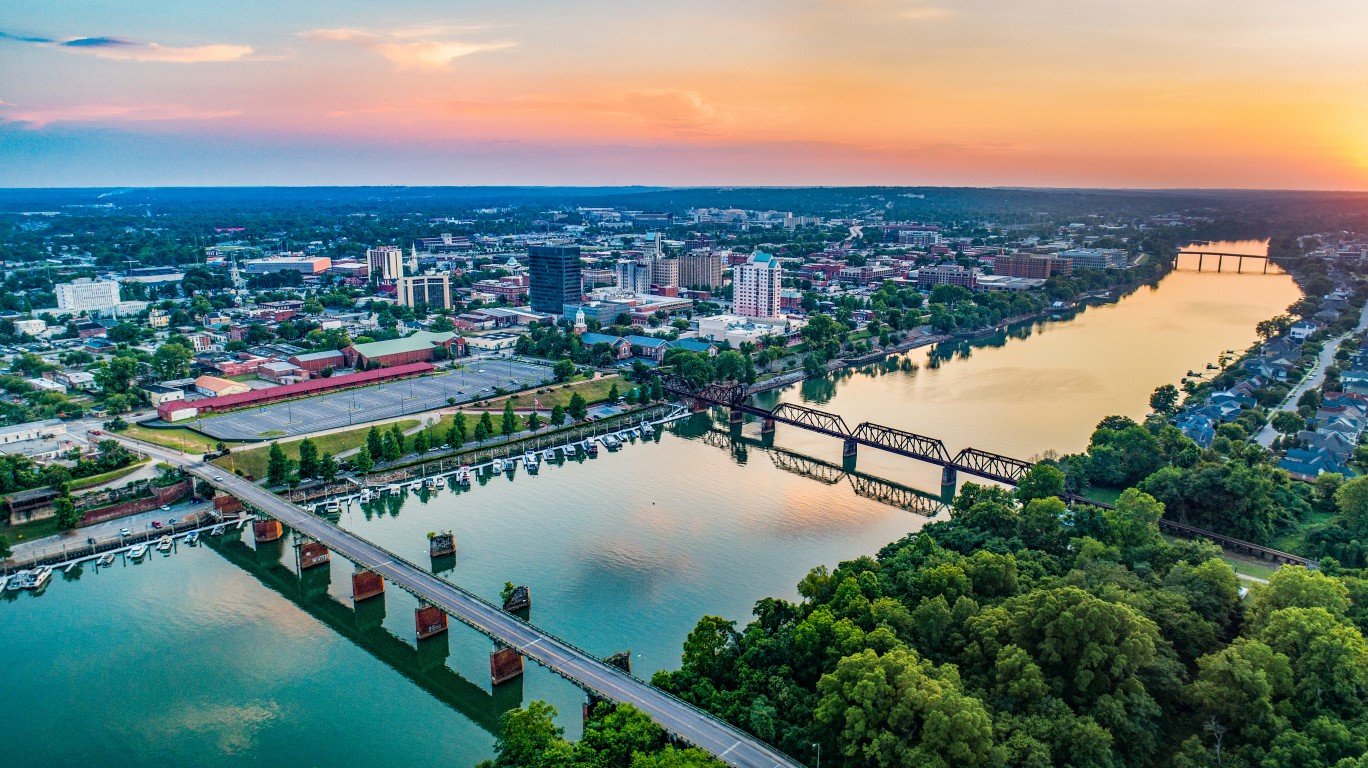
27. Birmingham, Alabama

- Change in share of families in middle-income tracts, 2012 to 2022: -5.1 ppts.
- Change in share of families in upper-income tracts, 2012 to 2022: -3.6 ppts.
- Change in share of families in lower-income tracts, 2012 to 2022: +8.7 ppts.
- Median family income, 2022: $55,541
- Total population, 2022: 200,431
26. Baton Rouge, Louisiana
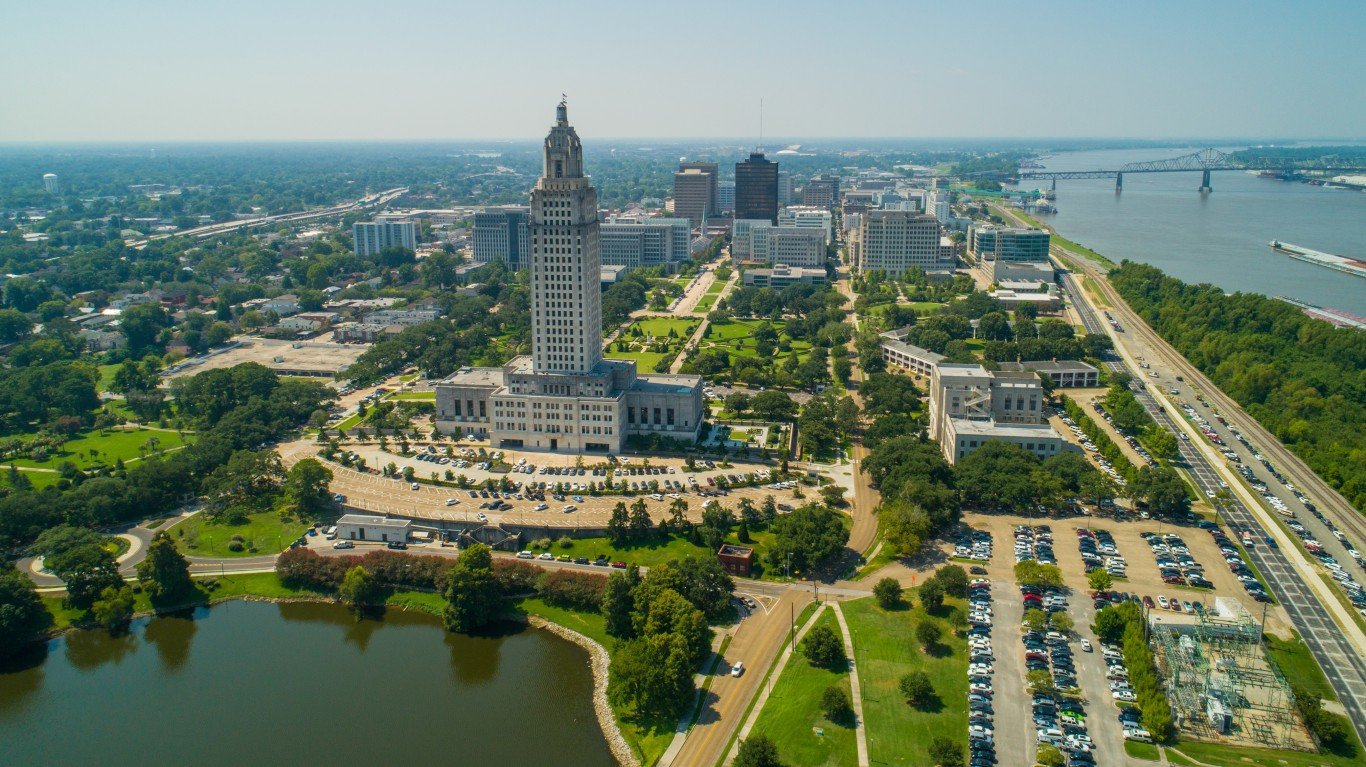
- Change in share of families in middle-income tracts, 2012 to 2022: -5.3 ppts.
- Change in share of families in upper-income tracts, 2012 to 2022: +3.4 ppts.
- Change in share of families in lower-income tracts, 2012 to 2022: +1.9 ppts.
- Median family income, 2022: $68,228
- Total population, 2022: 225,500
25. Chesapeake, Virginia
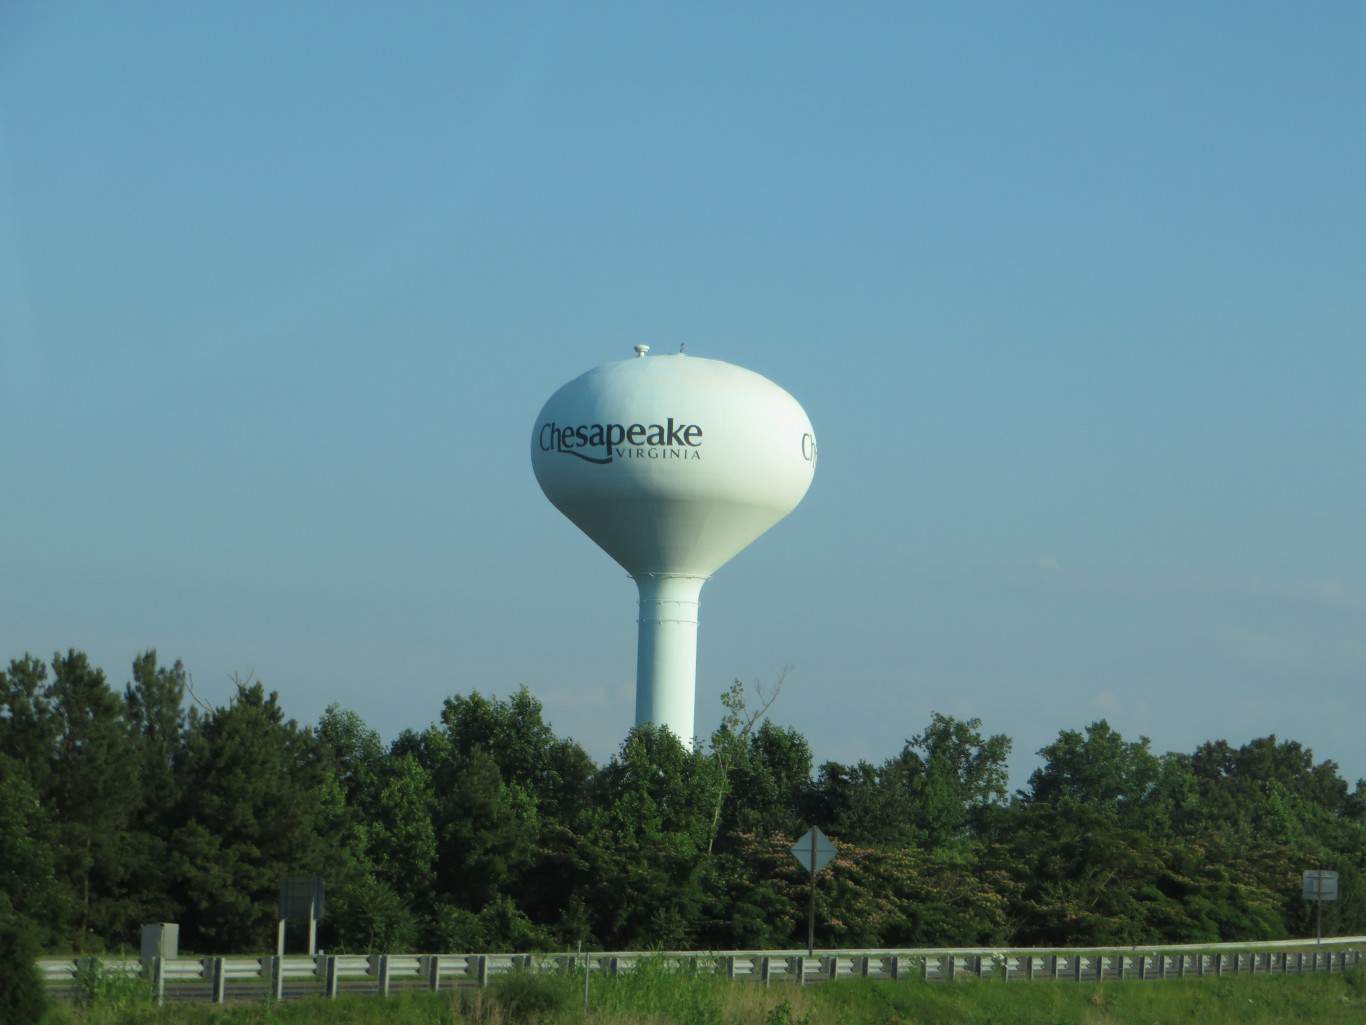
- Change in share of families in middle-income tracts, 2012 to 2022: -5.4 ppts.
- Change in share of families in upper-income tracts, 2012 to 2022: +6.3 ppts.
- Change in share of families in lower-income tracts, 2012 to 2022: -0.9 ppts.
- Median family income, 2022: $109,923
- Total population, 2022: 249,377
24. Atlanta, Georgia

- Change in share of families in middle-income tracts, 2012 to 2022: -5.6 ppts.
- Change in share of families in upper-income tracts, 2012 to 2022: +11.9 ppts.
- Change in share of families in lower-income tracts, 2012 to 2022: -6.3 ppts.
- Median family income, 2022: $103,886
- Total population, 2022: 494,838
23. Fayetteville, North Carolina
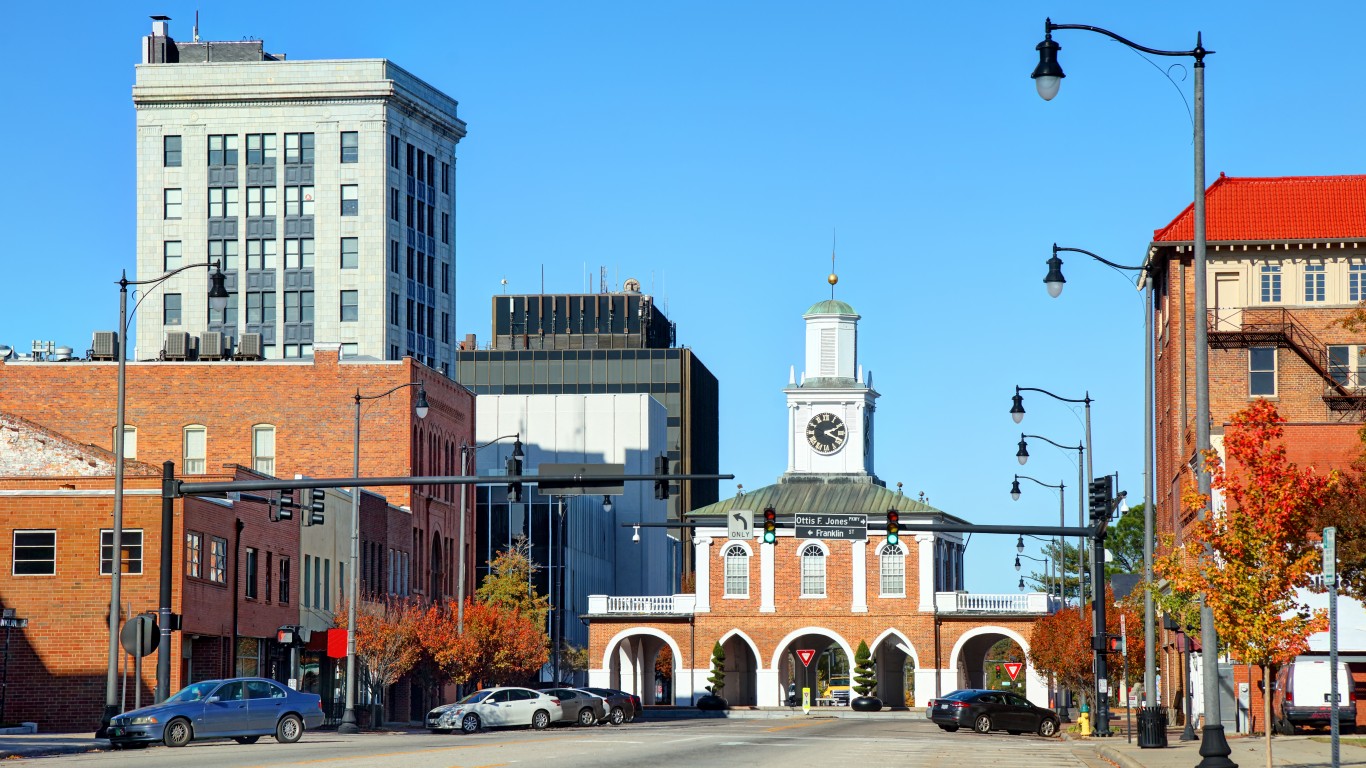
- Change in share of families in middle-income tracts, 2012 to 2022: -5.7 ppts.
- Change in share of families in upper-income tracts, 2012 to 2022: +8.4 ppts.
- Change in share of families in lower-income tracts, 2012 to 2022: -2.8 ppts.
- Median family income, 2022: $63,485
- Total population, 2022: 208,697
22. Corpus Christi, Texas
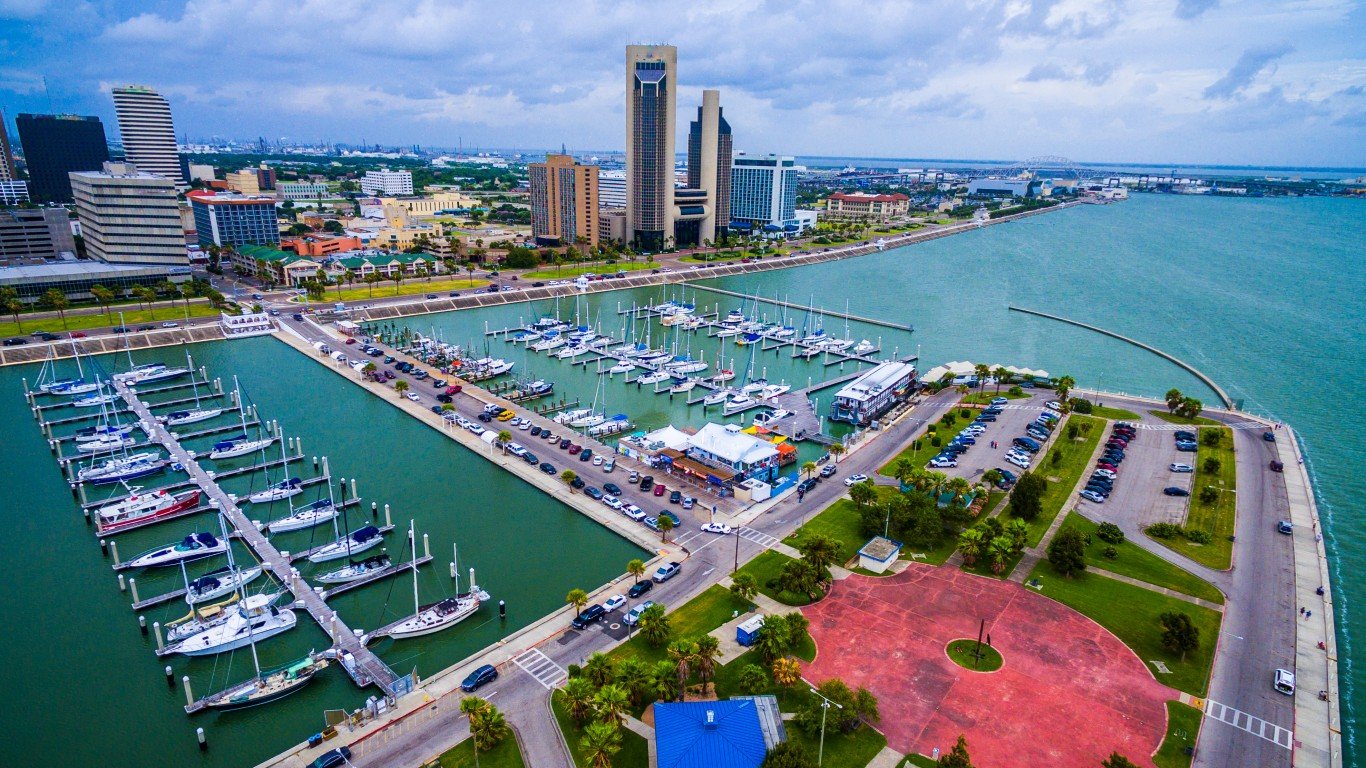
- Change in share of families in middle-income tracts, 2012 to 2022: -6.0 ppts.
- Change in share of families in upper-income tracts, 2012 to 2022: +3.5 ppts.
- Change in share of families in lower-income tracts, 2012 to 2022: +2.5 ppts.
- Median family income, 2022: $78,428
- Total population, 2022: 317,804
21. Amarillo, Texas
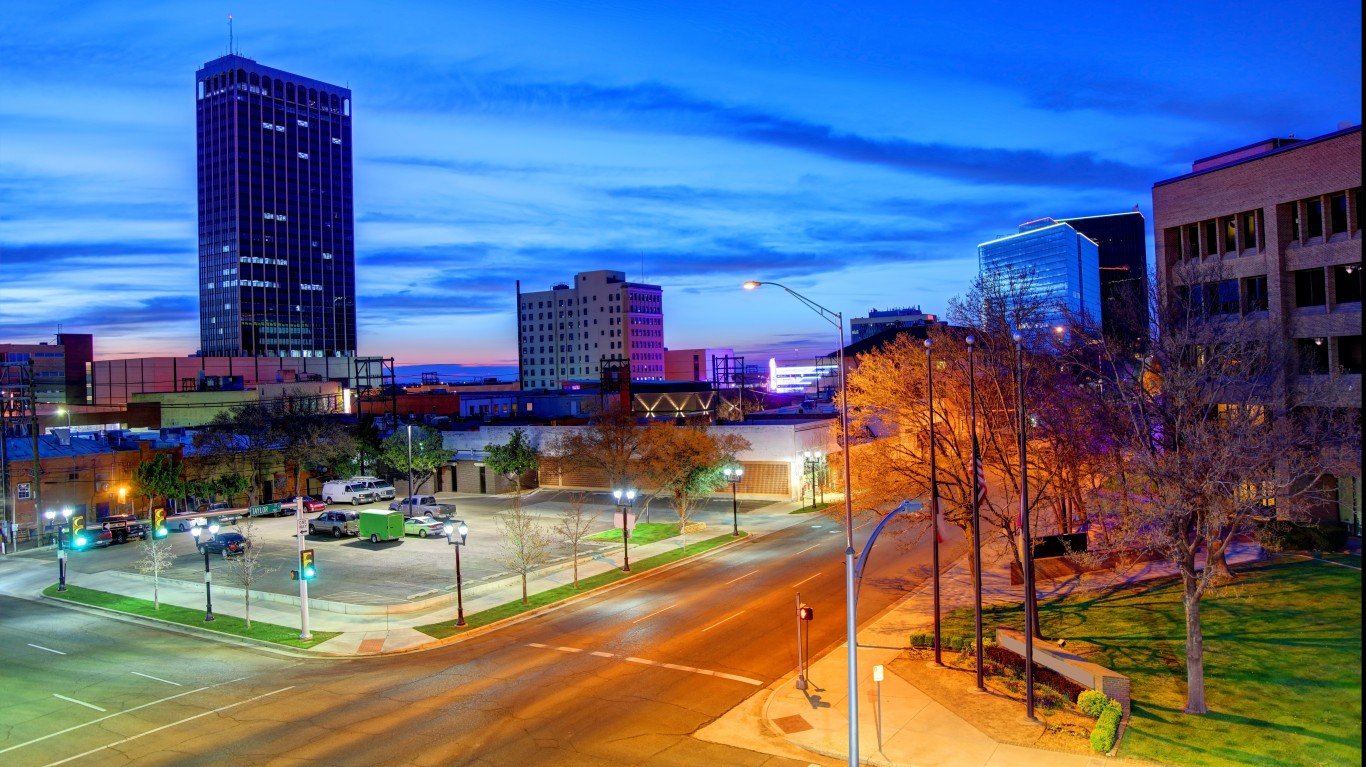
- Change in share of families in middle-income tracts, 2012 to 2022: -6.7 ppts.
- Change in share of families in upper-income tracts, 2012 to 2022: -0.2 ppts.
- Change in share of families in lower-income tracts, 2012 to 2022: +6.9 ppts.
- Median family income, 2022: $76,749
- Total population, 2022: 200,360
20. Henderson, Nevada

- Change in share of families in middle-income tracts, 2012 to 2022: -8.1 ppts.
- Change in share of families in upper-income tracts, 2012 to 2022: +0.0 ppts.
- Change in share of families in lower-income tracts, 2012 to 2022: +8.0 ppts.
- Median family income, 2022: $100,794
- Total population, 2022: 318,063
19. Santa Ana, California
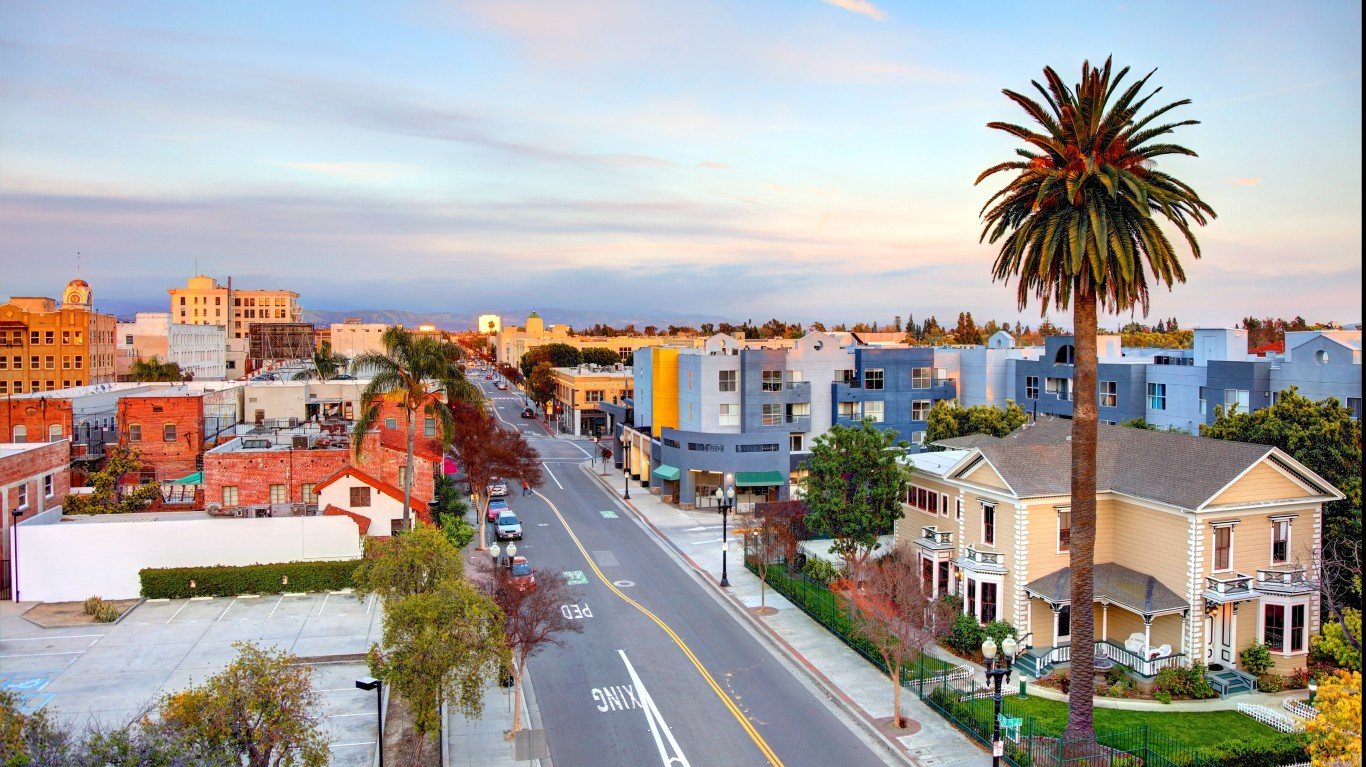
- Change in share of families in middle-income tracts, 2012 to 2022: -8.3 ppts.
- Change in share of families in upper-income tracts, 2012 to 2022: +2.3 ppts.
- Change in share of families in lower-income tracts, 2012 to 2022: +6.0 ppts.
- Median family income, 2022: $83,689
- Total population, 2022: 311,379
18. Newport News, Virginia

- Change in share of families in middle-income tracts, 2012 to 2022: -8.8 ppts.
- Change in share of families in upper-income tracts, 2012 to 2022: +0.8 ppts.
- Change in share of families in lower-income tracts, 2012 to 2022: +8.0 ppts.
- Median family income, 2022: $77,483
- Total population, 2022: 185,118
17. Hialeah, Florida
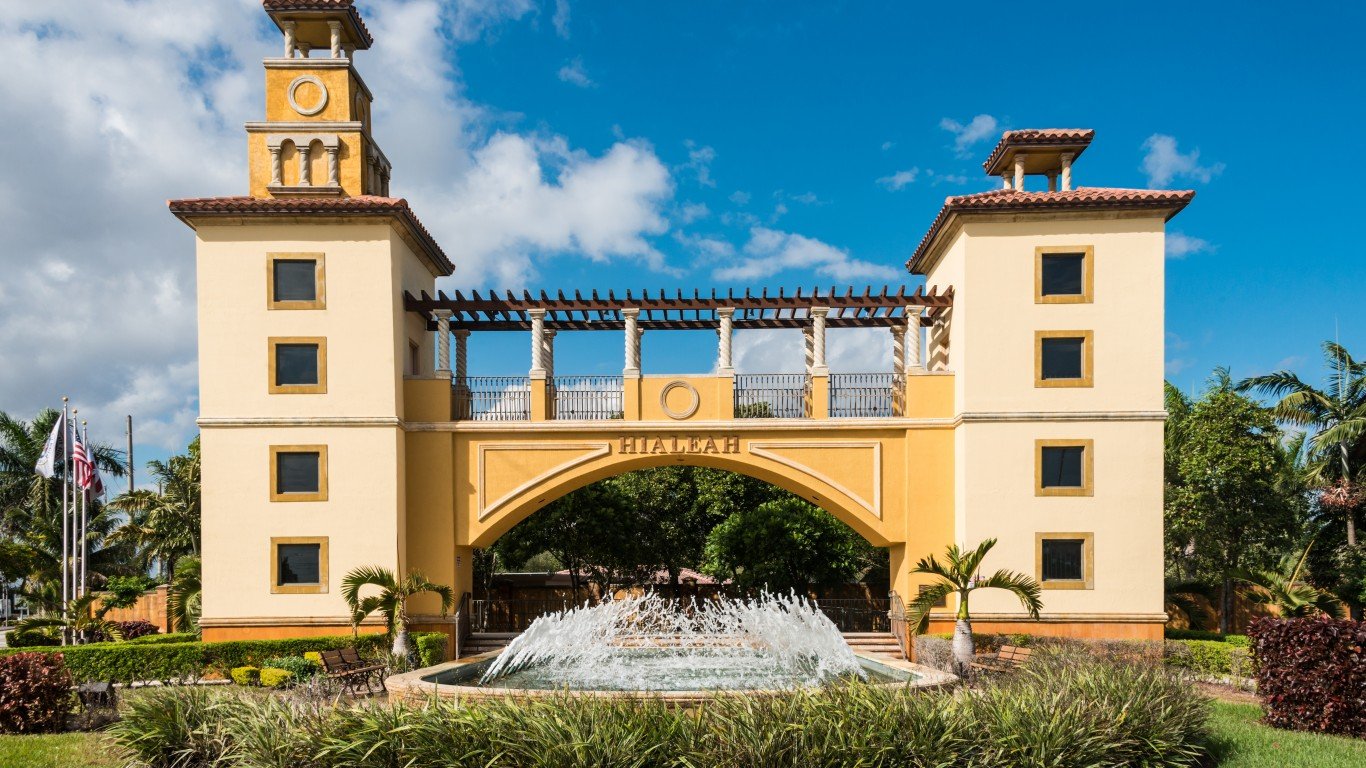
- Change in share of families in middle-income tracts, 2012 to 2022: -9.0 ppts.
- Change in share of families in upper-income tracts, 2012 to 2022: +9.5 ppts.
- Change in share of families in lower-income tracts, 2012 to 2022: -0.5 ppts.
- Median family income, 2022: $55,066
- Total population, 2022: 222,996
16. Augusta, Georgia
- Change in share of families in middle-income tracts, 2012 to 2022: -10.0 ppts.
- Change in share of families in upper-income tracts, 2012 to 2022: -0.4 ppts.
- Change in share of families in lower-income tracts, 2012 to 2022: +10.4 ppts.
- Median family income, 2022: $60,664
- Total population, 2022: 201,615
15. Tulsa, Oklahoma

- Change in share of families in middle-income tracts, 2012 to 2022: -10.0 ppts.
- Change in share of families in upper-income tracts, 2012 to 2022: +2.7 ppts.
- Change in share of families in lower-income tracts, 2012 to 2022: +7.4 ppts.
- Median family income, 2022: $74,430
- Total population, 2022: 411,938
14. Irvine, California
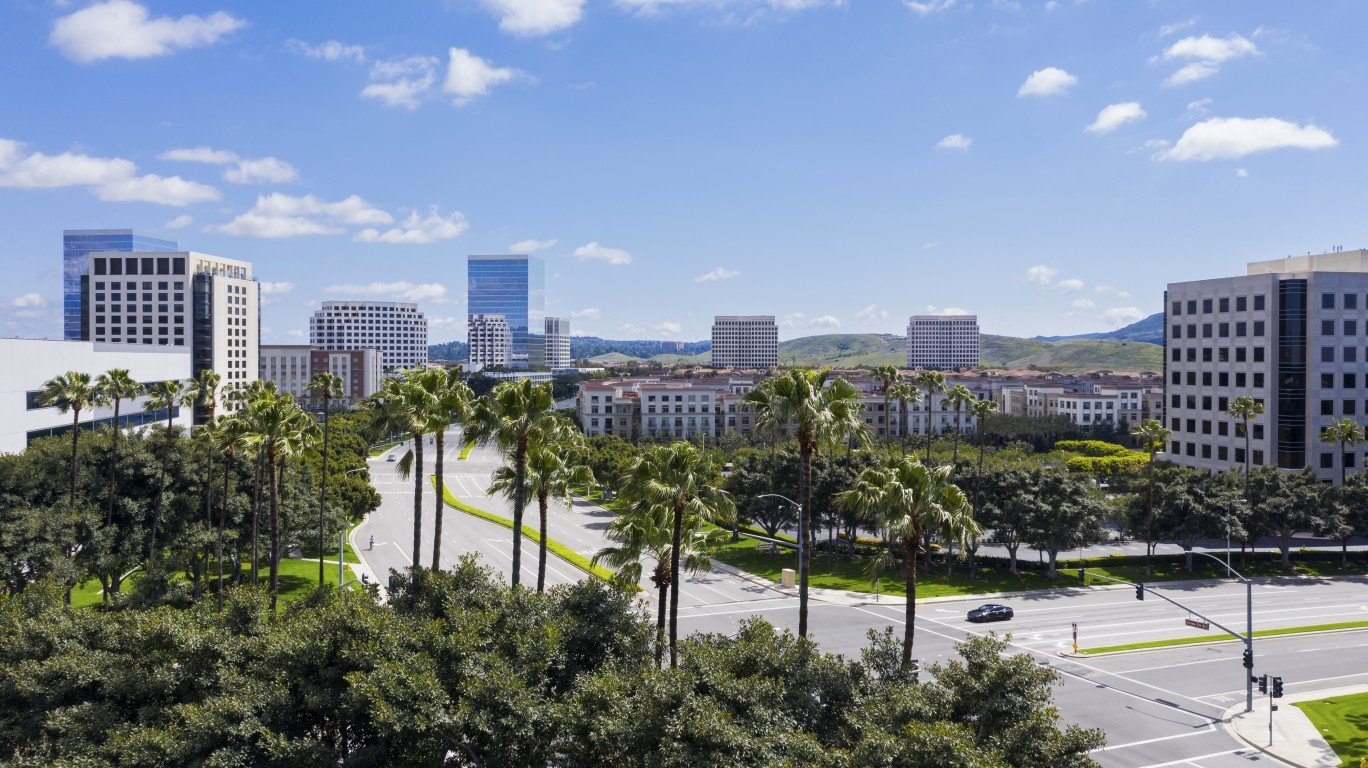
- Change in share of families in middle-income tracts, 2012 to 2022: -10.2 ppts.
- Change in share of families in upper-income tracts, 2012 to 2022: +3.3 ppts.
- Change in share of families in lower-income tracts, 2012 to 2022: +6.9 ppts.
- Median family income, 2022: $153,615
- Total population, 2022: 304,527
13. Sunnyvale, California
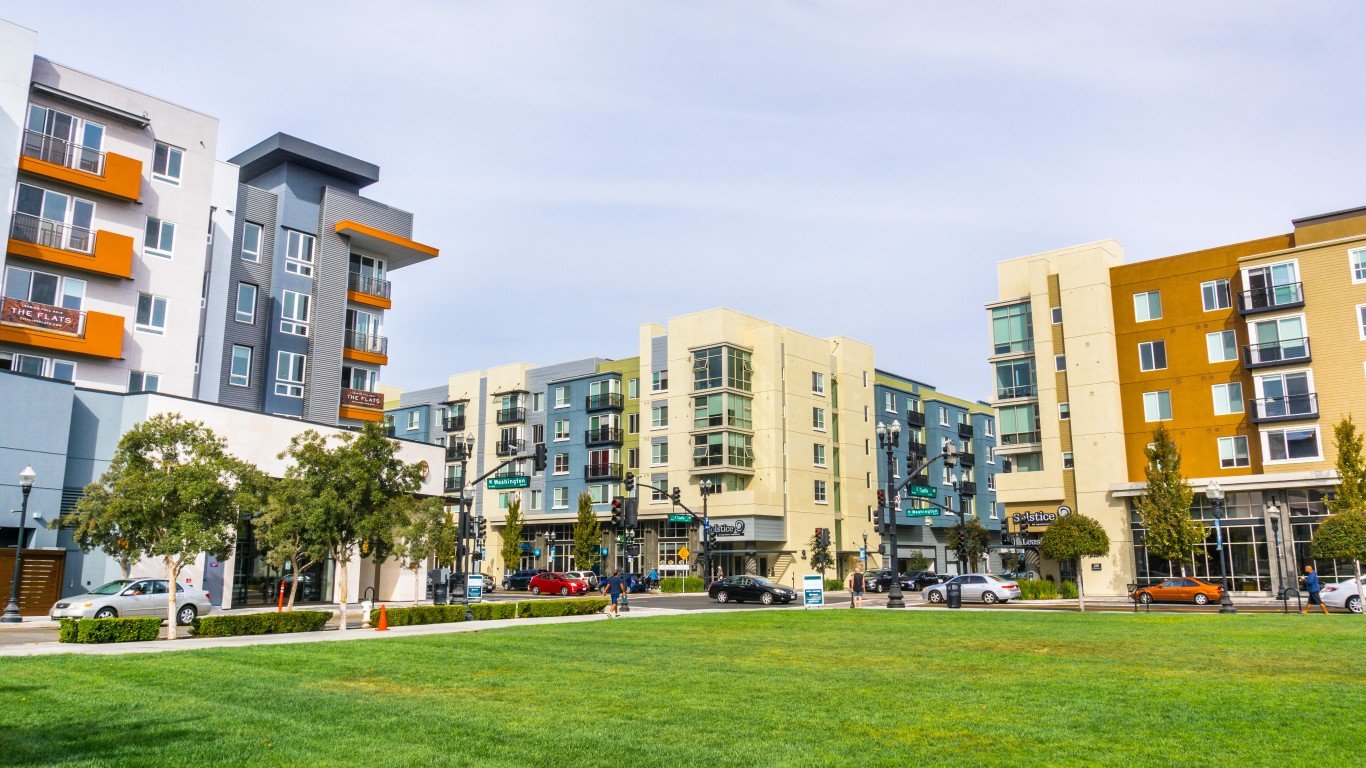
- Change in share of families in middle-income tracts, 2012 to 2022: -10.4 ppts.
- Change in share of families in upper-income tracts, 2012 to 2022: -3.2 ppts.
- Change in share of families in lower-income tracts, 2012 to 2022: +13.5 ppts.
- Median family income, 2022: $190,031
- Total population, 2022: 154,573
12. Oxnard, California
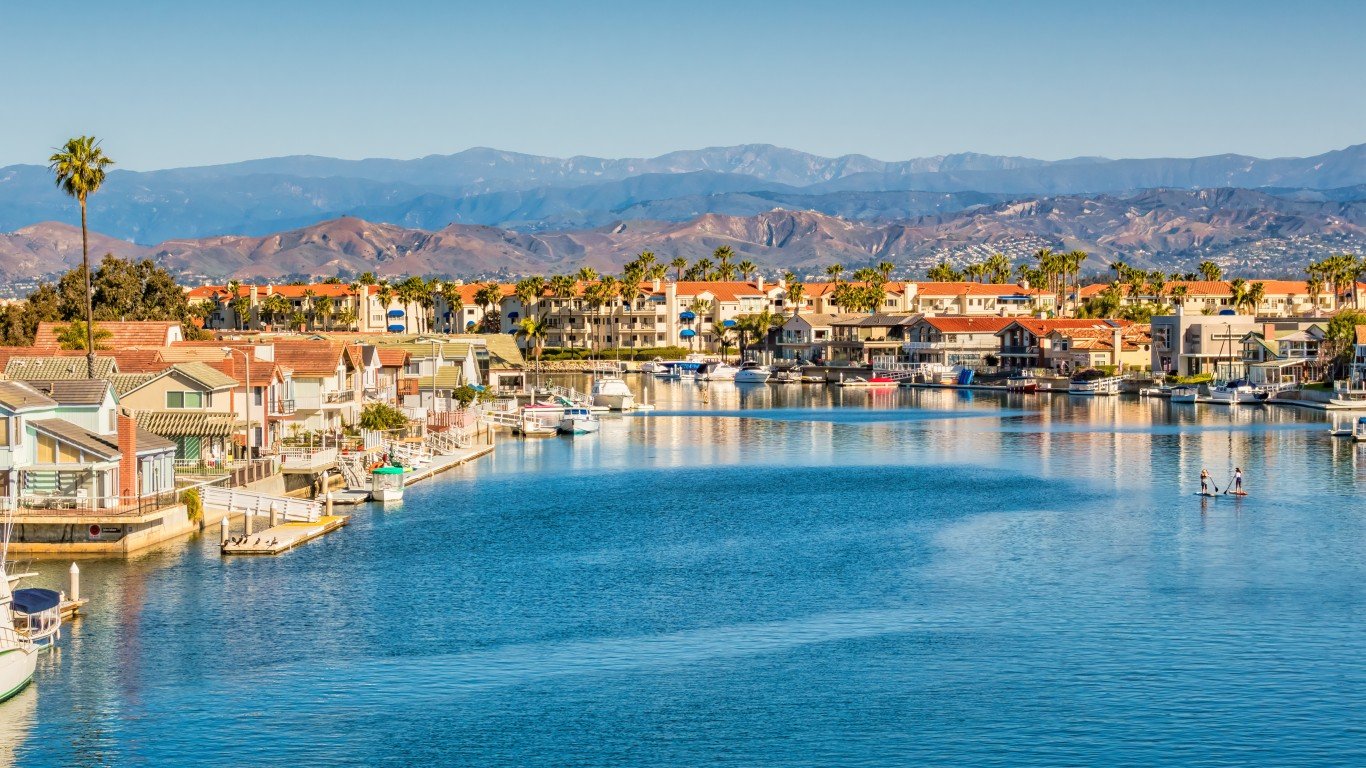
- Change in share of families in middle-income tracts, 2012 to 2022: -11.3 ppts.
- Change in share of families in upper-income tracts, 2012 to 2022: +0.5 ppts.
- Change in share of families in lower-income tracts, 2012 to 2022: +10.8 ppts.
- Median family income, 2022: $89,908
- Total population, 2022: 202,279
11. Tampa, Florida
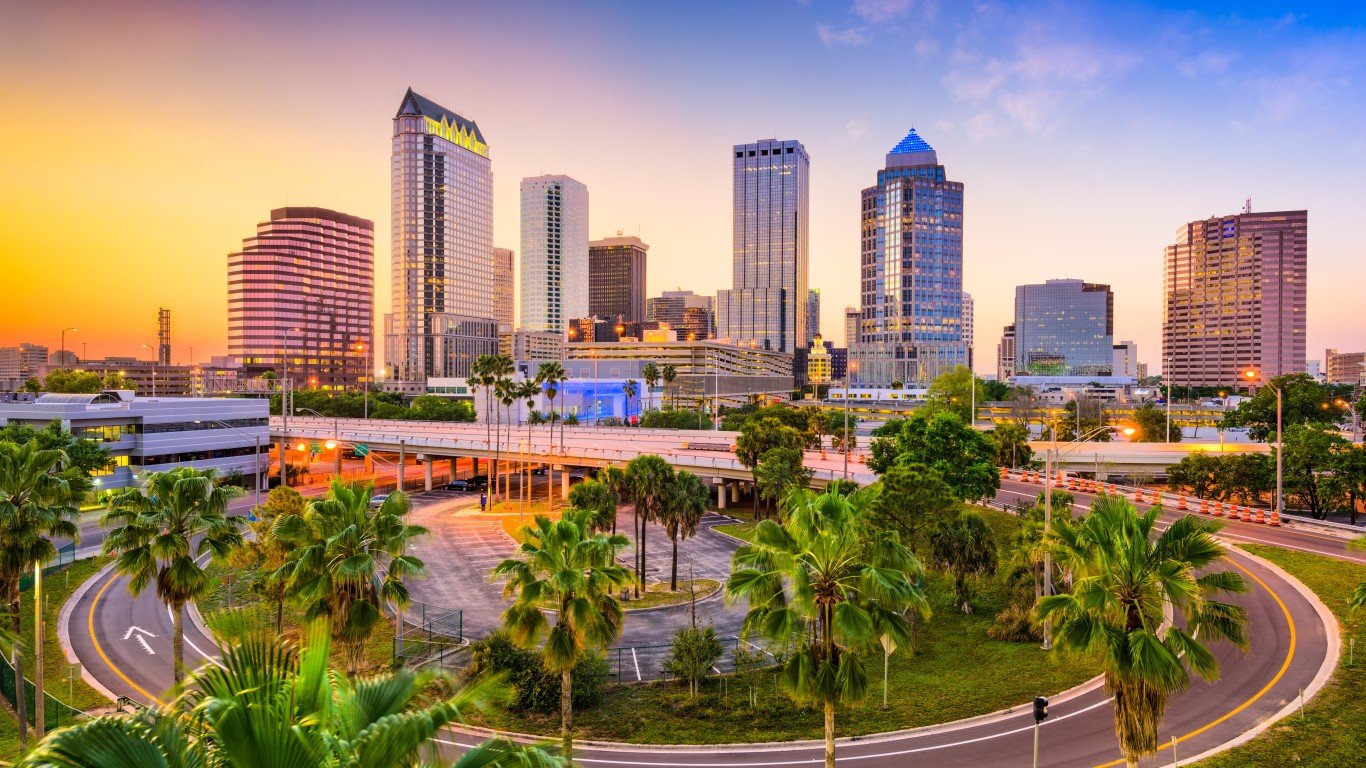
- Change in share of families in middle-income tracts, 2012 to 2022: -11.6 ppts.
- Change in share of families in upper-income tracts, 2012 to 2022: +11.0 ppts.
- Change in share of families in lower-income tracts, 2012 to 2022: +0.6 ppts.
- Median family income, 2022: $84,185
- Total population, 2022: 388,768
10. Urban Honolulu, Hawaii
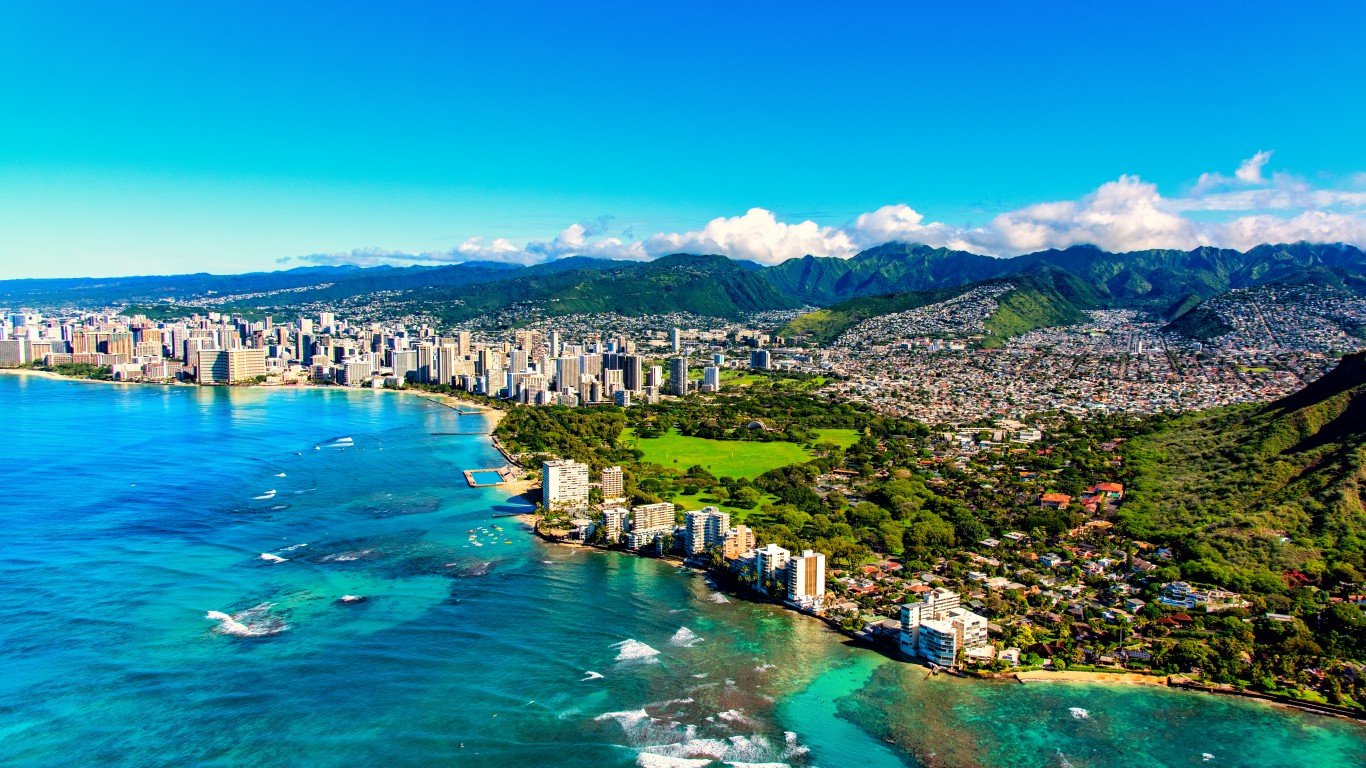
- Change in share of families in middle-income tracts, 2012 to 2022: -12.1 ppts.
- Change in share of families in upper-income tracts, 2012 to 2022: +8.1 ppts.
- Change in share of families in lower-income tracts, 2012 to 2022: +4.0 ppts.
- Median family income, 2022: $106,192
- Total population, 2022: 348,547
9. Paradise, Nevada

- Change in share of families in middle-income tracts, 2012 to 2022: -12.5 ppts.
- Change in share of families in upper-income tracts, 2012 to 2022: +13.8 ppts.
- Change in share of families in lower-income tracts, 2012 to 2022: -1.3 ppts.
- Median family income, 2022: $68,168
- Total population, 2022: 189,733
8. Anchorage, Alaska
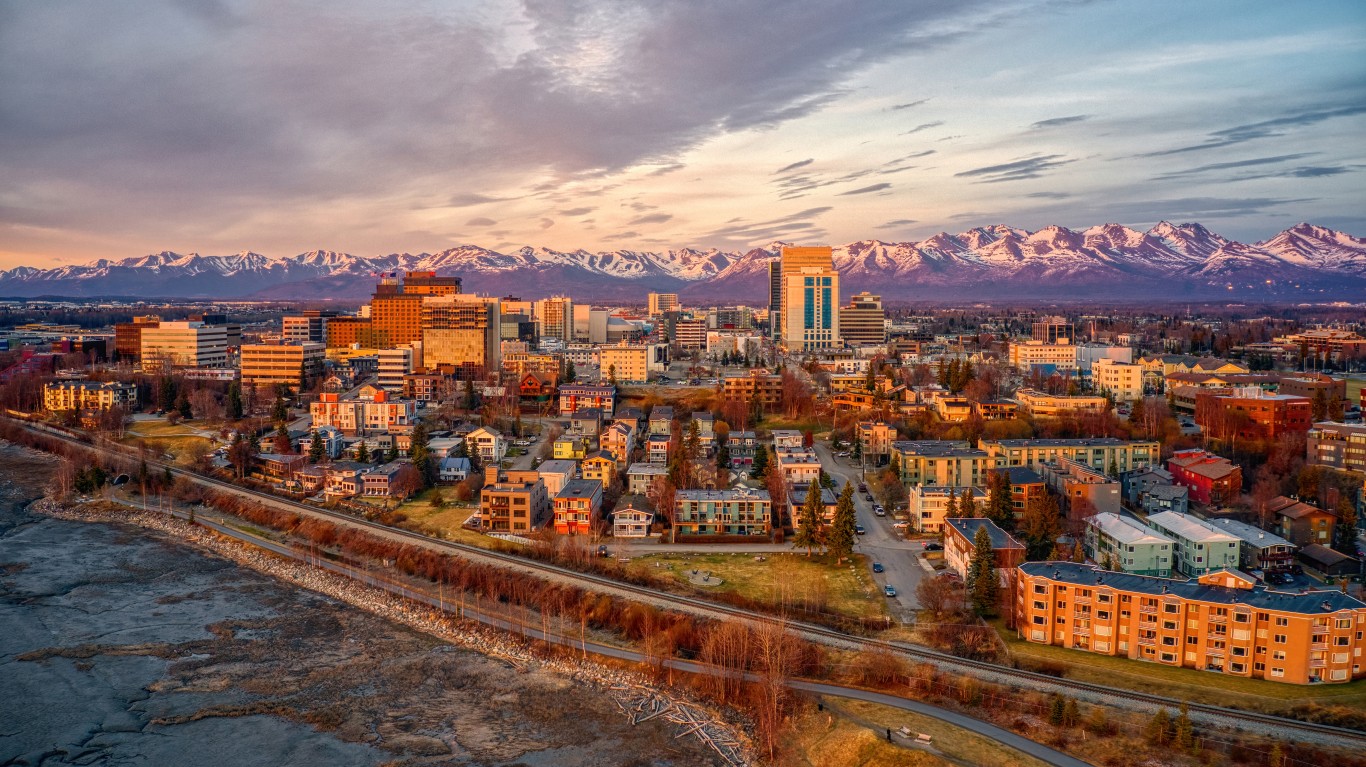
- Change in share of families in middle-income tracts, 2012 to 2022: -12.7 ppts.
- Change in share of families in upper-income tracts, 2012 to 2022: +9.4 ppts.
- Change in share of families in lower-income tracts, 2012 to 2022: +3.3 ppts.
- Median family income, 2022: $115,272
- Total population, 2022: 290,674
7. Paterson, New Jersey
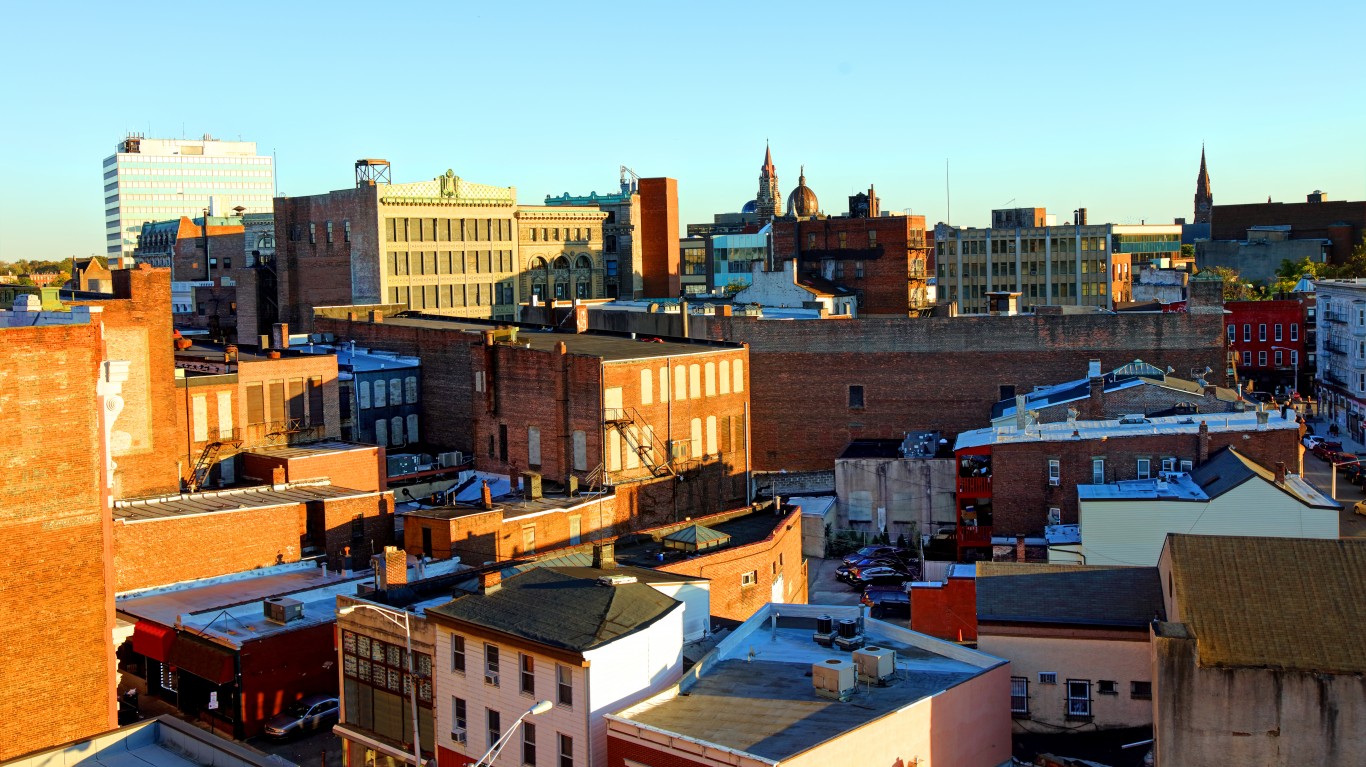
- Change in share of families in middle-income tracts, 2012 to 2022: -12.8 ppts.
- Change in share of families in upper-income tracts, 2012 to 2022: +4.4 ppts.
- Change in share of families in lower-income tracts, 2012 to 2022: +8.4 ppts.
- Median family income, 2022: $59,976
- Total population, 2022: 157,864
6. Orlando, Florida

- Change in share of families in middle-income tracts, 2012 to 2022: -12.9 ppts.
- Change in share of families in upper-income tracts, 2012 to 2022: +6.5 ppts.
- Change in share of families in lower-income tracts, 2012 to 2022: +6.4 ppts.
- Median family income, 2022: $74,980
- Total population, 2022: 307,738
5. Clarksville, Tennessee
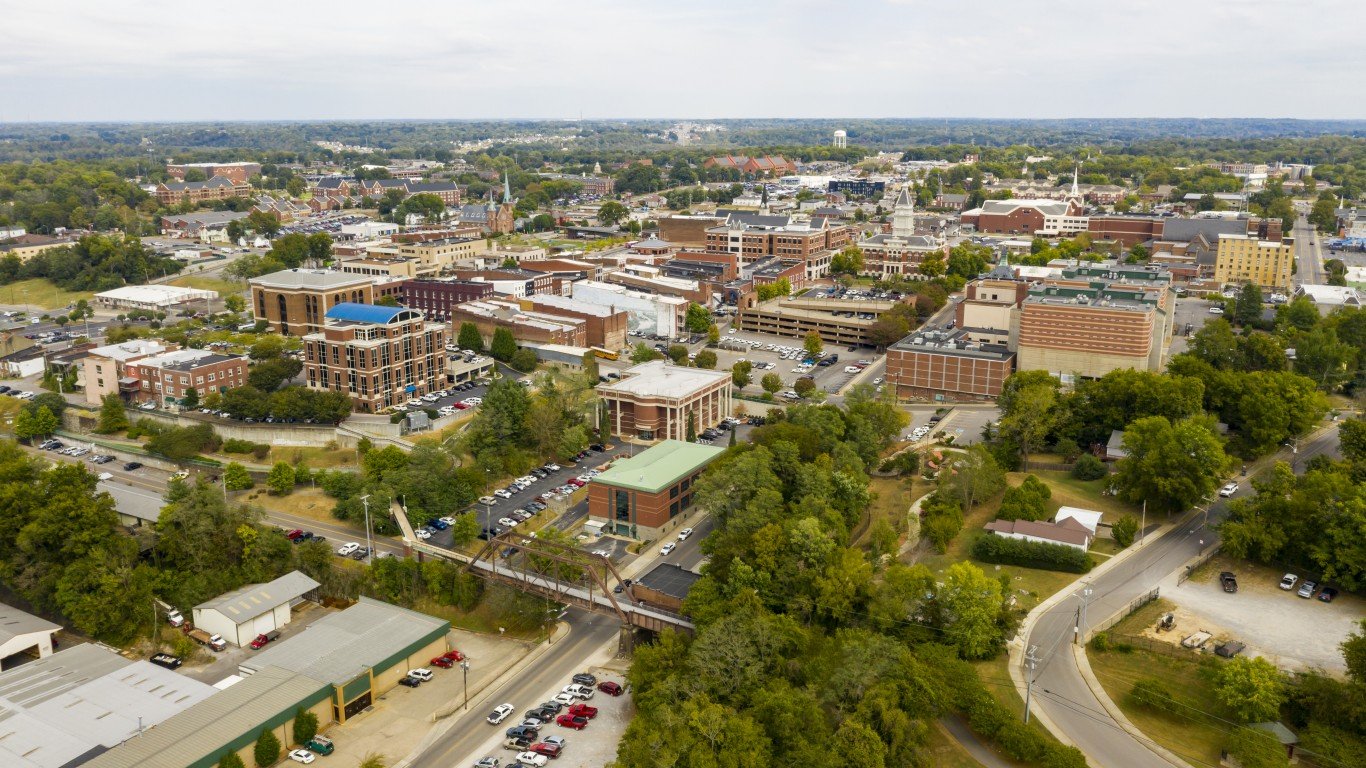
- Change in share of families in middle-income tracts, 2012 to 2022: -14.0 ppts.
- Change in share of families in upper-income tracts, 2012 to 2022: +5.8 ppts.
- Change in share of families in lower-income tracts, 2012 to 2022: +8.3 ppts.
- Median family income, 2022: $73,333
- Total population, 2022: 167,882
4. Laredo, Texas
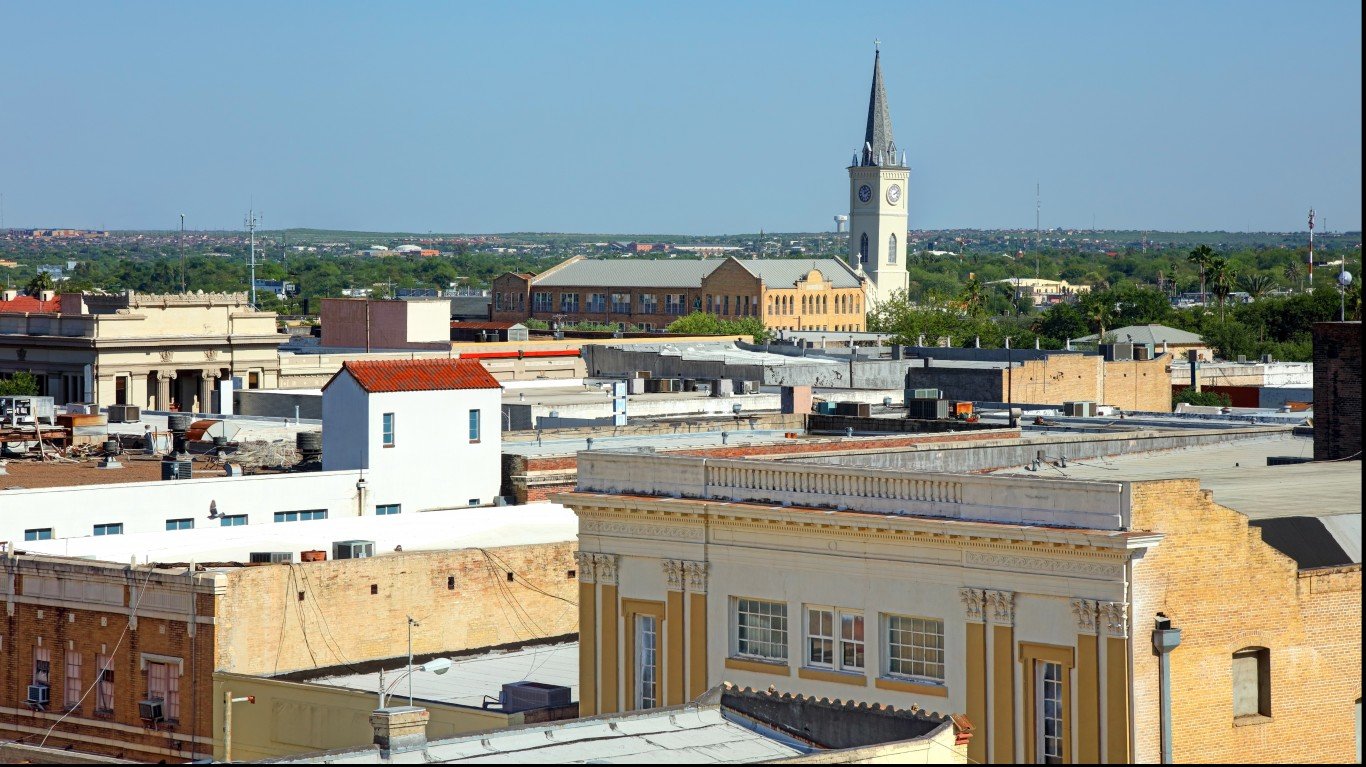
- Change in share of families in middle-income tracts, 2012 to 2022: -15.6 ppts.
- Change in share of families in upper-income tracts, 2012 to 2022: +5.4 ppts.
- Change in share of families in lower-income tracts, 2012 to 2022: +10.2 ppts.
- Median family income, 2022: $66,315
- Total population, 2022: 255,293
3. Fort Lauderdale, Florida
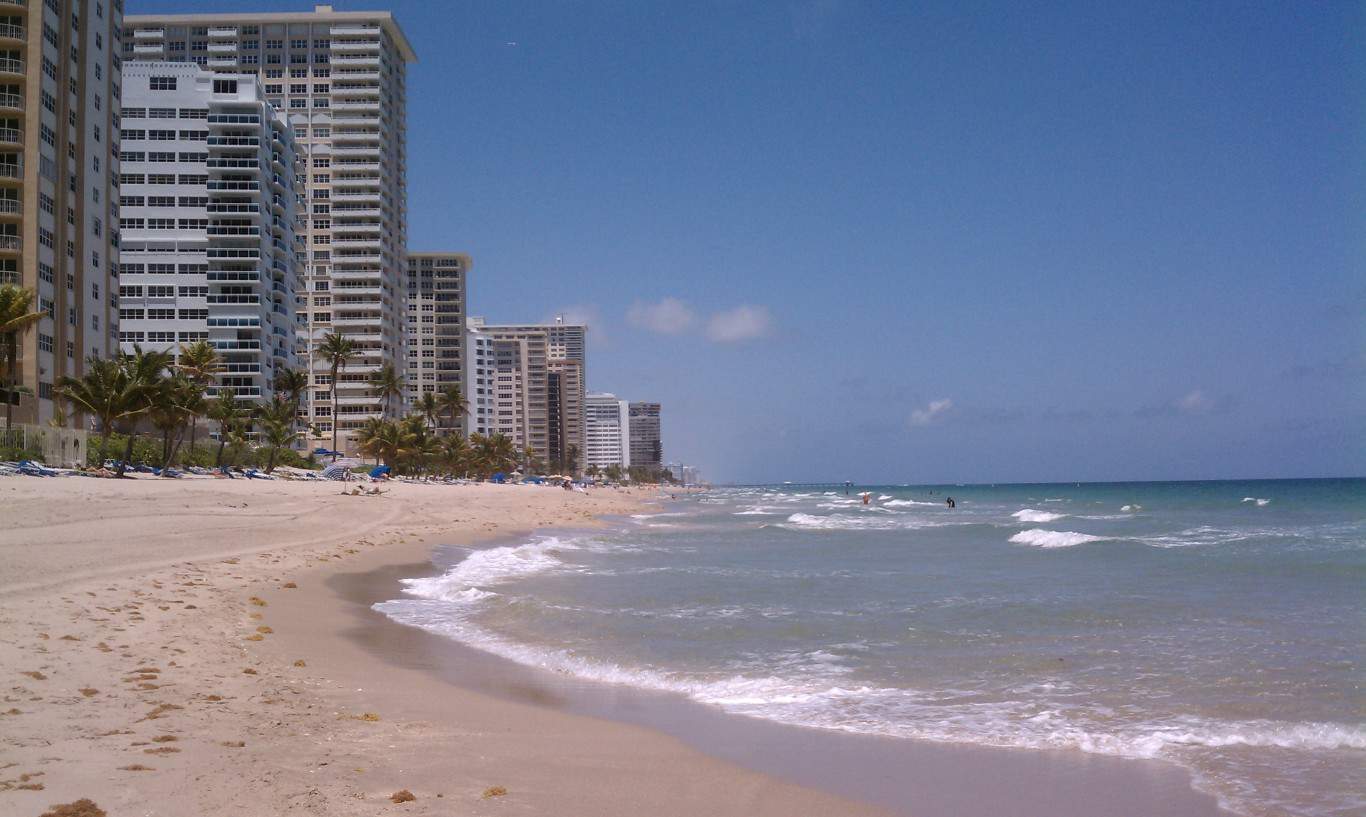
- Change in share of families in middle-income tracts, 2012 to 2022: -16.6 ppts.
- Change in share of families in upper-income tracts, 2012 to 2022: +9.3 ppts.
- Change in share of families in lower-income tracts, 2012 to 2022: +7.3 ppts.
- Median family income, 2022: $87,676
- Total population, 2022: 182,673
2. Murfreesboro, Tennessee
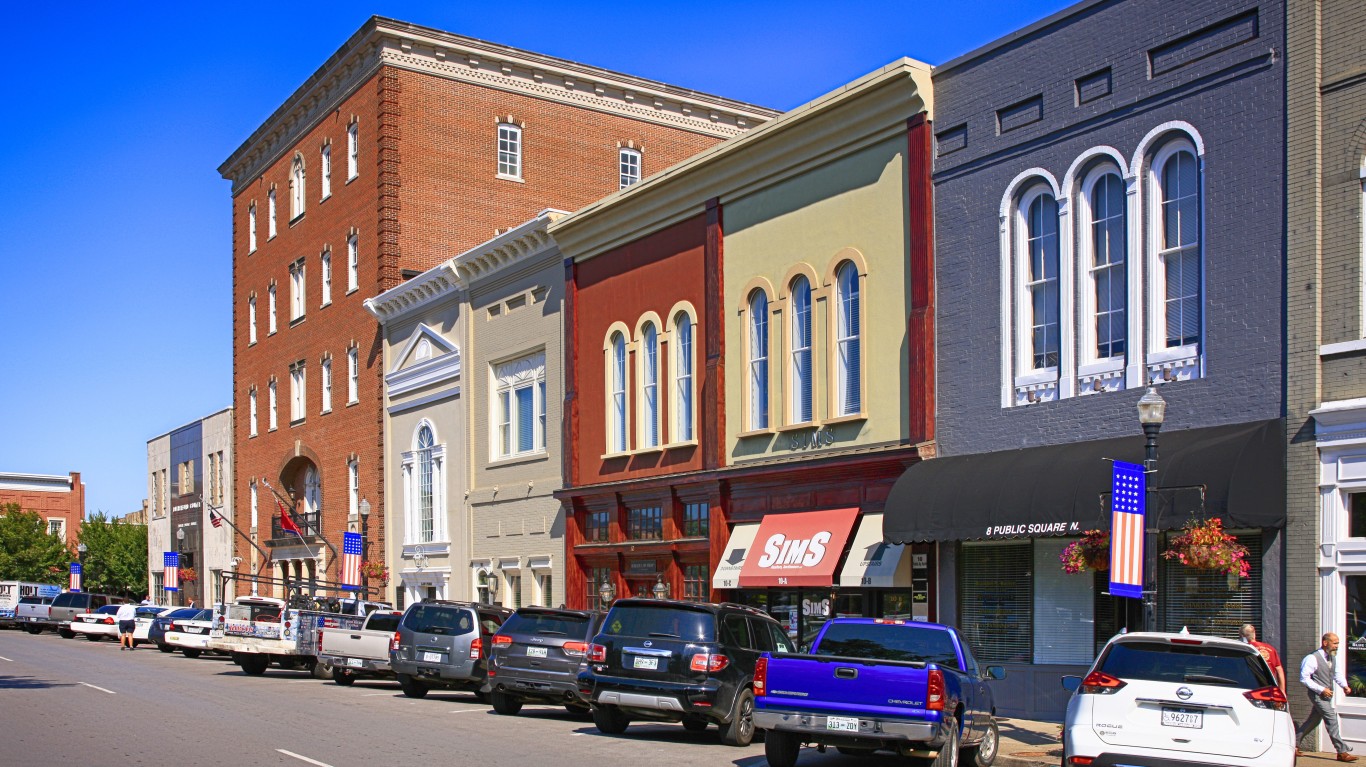
- Change in share of families in middle-income tracts, 2012 to 2022: -16.7 ppts.
- Change in share of families in upper-income tracts, 2012 to 2022: +2.1 ppts.
- Change in share of families in lower-income tracts, 2012 to 2022: +14.6 ppts.
- Median family income, 2022: $90,863
- Total population, 2022: 153,487
1. Jersey City, New Jersey

- Change in share of families in middle-income tracts, 2012 to 2022: -20.1 ppts.
- Change in share of families in upper-income tracts, 2012 to 2022: +10.4 ppts.
- Change in share of families in lower-income tracts, 2012 to 2022: +9.7 ppts.
- Median family income, 2022: $102,072
- Total population, 2022: 287,899
ALERT: Take This Retirement Quiz Now (Sponsored)
Take the quiz below to get matched with a financial advisor today.
Each advisor has been vetted by SmartAsset and is held to a fiduciary standard to act in your best interests.
Here’s how it works:
1. Answer SmartAsset advisor match quiz
2. Review your pre-screened matches at your leisure. Check out the advisors’ profiles.
3. Speak with advisors at no cost to you. Have an introductory call on the phone or introduction in person and choose whom to work with in the future
Take the retirement quiz right here.
The post The Gap Between Rich and Poor Has Never Been Wider In These Towns appeared first on 24/7 Wall St..