24/7 Wall St. Insights
- This election cycle, Harris and Trump campaigns are focusing their resources on a handful of key swing-states, where the election will likely be decided.
- In most of the rest of the country, including California, the outcome of the race is effectively predetermined.
- California’s status as a Democratic stronghold is evidenced, in part, by historical voting patterns in several deep-blue counties.
- Also: Discover the next Nvidia
Election Day is less than 60 days away, and the two major party candidates — Democrat Kamala Harris and Republican Donald Trump — are locked in a very close race. According to a New York Times analysis of national polls, Harris is currently leading her opponent, with support from 49% of voters compared to Trump’s 47%. These numbers are expected to shift in the coming weeks, but even if Harris maintains her slim advantage in the national polls, a Democratic victory is by no means guaranteed. (Here is a look at the Americans most likely to vote for Kamala Harris.)
As has been the case in other recent presidential elections, the outcome of the 2024 race will likely come down to a handful of closely contested swing states. This election cycle, the most competitive states, where both campaigns are focusing their resources, are Arizona, Georgia, Michigan, Nevada, North Carolina, Pennsylvania, and Wisconsin. In these places, the candidates are polling so closely that either one has a reasonable chance of winning in November. (This is how Trump and Harris are polling in every key swing state.)
In stark contrast to these battleground states, most other states are considered a virtual lock for either Trump or Harris. Based on current polling results, political affiliation of the electorate, and historical voting patterns, California is one of these states. According to official records from the Federal Election Commission, the last time California went to a Republican candidate was in 1988, when the GOP’s George H.W. Bush defeated Michael Dukakis, a Democrat.
California’s status as a Democratic stronghold is driven by voters in certain parts of the state. There are 31 counties in California where, over the last four presidential elections, an average of at least 50% of voters have cast a ballot for the Democratic candidate.
If historical patterns hold up this election year, these same counties will help deliver California and its 54 electoral votes to Harris in November 2024. All historical, county-level, voting statistics are from the MIT Election Data and Science Lab’s County Presidential Election Returns 2000-2020 database, as compiled in the Harvard Dataverse, V13.
These are the most Democratic counties in California.
Why It Matters

Because of the electoral college system, the outcome of presidential elections often comes down to voters in just a handful of closely contested states. In contrast to these battleground states, most of the country has reliably voted either Democratic or Republican in recent presidential elections. These states include California, which, barring any unforeseen shake ups in the race, is all but guaranteed to go to Harris in 2024. Outcomes in states like California are driven, in part, by party strongholds at the county-level.
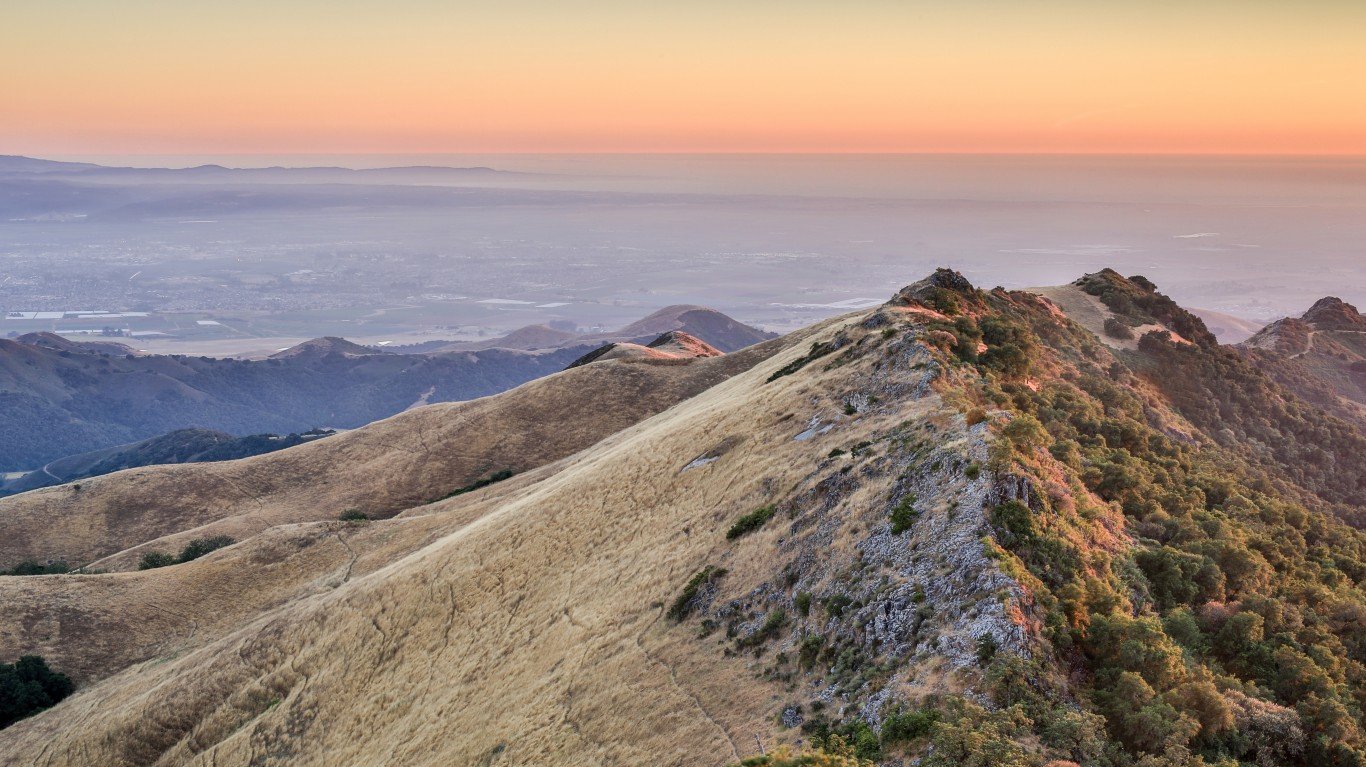
31. Riverside County

- Average popular vote split in last 4 presidential elections: 50.9% Democratic; 46.1% Republican
- Popular vote split in 2020 election: 53.0% Democrat (Joe Biden); 45.0% Republican (Donald Trump)
- Popular vote split in 2016 election: 49.7% Democrat (Hillary Clinton); 44.4% Republican (Donald Trump)
- Popular vote split in 2012 election: 49.7% Democrat (Barack Obama); 48.1% Republican (Mitt Romney)
- Popular vote split in 2008 election: 50.2% Democrat (Barack Obama); 47.9% Republican (John McCain)
- County population: 2,429,487
30. Fresno County
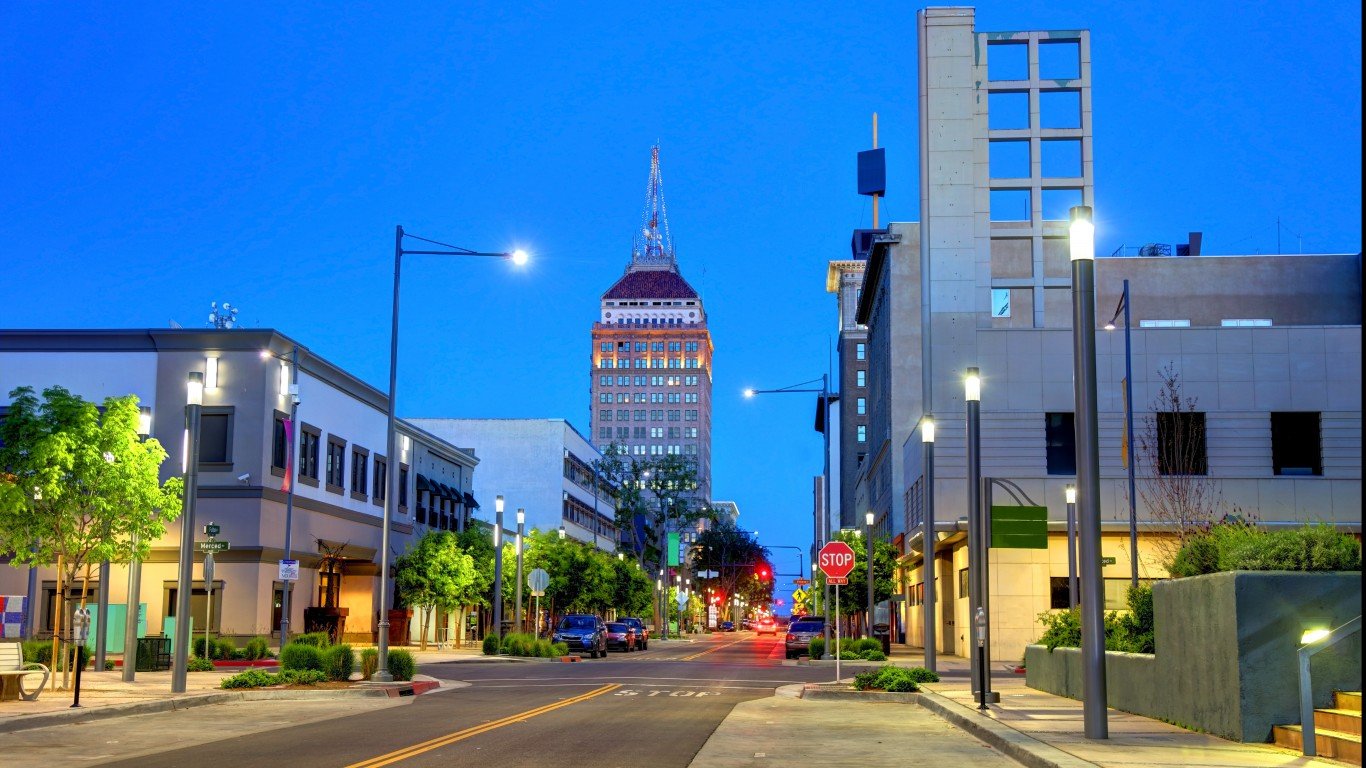
- Average popular vote split in last 4 presidential elections: 50.9% Democratic; 46.2% Republican
- Popular vote split in 2020 election: 52.9% Democrat (Joe Biden); 45.1% Republican (Donald Trump)
- Popular vote split in 2016 election: 50.1% Democrat (Hillary Clinton); 43.9% Republican (Donald Trump)
- Popular vote split in 2012 election: 49.9% Democrat (Barack Obama); 48.1% Republican (Mitt Romney)
- Popular vote split in 2008 election: 50.2% Democrat (Barack Obama); 48.1% Republican (John McCain)
- County population: 1,008,280
29. Nevada County
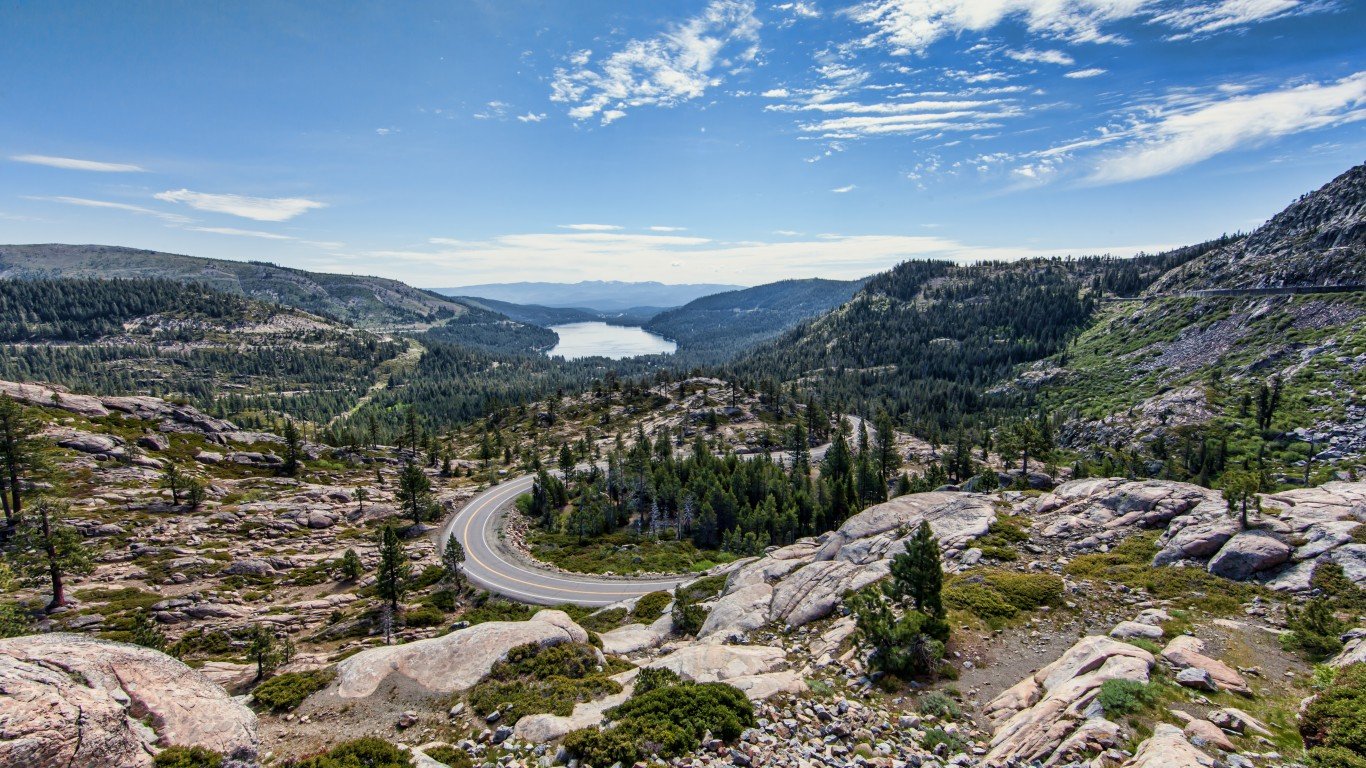
- Average popular vote split in last 4 presidential elections: 51.0% Democratic; 44.4% Republican
- Popular vote split in 2020 election: 56.2% Democrat (Joe Biden); 41.4% Republican (Donald Trump)
- Popular vote split in 2016 election: 47.4% Democrat (Hillary Clinton); 42.5% Republican (Donald Trump)
- Popular vote split in 2012 election: 47.7% Democrat (Barack Obama); 48.4% Republican (Mitt Romney)
- Popular vote split in 2008 election: 51.4% Democrat (Barack Obama); 46.1% Republican (John McCain)
- County population: 102,322
28. San Luis Obispo County
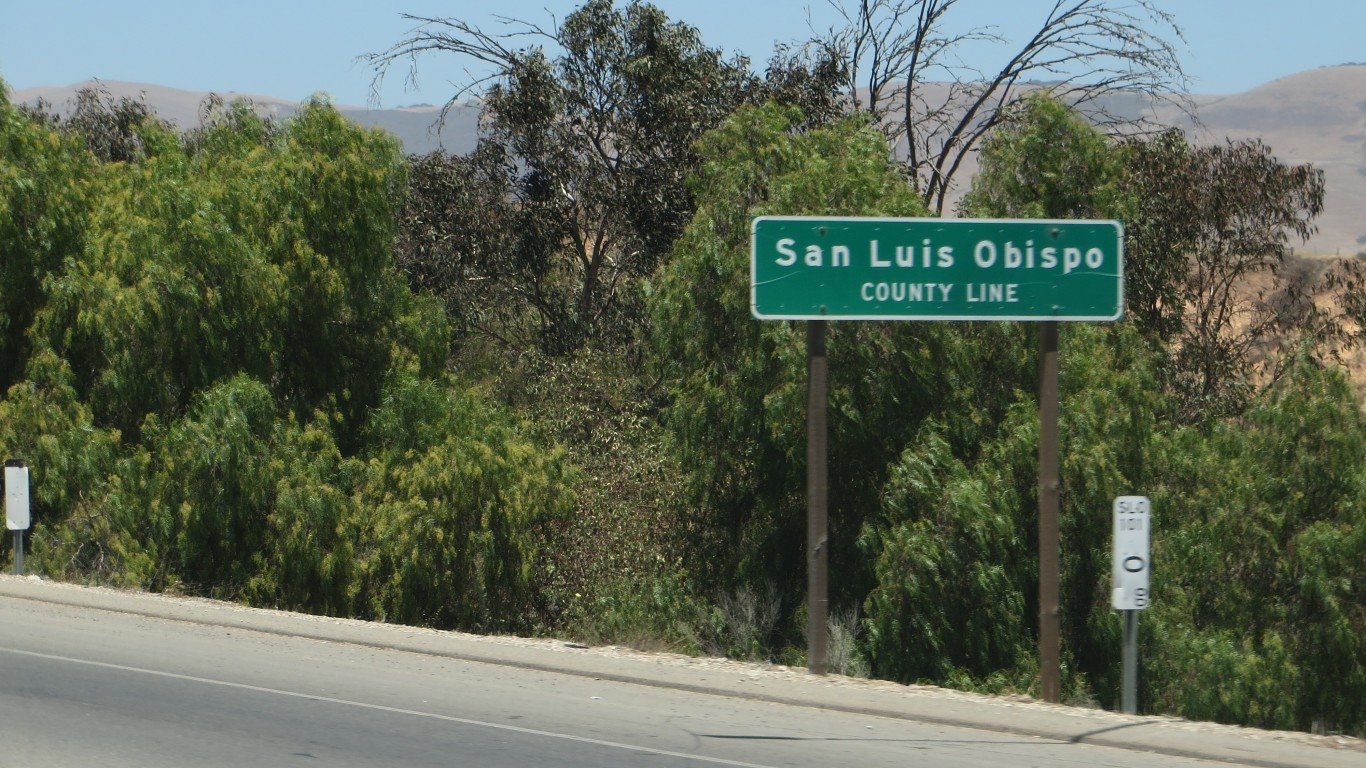
- Average popular vote split in last 4 presidential elections: 51.5% Democratic; 44.2% Republican
- Popular vote split in 2020 election: 55.3% Democrat (Joe Biden); 42.2% Republican (Donald Trump)
- Popular vote split in 2016 election: 49.7% Democrat (Hillary Clinton); 41.6% Republican (Donald Trump)
- Popular vote split in 2012 election: 48.8% Democrat (Barack Obama); 47.7% Republican (Mitt Romney)
- Popular vote split in 2008 election: 51.4% Democrat (Barack Obama); 46.0% Republican (John McCain)
- County population: 281,712
27. San Bernardino County

- Average popular vote split in last 4 presidential elections: 52.8% Democratic; 43.9% Republican
- Popular vote split in 2020 election: 54.2% Democrat (Joe Biden); 43.5% Republican (Donald Trump)
- Popular vote split in 2016 election: 52.1% Democrat (Hillary Clinton); 41.5% Republican (Donald Trump)
- Popular vote split in 2012 election: 52.5% Democrat (Barack Obama); 45.1% Republican (Mitt Romney)
- Popular vote split in 2008 election: 52.1% Democrat (Barack Obama); 45.8% Republican (John McCain)
- County population: 2,180,563
26. Lake County

- Average popular vote split in last 4 presidential elections: 53.3% Democratic; 41.9% Republican
- Popular vote split in 2020 election: 51.9% Democrat (Joe Biden); 45.5% Republican (Donald Trump)
- Popular vote split in 2016 election: 46.9% Democrat (Hillary Clinton); 43.3% Republican (Donald Trump)
- Popular vote split in 2012 election: 56.3% Democrat (Barack Obama); 39.3% Republican (Mitt Romney)
- Popular vote split in 2008 election: 58.2% Democrat (Barack Obama); 38.9% Republican (John McCain)
- County population: 68,024
25. Merced County

- Average popular vote split in last 4 presidential elections: 53.4% Democratic; 43.3% Republican
- Popular vote split in 2020 election: 54.1% Democrat (Joe Biden); 43.5% Republican (Donald Trump)
- Popular vote split in 2016 election: 52.7% Democrat (Hillary Clinton); 40.6% Republican (Donald Trump)
- Popular vote split in 2012 election: 53.2% Democrat (Barack Obama); 44.4% Republican (Mitt Romney)
- Popular vote split in 2008 election: 53.3% Democrat (Barack Obama); 45.0% Republican (John McCain)
- County population: 282,290
24. San Joaquin County
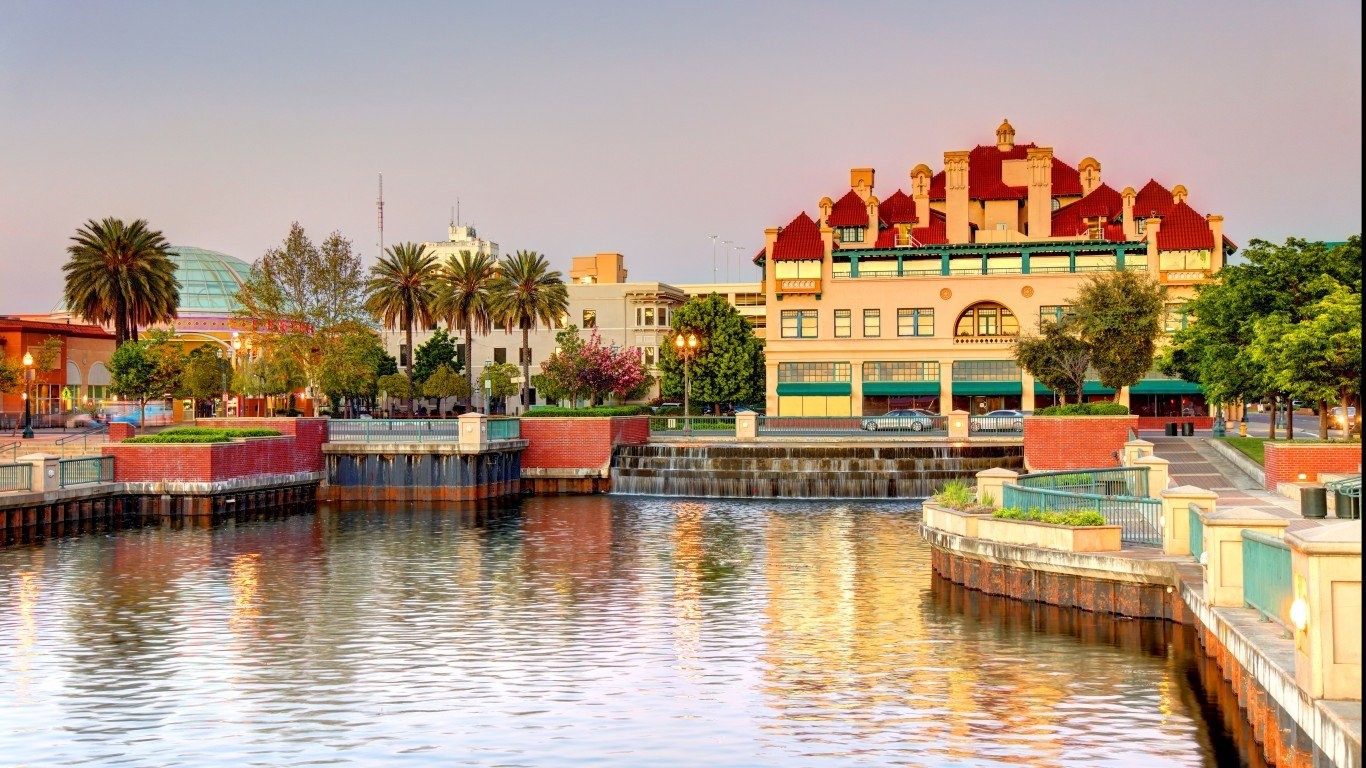
- Average popular vote split in last 4 presidential elections: 55.1% Democratic; 41.8% Republican
- Popular vote split in 2020 election: 55.9% Democrat (Joe Biden); 42.0% Republican (Donald Trump)
- Popular vote split in 2016 election: 54.0% Democrat (Hillary Clinton); 39.7% Republican (Donald Trump)
- Popular vote split in 2012 election: 55.8% Democrat (Barack Obama); 42.0% Republican (Mitt Romney)
- Popular vote split in 2008 election: 54.4% Democrat (Barack Obama); 43.8% Republican (John McCain)
- County population: 779,445
23. Mono County
- Average popular vote split in last 4 presidential elections: 55.4% Democratic; 40.7% Republican
- Popular vote split in 2020 election: 59.6% Democrat (Joe Biden); 37.3% Republican (Donald Trump)
- Popular vote split in 2016 election: 52.6% Democrat (Hillary Clinton); 40.0% Republican (Donald Trump)
- Popular vote split in 2012 election: 52.8% Democrat (Barack Obama); 44.1% Republican (Mitt Romney)
- Popular vote split in 2008 election: 55.5% Democrat (Barack Obama); 42.3% Republican (John McCain)
- County population: 13,219
22. Ventura County
- Average popular vote split in last 4 presidential elections: 55.8% Democratic; 40.8% Republican
- Popular vote split in 2020 election: 59.5% Democrat (Joe Biden); 38.4% Republican (Donald Trump)
- Popular vote split in 2016 election: 55.3% Democrat (Hillary Clinton); 37.6% Republican (Donald Trump)
- Popular vote split in 2012 election: 52.3% Democrat (Barack Obama); 45.3% Republican (Mitt Romney)
- Popular vote split in 2008 election: 55.2% Democrat (Barack Obama); 42.9% Republican (John McCain)
- County population: 842,009
21. San Diego County
- Average popular vote split in last 4 presidential elections: 56.1% Democratic; 40.4% Republican
- Popular vote split in 2020 election: 60.2% Democrat (Joe Biden); 37.5% Republican (Donald Trump)
- Popular vote split in 2016 election: 56.3% Democrat (Hillary Clinton); 36.6% Republican (Donald Trump)
- Popular vote split in 2012 election: 52.6% Democrat (Barack Obama); 45.0% Republican (Mitt Romney)
- Popular vote split in 2008 election: 54.1% Democrat (Barack Obama); 43.9% Republican (John McCain)
- County population: 3,289,701
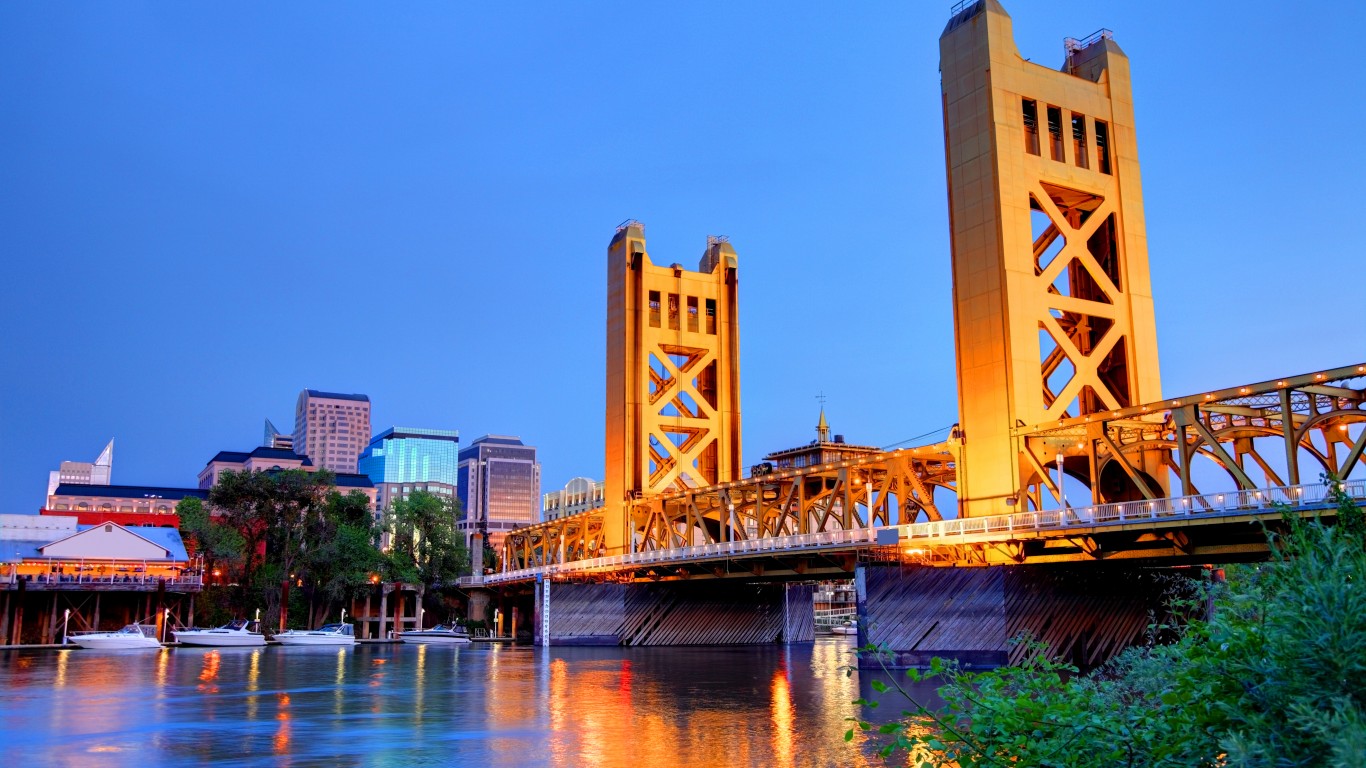
20. Sacramento County
- Average popular vote split in last 4 presidential elections: 59.2% Democratic; 37.0% Republican
- Popular vote split in 2020 election: 61.4% Democrat (Joe Biden); 36.1% Republican (Donald Trump)
- Popular vote split in 2016 election: 58.3% Democrat (Hillary Clinton); 33.9% Republican (Donald Trump)
- Popular vote split in 2012 election: 58.1% Democrat (Barack Obama); 39.2% Republican (Mitt Romney)
- Popular vote split in 2008 election: 58.5% Democrat (Barack Obama); 39.5% Republican (John McCain)
- County population: 1,579,211
19. San Benito County
- Average popular vote split in last 4 presidential elections: 59.6% Democratic; 37.1% Republican
- Popular vote split in 2020 election: 61.1% Democrat (Joe Biden); 36.7% Republican (Donald Trump)
- Popular vote split in 2016 election: 57.1% Democrat (Hillary Clinton); 35.8% Republican (Donald Trump)
- Popular vote split in 2012 election: 59.2% Democrat (Barack Obama); 38.6% Republican (Mitt Romney)
- Popular vote split in 2008 election: 60.5% Democrat (Barack Obama); 37.7% Republican (John McCain)
- County population: 64,753
18. Alpine County
- Average popular vote split in last 4 presidential elections: 60.3% Democratic; 35.3% Republican
- Popular vote split in 2020 election: 64.2% Democrat (Joe Biden); 32.9% Republican (Donald Trump)
- Popular vote split in 2016 election: 55.5% Democrat (Hillary Clinton); 36.0% Republican (Donald Trump)
- Popular vote split in 2012 election: 59.6% Democrat (Barack Obama); 36.1% Republican (Mitt Romney)
- Popular vote split in 2008 election: 61.0% Democrat (Barack Obama); 36.4% Republican (John McCain)
- County population: 1,515
17. Humboldt County
- Average popular vote split in last 4 presidential elections: 61.0% Democratic; 32.4% Republican
- Popular vote split in 2020 election: 65.0% Democrat (Joe Biden); 31.6% Republican (Donald Trump)
- Popular vote split in 2016 election: 56.0% Democrat (Hillary Clinton); 31.0% Republican (Donald Trump)
- Popular vote split in 2012 election: 60.0% Democrat (Barack Obama); 32.8% Republican (Mitt Romney)
- Popular vote split in 2008 election: 62.3% Democrat (Barack Obama); 34.1% Republican (John McCain)
- County population: 136,132
16. Santa Barbara County
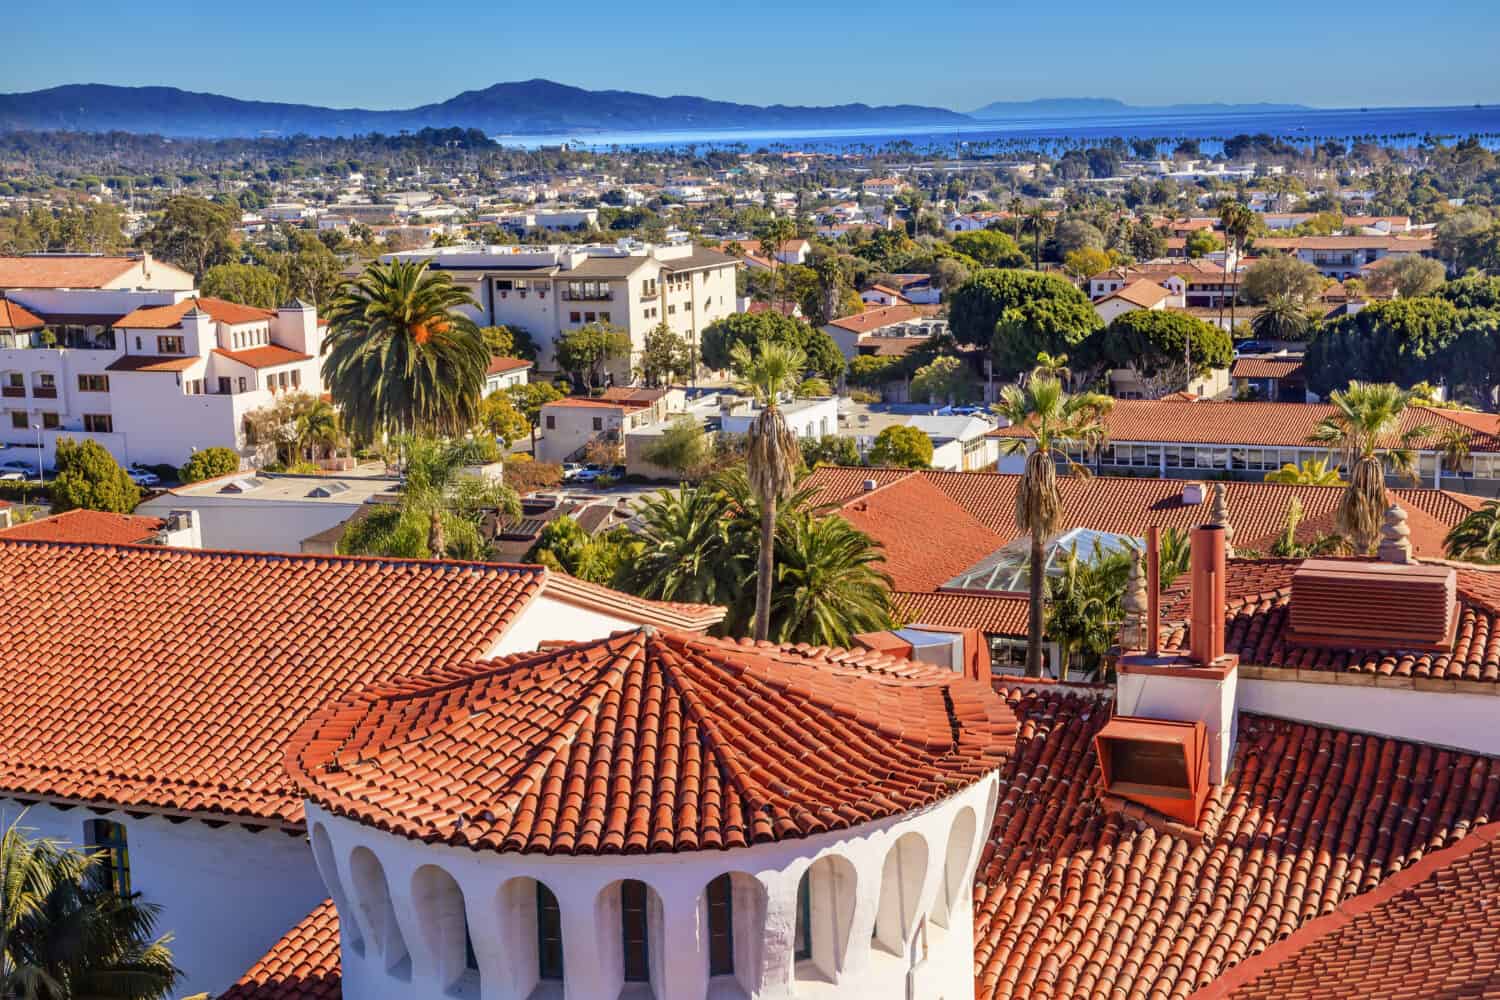
- Average popular vote split in last 4 presidential elections: 61.1% Democratic; 35.3% Republican
- Popular vote split in 2020 election: 64.9% Democrat (Joe Biden); 32.8% Republican (Donald Trump)
- Popular vote split in 2016 election: 60.6% Democrat (Hillary Clinton); 31.9% Republican (Donald Trump)
- Popular vote split in 2012 election: 57.6% Democrat (Barack Obama); 39.6% Republican (Mitt Romney)
- Popular vote split in 2008 election: 60.4% Democrat (Barack Obama); 37.5% Republican (John McCain)
- County population: 445,213
15. Solano County

- Average popular vote split in last 4 presidential elections: 63.2% Democratic; 33.5% Republican
- Popular vote split in 2020 election: 63.9% Democrat (Joe Biden); 33.7% Republican (Donald Trump)
- Popular vote split in 2016 election: 61.6% Democrat (Hillary Clinton); 31.3% Republican (Donald Trump)
- Popular vote split in 2012 election: 63.5% Democrat (Barack Obama); 34.2% Republican (Mitt Romney)
- Popular vote split in 2008 election: 63.4% Democrat (Barack Obama); 34.8% Republican (John McCain)
- County population: 450,995
14. Imperial County
- Average popular vote split in last 4 presidential elections: 64.0% Democratic; 33.1% Republican
- Popular vote split in 2020 election: 61.1% Democrat (Joe Biden); 36.7% Republican (Donald Trump)
- Popular vote split in 2016 election: 67.9% Democrat (Hillary Clinton); 26.4% Republican (Donald Trump)
- Popular vote split in 2012 election: 65.2% Democrat (Barack Obama); 33.1% Republican (Mitt Romney)
- Popular vote split in 2008 election: 62.2% Democrat (Barack Obama); 36.1% Republican (John McCain)
- County population: 179,578
13. Mendocino County
- Average popular vote split in last 4 presidential elections: 65.4% Democratic; 28.6% Republican
- Popular vote split in 2020 election: 66.4% Democrat (Joe Biden); 30.6% Republican (Donald Trump)
- Popular vote split in 2016 election: 58.9% Democrat (Hillary Clinton); 29.1% Republican (Donald Trump)
- Popular vote split in 2012 election: 66.2% Democrat (Barack Obama); 27.6% Republican (Mitt Romney)
- Popular vote split in 2008 election: 69.6% Democrat (Barack Obama); 26.8% Republican (John McCain)
- County population: 91,145
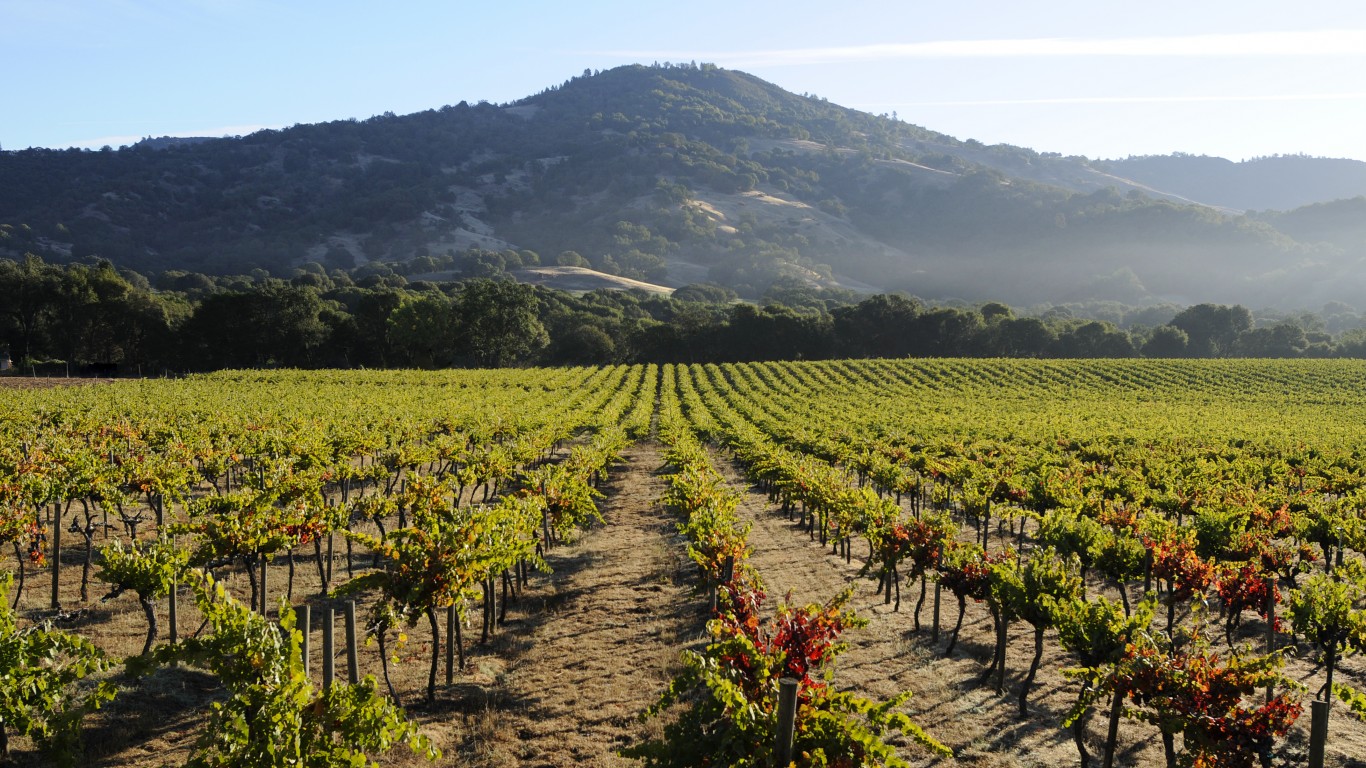
12. Napa County
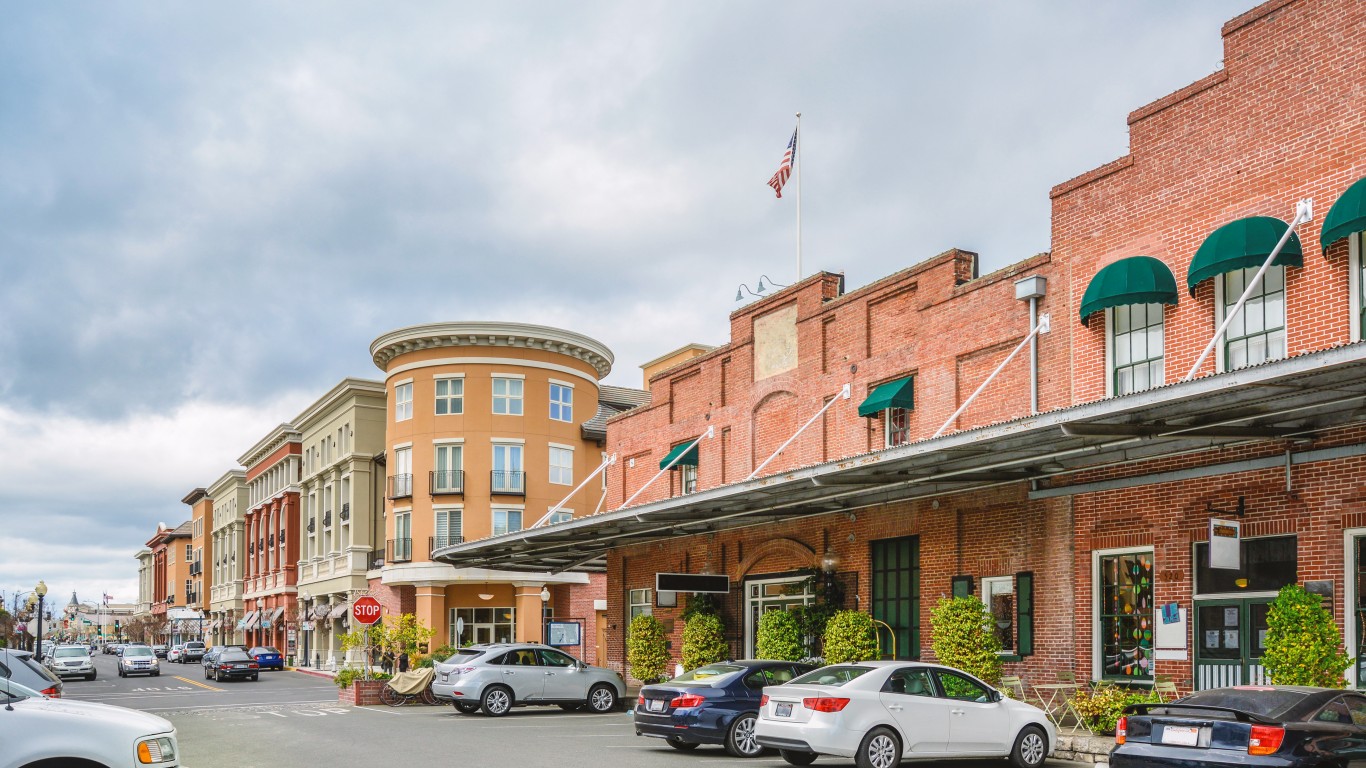
- Average popular vote split in last 4 presidential elections: 65.5% Democratic; 30.8% Republican
- Popular vote split in 2020 election: 69.0% Democrat (Joe Biden); 28.7% Republican (Donald Trump)
- Popular vote split in 2016 election: 63.9% Democrat (Hillary Clinton); 28.4% Republican (Donald Trump)
- Popular vote split in 2012 election: 63.0% Democrat (Barack Obama); 34.3% Republican (Mitt Romney)
- Popular vote split in 2008 election: 65.1% Democrat (Barack Obama); 32.7% Republican (John McCain)
- County population: 137,384
11. Yolo County
- Average popular vote split in last 4 presidential elections: 67.3% Democratic; 28.8% Republican
- Popular vote split in 2020 election: 69.5% Democrat (Joe Biden); 28.1% Republican (Donald Trump)
- Popular vote split in 2016 election: 66.7% Democrat (Hillary Clinton); 25.3% Republican (Donald Trump)
- Popular vote split in 2012 election: 65.4% Democrat (Barack Obama); 31.4% Republican (Mitt Romney)
- Popular vote split in 2008 election: 67.1% Democrat (Barack Obama); 30.8% Republican (John McCain)
- County population: 217,141
10. Monterey County
- Average popular vote split in last 4 presidential elections: 68.0% Democratic; 28.6% Republican
- Popular vote split in 2020 election: 69.5% Democrat (Joe Biden); 28.2% Republican (Donald Trump)
- Popular vote split in 2016 election: 66.8% Democrat (Hillary Clinton); 26.2% Republican (Donald Trump)
- Popular vote split in 2012 election: 67.1% Democrat (Barack Obama); 30.3% Republican (Mitt Romney)
- Popular vote split in 2008 election: 68.2% Democrat (Barack Obama); 29.9% Republican (John McCain)
- County population: 437,609
9. Contra Costa County
- Average popular vote split in last 4 presidential elections: 68.8% Democratic; 28.0% Republican
- Popular vote split in 2020 election: 71.6% Democrat (Joe Biden); 26.3% Republican (Donald Trump)
- Popular vote split in 2016 election: 68.5% Democrat (Hillary Clinton); 24.9% Republican (Donald Trump)
- Popular vote split in 2012 election: 66.4% Democrat (Barack Obama); 31.2% Republican (Mitt Romney)
- Popular vote split in 2008 election: 68.0% Democrat (Barack Obama); 30.2% Republican (John McCain)
- County population: 1,162,648
8. Los Angeles County
- Average popular vote split in last 4 presidential elections: 70.5% Democratic; 26.5% Republican
- Popular vote split in 2020 election: 71.0% Democrat (Joe Biden); 26.9% Republican (Donald Trump)
- Popular vote split in 2016 election: 71.8% Democrat (Hillary Clinton); 22.4% Republican (Donald Trump)
- Popular vote split in 2012 election: 69.7% Democrat (Barack Obama); 27.8% Republican (Mitt Romney)
- Popular vote split in 2008 election: 69.2% Democrat (Barack Obama); 28.8% Republican (John McCain)
- County population: 9,936,690
7. Santa Clara County
- Average popular vote split in last 4 presidential elections: 71.3% Democratic; 25.3% Republican
- Popular vote split in 2020 election: 72.6% Democrat (Joe Biden); 25.2% Republican (Donald Trump)
- Popular vote split in 2016 election: 72.7% Democrat (Hillary Clinton); 20.6% Republican (Donald Trump)
- Popular vote split in 2012 election: 70.1% Democrat (Barack Obama); 27.2% Republican (Mitt Romney)
- Popular vote split in 2008 election: 69.4% Democrat (Barack Obama); 28.6% Republican (John McCain)
- County population: 1,916,831
6. Sonoma County

- Average popular vote split in last 4 presidential elections: 72.3% Democratic; 23.6% Republican
- Popular vote split in 2020 election: 74.5% Democrat (Joe Biden); 23.0% Republican (Donald Trump)
- Popular vote split in 2016 election: 69.4% Democrat (Hillary Clinton); 22.2% Republican (Donald Trump)
- Popular vote split in 2012 election: 71.1% Democrat (Barack Obama); 25.3% Republican (Mitt Romney)
- Popular vote split in 2008 election: 73.6% Democrat (Barack Obama); 24.0% Republican (John McCain)
- County population: 488,436
5. San Mateo County
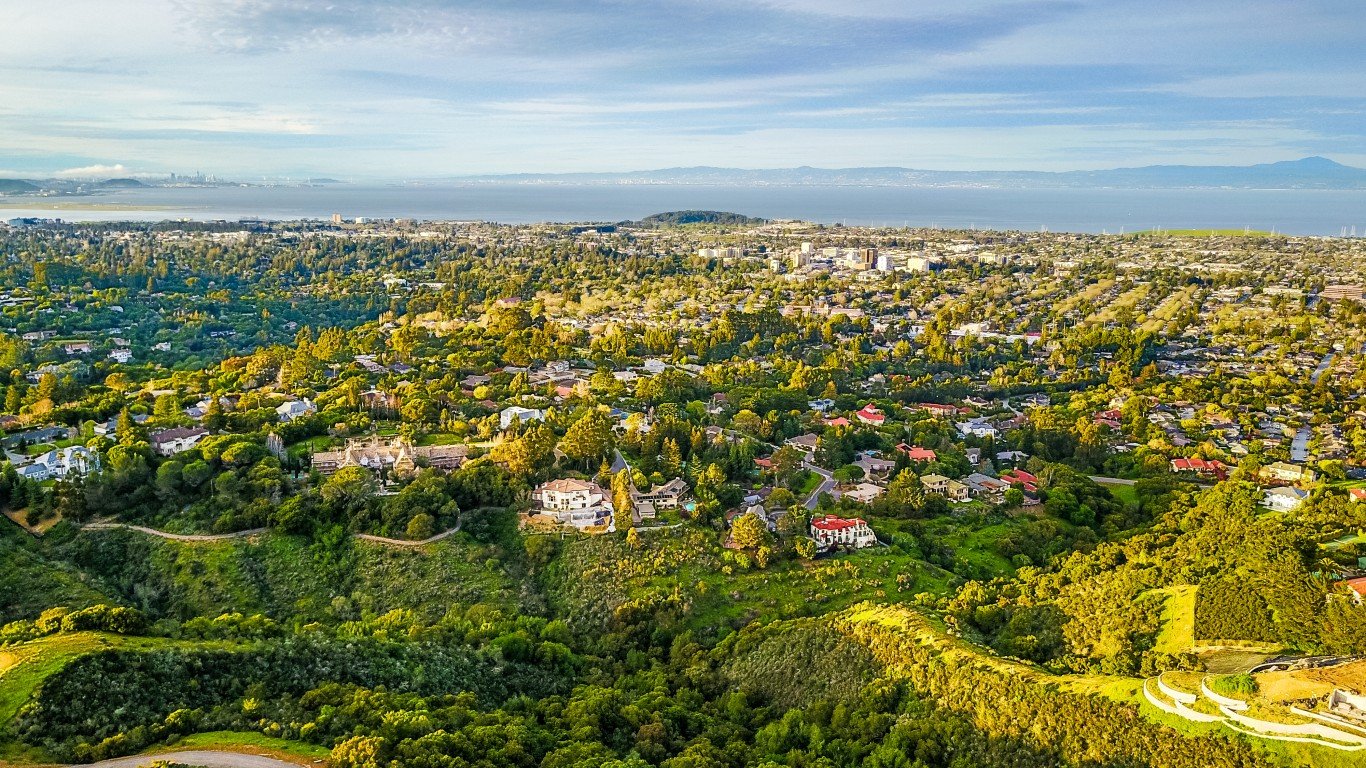
- Average popular vote split in last 4 presidential elections: 75.0% Democratic; 22.0% Republican
- Popular vote split in 2020 election: 77.9% Democrat (Joe Biden); 20.2% Republican (Donald Trump)
- Popular vote split in 2016 election: 75.7% Democrat (Hillary Clinton); 18.4% Republican (Donald Trump)
- Popular vote split in 2012 election: 72.1% Democrat (Barack Obama); 25.5% Republican (Mitt Romney)
- Popular vote split in 2008 election: 73.5% Democrat (Barack Obama); 24.7% Republican (John McCain)
- County population: 754,250
4. Santa Cruz County
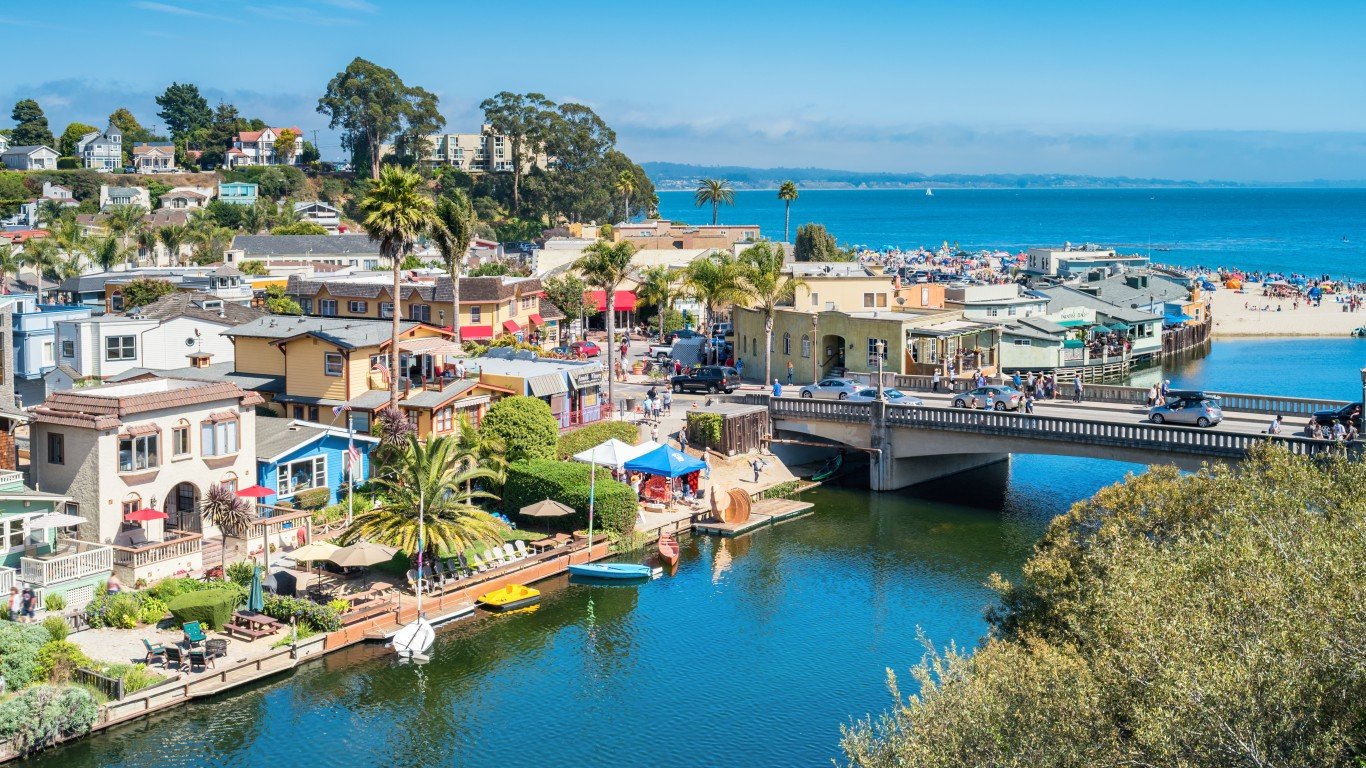
- Average popular vote split in last 4 presidential elections: 76.6% Democratic; 18.9% Republican
- Popular vote split in 2020 election: 78.9% Democrat (Joe Biden); 18.6% Republican (Donald Trump)
- Popular vote split in 2016 election: 73.9% Democrat (Hillary Clinton); 17.4% Republican (Donald Trump)
- Popular vote split in 2012 election: 75.6% Democrat (Barack Obama); 20.0% Republican (Mitt Romney)
- Popular vote split in 2008 election: 77.5% Democrat (Barack Obama); 19.8% Republican (John McCain)
- County population: 268,571
3. Marin County

- Average popular vote split in last 4 presidential elections: 78.3% Democratic; 18.5% Republican
- Popular vote split in 2020 election: 82.3% Democrat (Joe Biden); 15.8% Republican (Donald Trump)
- Popular vote split in 2016 election: 78.1% Democrat (Hillary Clinton); 15.6% Republican (Donald Trump)
- Popular vote split in 2012 election: 74.3% Democrat (Barack Obama); 23.0% Republican (Mitt Romney)
- Popular vote split in 2008 election: 78.0% Democrat (Barack Obama); 20.2% Republican (John McCain)
- County population: 260,485
2. Alameda County

- Average popular vote split in last 4 presidential elections: 79.2% Democratic; 17.4% Republican
- Popular vote split in 2020 election: 80.2% Democrat (Joe Biden); 17.7% Republican (Donald Trump)
- Popular vote split in 2016 election: 78.7% Democrat (Hillary Clinton); 14.7% Republican (Donald Trump)
- Popular vote split in 2012 election: 78.9% Democrat (Barack Obama); 18.2% Republican (Mitt Romney)
- Popular vote split in 2008 election: 78.8% Democrat (Barack Obama); 19.3% Republican (John McCain)
- County population: 1,663,823
1. San Francisco County
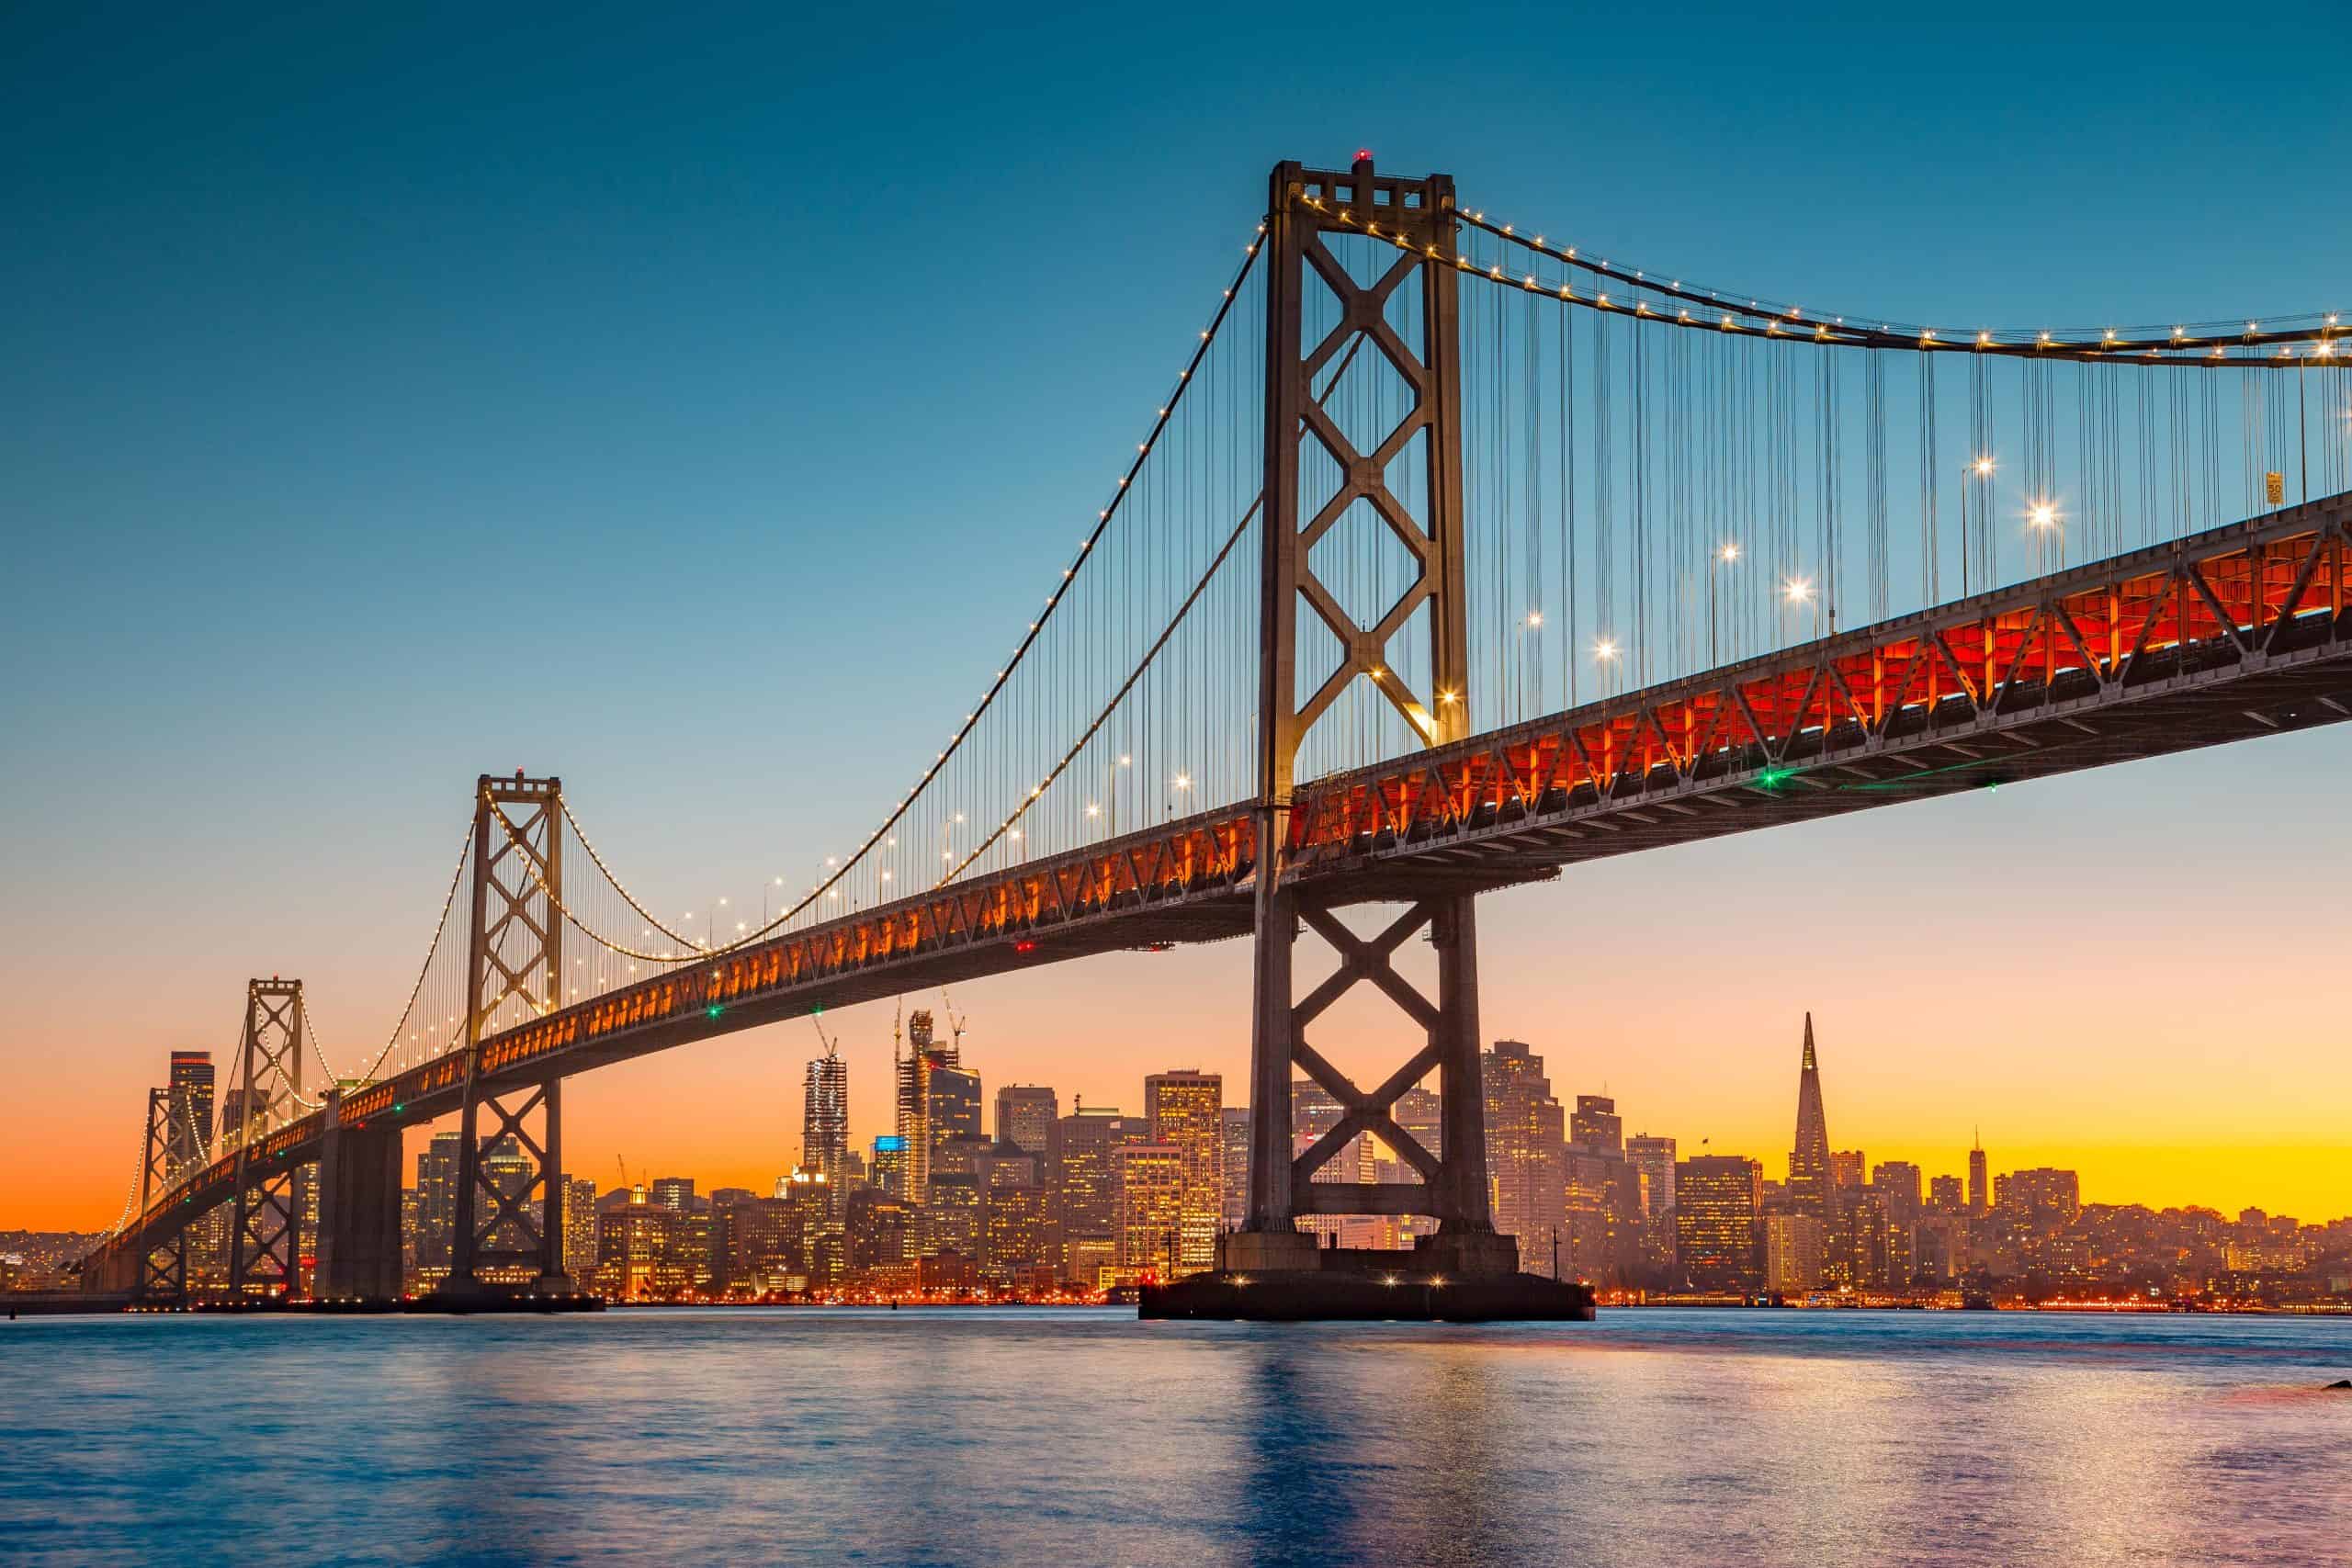
- Average popular vote split in last 4 presidential elections: 84.5% Democratic; 12.1% Republican
- Popular vote split in 2020 election: 85.3% Democrat (Joe Biden); 12.7% Republican (Donald Trump)
- Popular vote split in 2016 election: 85.0% Democrat (Hillary Clinton); 9.3% Republican (Donald Trump)
- Popular vote split in 2012 election: 83.5% Democrat (Barack Obama); 13.0% Republican (Mitt Romney)
- Popular vote split in 2008 election: 84.2% Democrat (Barack Obama); 13.7% Republican (John McCain)
- County population: 851,036
“The Next NVIDIA” Could Change Your Life
If you missed out on NVIDIA’s historic run, your chance to see life-changing profits from AI isn’t over.
The 24/7 Wall Street Analyst who first called NVIDIA’s AI-fueled rise in 2009 just published a brand-new research report named “The Next NVIDIA.”
Click here to download your FREE copy.
The post These Are the Bluest Counties in One of the Most Democratic States appeared first on 24/7 Wall St..