24/7 Wall St. Insights
- 24/7 Wall St. reviewed data on U.S. military spending from the Stockholm International Peace Research Institute Military Expenditure Database.
- The 1980s saw the biggest rise in military spending in the past 50 years.
- Also, Discover “The Next NVIDIA”
The United States legislature has approved the 2024 budget to include $841.4 billion for the Department of Defense (DOD), $32.4 billion for national security programs within the Department of Energy (DOE), and $438.0 million in defense-related activities. Following a trend of mostly increasing spending, the budget has grown exponentially since the early 1970s. The 1973 budget was $81.47 billion.
The 1980s showed the fastest rise in military spending, with 1982 increasing 25% over 1981’s budget. And the year before that, spending had increased nearly 23% from the previous year. Although 2022 marks an all-time high in spending, it’s not the highest portion of the GDP. In 2022, military spending as a percentage of the GDP will be 3.45%. That’s quite a bit lower than the 6 to 7% average of the 1980s.
Here, 24/7 Wall St. is taking a closer look at how much the United States has spent on its armed forces over the years. To identify what the U.S. spent on the military each year over the last 50 years, 24/7 Wall St. reviewed data on U.S. military spending from the Stockholm International Peace Research Institute Military Expenditure Database, listing the years 1973-2022. Figures are in current U.S. dollars. We also calculated the percentage change in military spending from the previous year and the spending as a percent of GDP.
The U.S. military budget increased significantly in the 1970s during the Vietnam War. The early ’70s brought a more than 50% increase from 1965 when the U.S. first sent troops into Southeast Asia. After the Vietnam War ended, the 1980s brought accelerated military spending. This surge came under President Ronald Reagan, practically tripling the military expenditures of the Vietnam era.
By the 1990s, defense spending stabilized or even declined in some years. But the terrorist attack of Sept. 11, 2001, changed everything. Spending ramped up from here as the U.S. embarked on the War on Terror, again increasing defense expenditures significantly for the following decades.
Why Are We Covering This?

U.S. military expenditure is important for maintaining national security in what is an uncertain geopolitical landscape. It ensures the readiness and capability of armed forces to deter potential adversaries and respond effectively to threats. 24/7 Wall St. is looking at total military spending and spending as a percentage of GDP to get a full picture of US military spending over the years.
Here is a look at U.S. military expenditures over the last 50 years:
1973: $ 81.47 billion
- Percent change in spending: 0.94% – #39 largest year-over-year increase
- Spending as a percent of GDP: 5.89%
1974: $ 89.28 billion
- Percent change in spending: 9.59% – #12 largest year-over-year increase
- Spending as a percent of GDP: 5.95%
1975: $ 92.08 billion
- Percent change in spending: 3.14% – #29 largest year-over-year increase
- Spending as a percent of GDP: 5.62%
1976: $ 94.72 billion
- Percent change in spending: 2.86% – #31 largest year-over-year increase
- Spending as a percent of GDP: 5.19%
1977: $ 104.67 billion
- Percent change in spending: 10.51% – #10 largest year-over-year increase
- Spending as a percent of GDP: 5.16%
1978: $ 113.38 billion
- Percent change in spending: 8.33% – #16 largest year-over-year increase
- Spending as a percent of GDP: 4.94%
1979: $ 126.88 billion
- Percent change in spending: 11.90% – #7 largest year-over-year increase
- Spending as a percent of GDP: 4.95%
1980: $ 143.69 billion
- Percent change in spending: 13.25% – #5 largest year-over-year increase
- Spending as a percent of GDP: 5.15%
1981: $ 176.56 billion
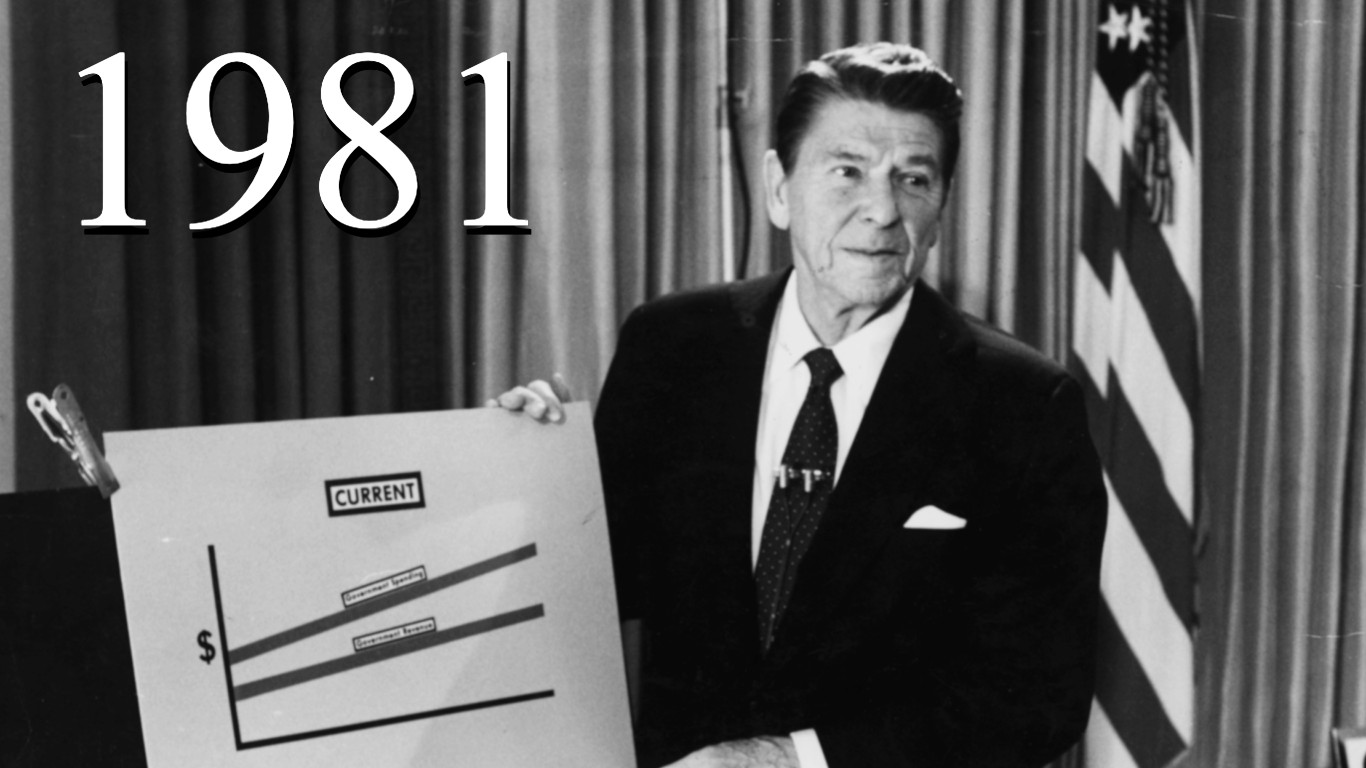
- Percent change in spending: 22.88% – #2 largest year-over-year increase
- Spending as a percent of GDP: 5.65%
1982: $ 221.67 billion
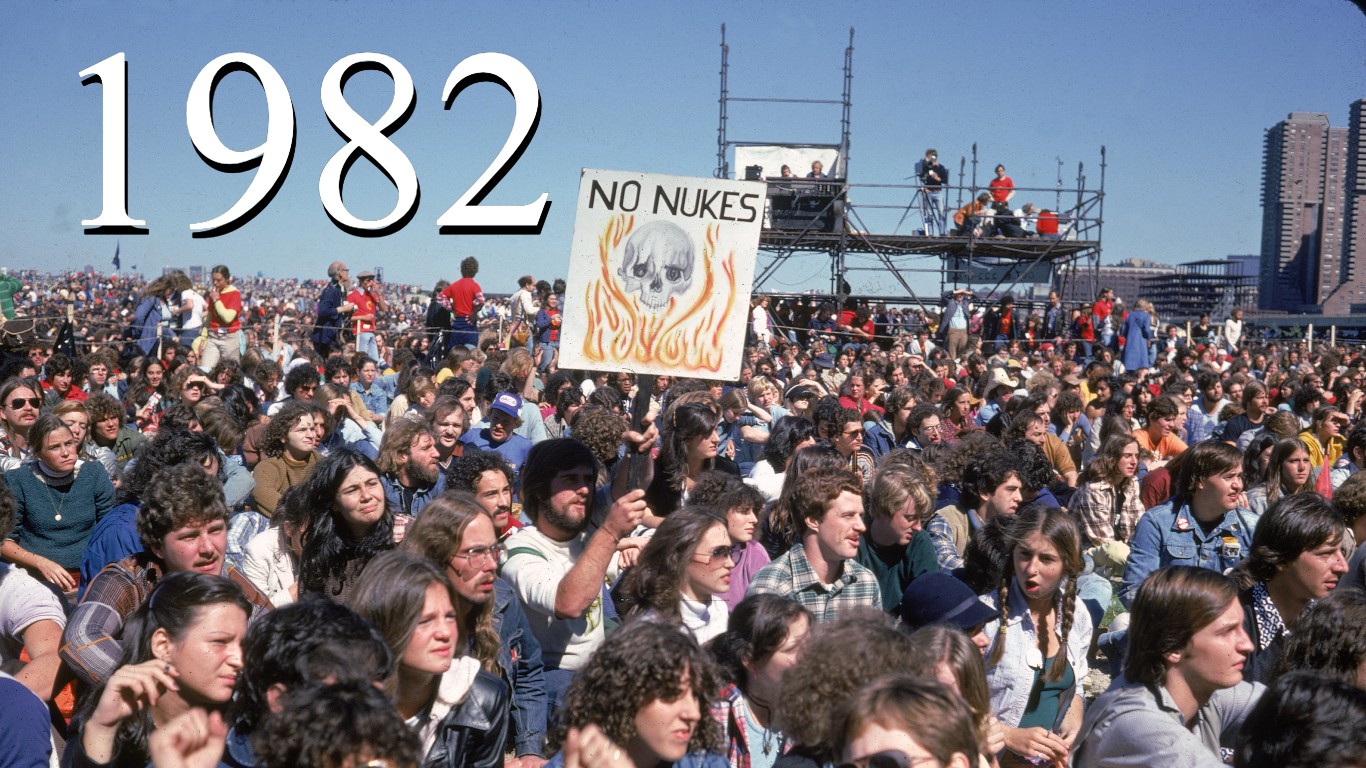
- Percent change in spending: 25.55% – #1 largest year-over-year increase
- Spending as a percent of GDP: 6.81%
1983: $ 223.43 billion
- Percent change in spending: 0.79% – #40 largest year-over-year increase
- Spending as a percent of GDP: 6.32%
1984: $ 245.15 billion
- Percent change in spending: 9.72% – #11 largest year-over-year increase
- Spending as a percent of GDP: 6.24%
1985: $ 272.16 billion
- Percent change in spending: 11.02% – #9 largest year-over-year increase
- Spending as a percent of GDP: 6.45%
1986: $ 295.55 billion
- Percent change in spending: 8.59% – #14 largest year-over-year increase
- Spending as a percent of GDP: 6.63%
1987: $ 304.09 billion
- Percent change in spending: 2.89% – #30 largest year-over-year increase
- Spending as a percent of GDP: 6.42%
1988: $ 309.66 billion
- Percent change in spending: 1.83% – #34 largest year-over-year increase
- Spending as a percent of GDP: 6.07%
1989: $ 321.87 billion
- Percent change in spending: 3.94% – #26 largest year-over-year increase
- Spending as a percent of GDP: 5.87%
1990: $ 325.13 billion
- Percent change in spending: 1.01% – #37 largest year-over-year increase
- Spending as a percent of GDP: 5.61%
1991: $ 299.37 billion
- Percent change in spending: -7.92% – #1 largest year over year decrease
- Spending as a percent of GDP: 4.88%
1992: $ 325.03 billion
- Percent change in spending: 8.57% – #15 largest year-over-year increase
- Spending as a percent of GDP: 4.97%
1993: $ 316.72 billion
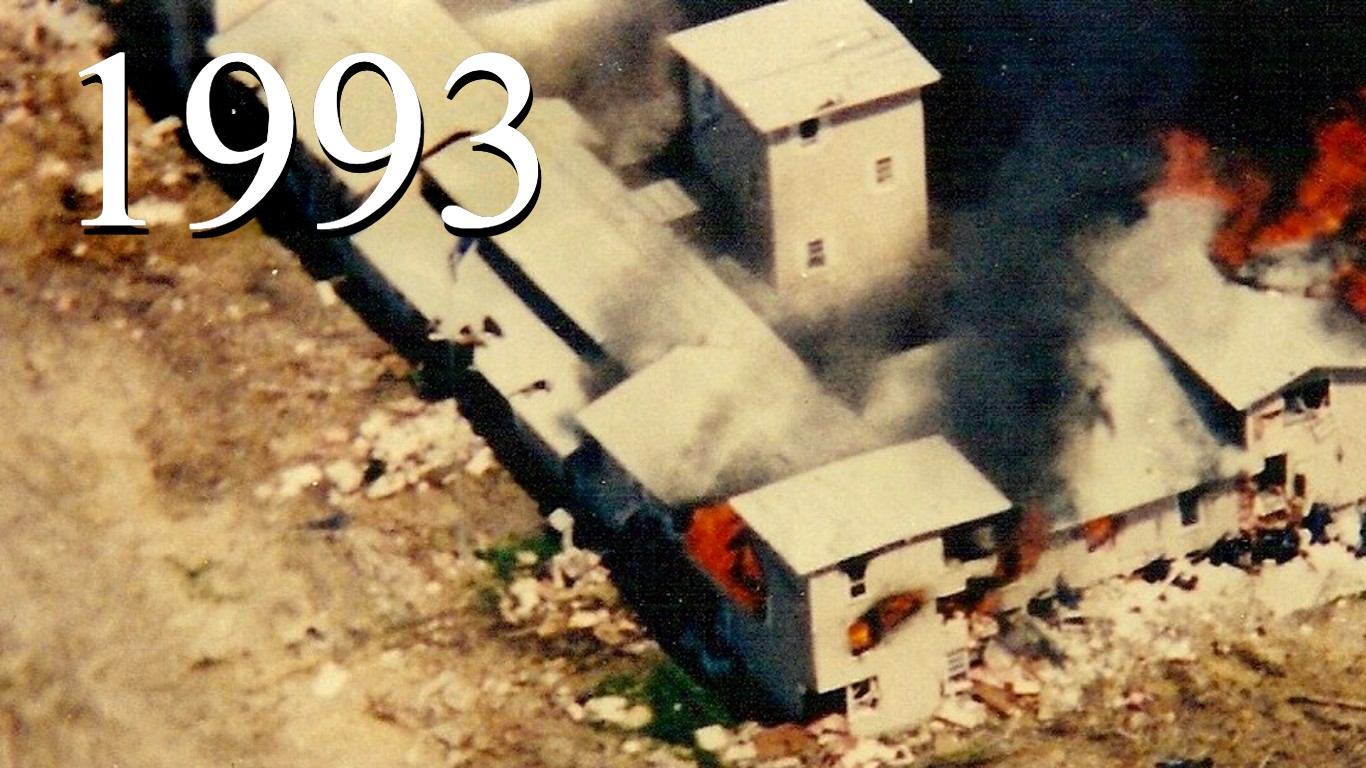
- Percent change in spending: -2.56% – #8 largest year over year decrease
- Spending as a percent of GDP: 4.60%
1994: $ 308.08 billion
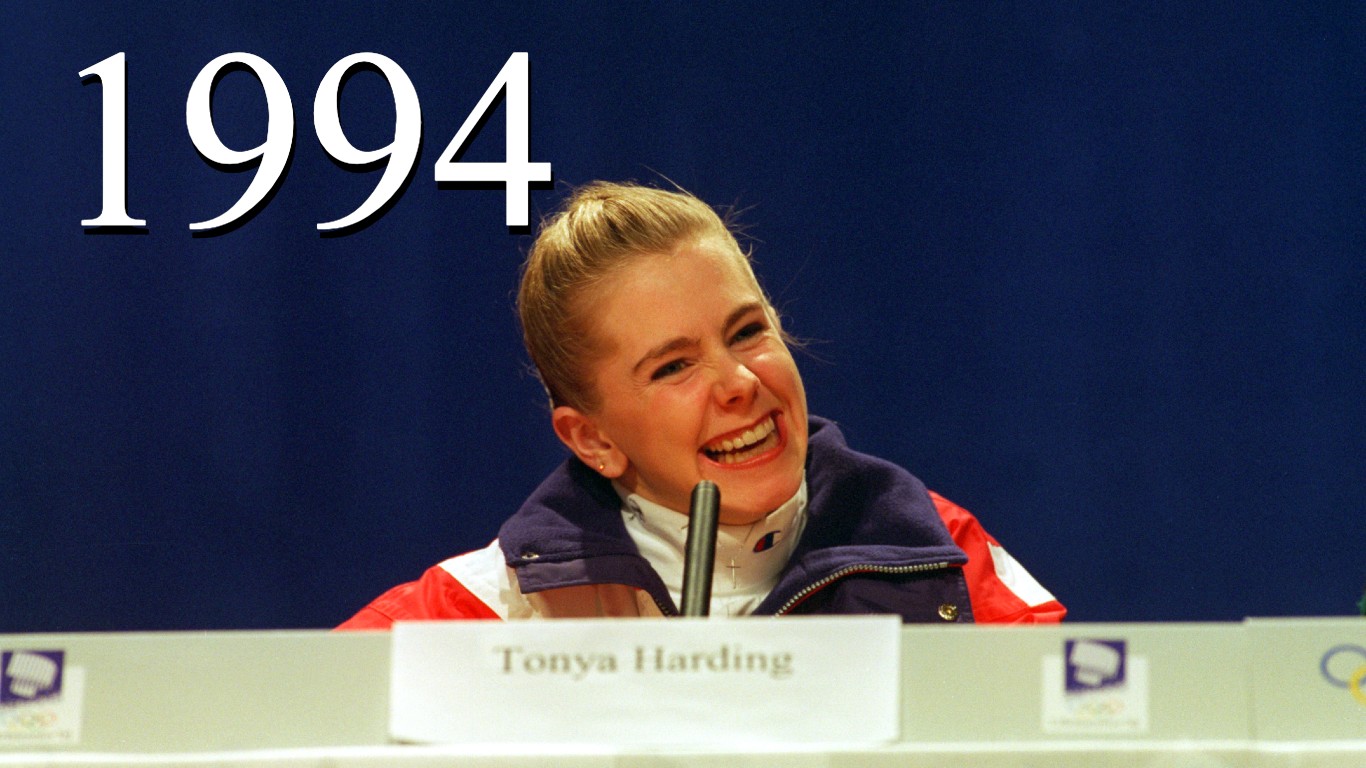
- Percent change in spending: -2.73% – #6 largest year over year decrease
- Spending as a percent of GDP: 4.22%
1995: $ 295.85 billion
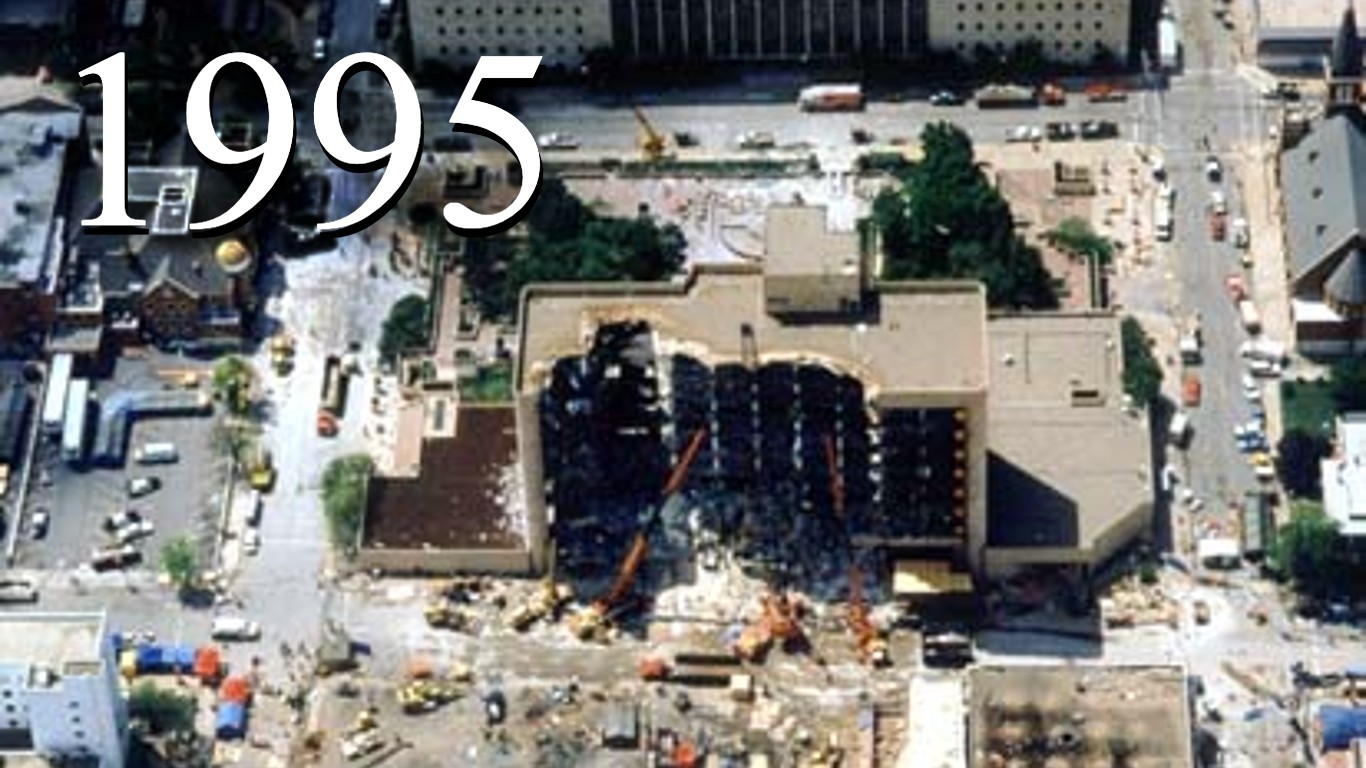
- Percent change in spending: -3.97% – #4 largest year over year decrease
- Spending as a percent of GDP: 3.86%
1996: $ 287.96 billion
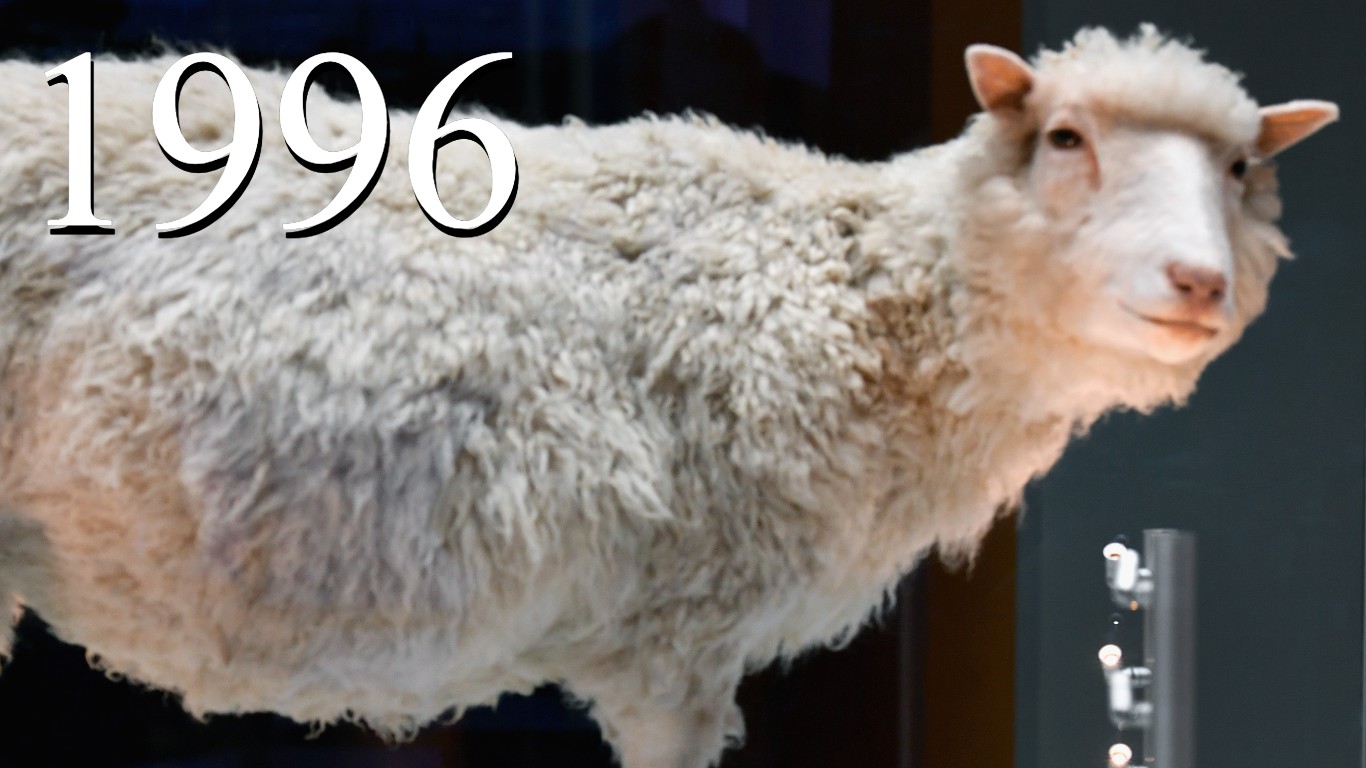
- Percent change in spending: -2.67% – #7 largest year over year decrease
- Spending as a percent of GDP: 3.55%
1997: $ 293.17 billion
- Percent change in spending: 1.81% – #35 largest year-over-year increase
- Spending as a percent of GDP: 3.41%
1998: $ 291.00 billion
- Percent change in spending: -0.74% – #10 largest year over year decrease
- Spending as a percent of GDP: 3.20%
1999: $ 298.09 billion
- Percent change in spending: 2.44% – #32 largest year-over-year increase
- Spending as a percent of GDP: 3.09%
2000: $ 320.09 billion
- Percent change in spending: 7.38% – #20 largest year-over-year increase
- Spending as a percent of GDP: 3.11%
2001: $ 331.81 billion
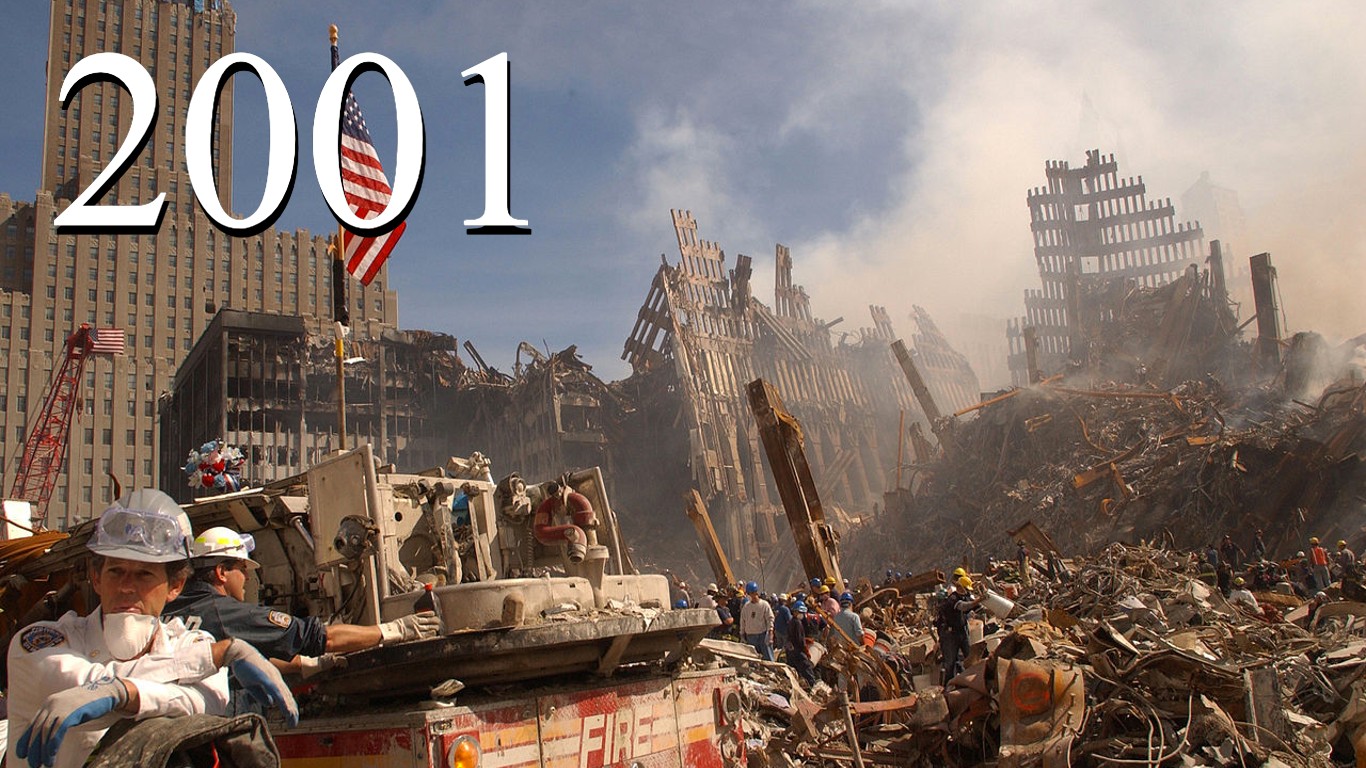
- Percent change in spending: 3.66% – #27 largest year-over-year increase
- Spending as a percent of GDP: 3.12%
2002: $ 378.46 billion
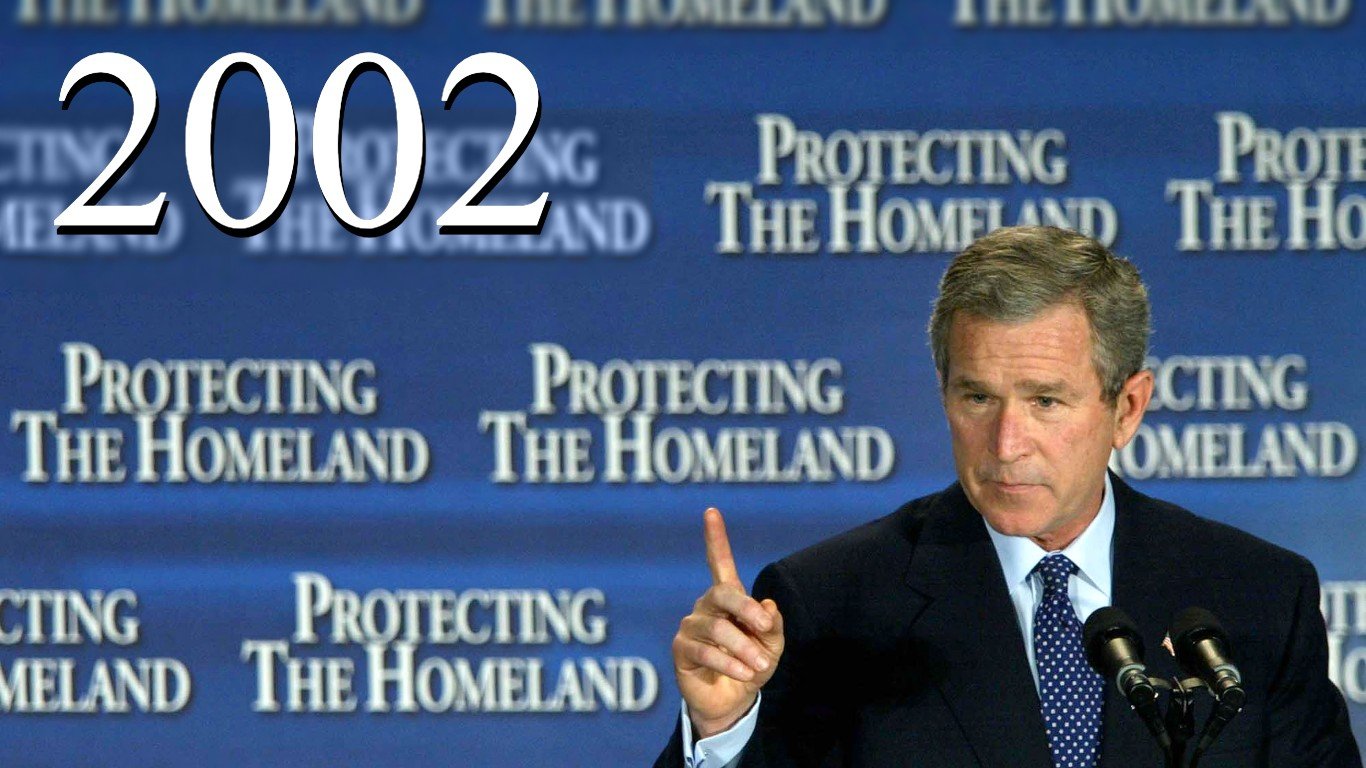
- Percent change in spending: 14.06% – #4 largest year-over-year increase
- Spending as a percent of GDP: 3.45%
2003: $ 440.53 billion
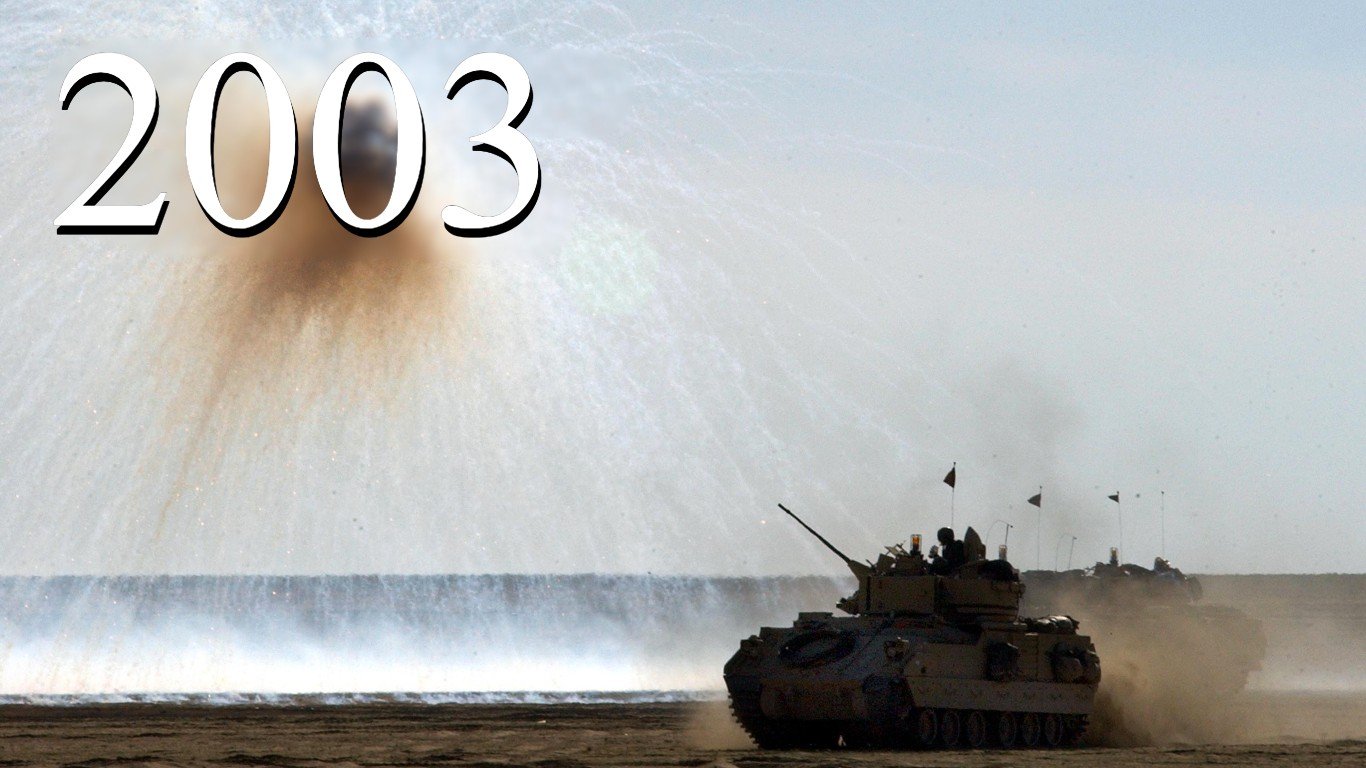
- Percent change in spending: 16.40% – #3 largest year-over-year increase
- Spending as a percent of GDP: 3.83%
2004: $ 493.00 billion
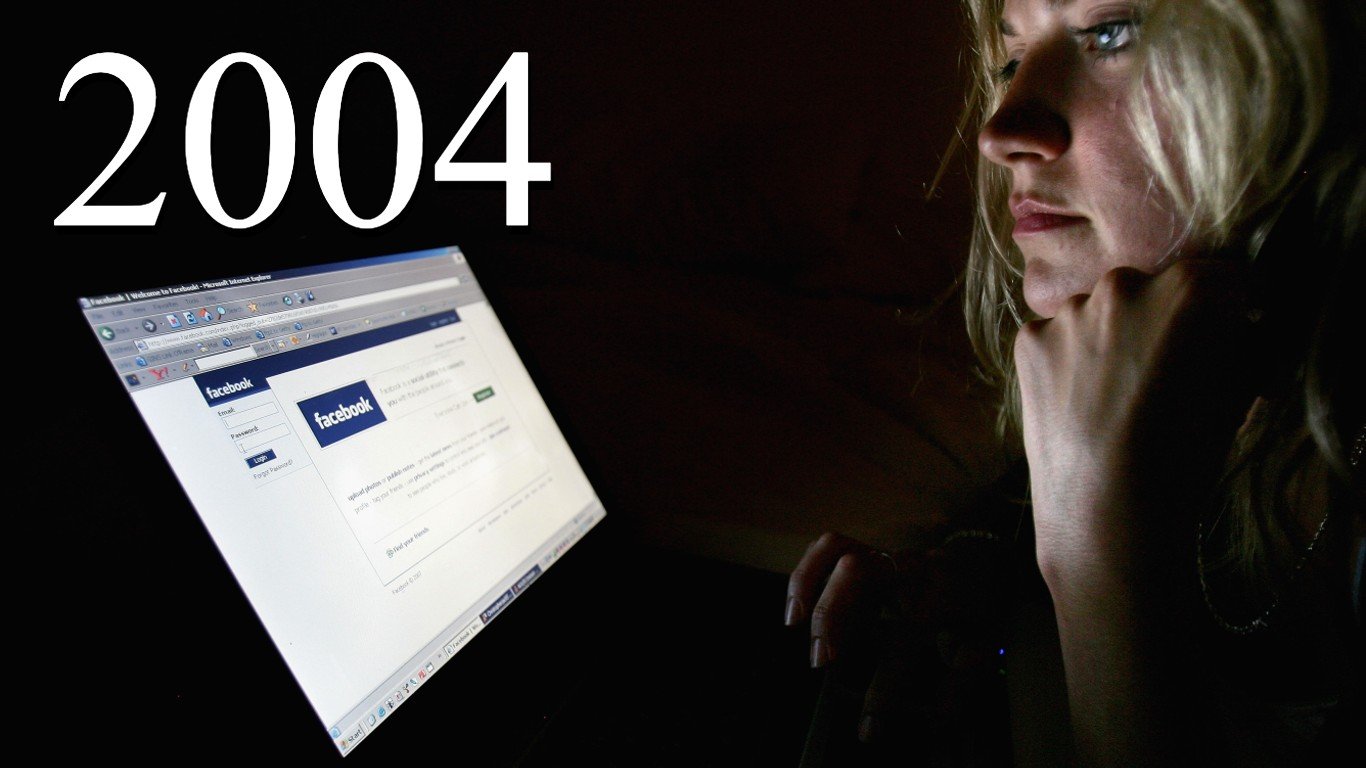
- Percent change in spending: 11.91% – #6 largest year-over-year increase
- Spending as a percent of GDP: 4.02%
2005: $ 533.20 billion
- Percent change in spending: 8.15% – #17 largest year-over-year increase
- Spending as a percent of GDP: 4.09%
2006: $ 558.34 billion
- Percent change in spending: 4.71% – #24 largest year-over-year increase
- Spending as a percent of GDP: 4.04%
2007: $ 589.59 billion
- Percent change in spending: 5.60% – #22 largest year-over-year increase
- Spending as a percent of GDP: 4.07%
2008: $ 656.76 billion
- Percent change in spending: 11.39% – #8 largest year-over-year increase
- Spending as a percent of GDP: 4.45%
2009: $ 705.92 billion
- Percent change in spending: 7.49% – #19 largest year-over-year increase
- Spending as a percent of GDP: 4.88%
2010: $ 738.01 billion
- Percent change in spending: 4.55% – #25 largest year-over-year increase
- Spending as a percent of GDP: 4.90%
2011: $ 752.29 billion

- Percent change in spending: 1.94% – #33 largest year-over-year increase
- Spending as a percent of GDP: 4.82%
2012: $ 725.21 billion
- Percent change in spending: -3.60% – #5 largest year over year decrease
- Spending as a percent of GDP: 4.46%
2013: $ 679.23 billion
- Percent change in spending: -6.34% – #2 largest year over year decrease
- Spending as a percent of GDP: 4.03%
2014: $ 647.79 billion
- Percent change in spending: -4.63% – #3 largest year over year decrease
- Spending as a percent of GDP: 3.69%
2015: $ 633.83 billion
- Percent change in spending: -2.15% – #9 largest year over year decrease
- Spending as a percent of GDP: 3.48%
2016: $ 639.86 billion
- Percent change in spending: 0.95% – #38 largest year-over-year increase
- Spending as a percent of GDP: 3.42%
2017: $ 646.75 billion
- Percent change in spending: 1.08% – #36 largest year-over-year increase
- Spending as a percent of GDP: 3.32%
2018: $ 682.49 billion

- Percent change in spending: 5.53% – #23 largest year-over-year increase
- Spending as a percent of GDP: 3.32%
2019: $ 734.34 billion
- Percent change in spending: 7.60% – #18 largest year-over-year increase
- Spending as a percent of GDP: 3.43%
2020: $ 778.40 billion
- Percent change in spending: 6.00% – #21 largest year-over-year increase
- Spending as a percent of GDP: 3.70%
2021: $ 806.23 billion
- Percent change in spending: 3.58% – #28 largest year-over-year increase
- Spending as a percent of GDP: 3.46%
2022: $ 876.94 billion
- Percent change in spending: 8.77% – #13 largest year-over-year increase
- Spending as a percent of GDP: 3.45%
Take This Retirement Quiz To Get Matched With An Advisor Now (Sponsored)
Are you ready for retirement? Planning for retirement can be overwhelming, that’s why it could be a good idea to speak to a fiduciary financial advisor about your goals today.
Start by taking this retirement quiz right here from SmartAsset that will match you with up to 3 financial advisors that serve your area and beyond in 5 minutes. Smart Asset is now matching over 50,000 people a month.
Click here now to get started.
The post This Is What’s Happened to US Military Spending in 50 Years appeared first on 24/7 Wall St..