Statistics on average global temperatures indicate that 2023 will go down as the hottest year ever recorded. According to data from the World Meteorological Organization, the eight years prior to 2023 were also the hottest on record. The alarming effects of long-term changes in weather patterns can be observed in the U.S. and across the globe.
The Biden administration took significant action to combat the climate crisis by signing the Inflation Reduction Act into law in 2022. This legislation allocates almost $370 billion to the effort and represents a pivotal step towards the administration’s objective of halving U.S. greenhouse emissions by 2030. Yet, it could be years before substantial results are seen, and America continues to release billions of metric tons of carbon dioxide into the atmosphere every year.
Referencing data provided by the U.S. Energy Information Administration, 24/7 Wall St. pinpointed some of the states accountable for the most significant increases in greenhouse gas emissions. The rankings of the listed states is based on the percentage change in total energy-related carbon dioxide emissions between 2020 and 2021, the most recent data available. These emissions originate from sources that include commercial, industrial, transportation, residential, and power generation. Data on carbon emissions per capita is also from the Energy Information Administration.
During the period from 2020 to 2021, the U.S. saw a 6.9% increase in energy-related carbon emissions, totaling almost 317 million metric tons. Most states saw increases in greenhouse gas emissions ranging from 1.4% to 16.2%, with Wyoming, Mississippi, and Virginia being the only states that experienced a decline in emissions.
The good news is that the recent nationwide rise in carbon emissions might have been an aberration. In 2020, the COVID-19 pandemic led to a reduction in America’s carbon footprint due to shelter-in-place policies diminishing energy demand and fossil fuel burning. However, in 2021, a spike in carbon emissions occurred as demand for consumer goods increased, coal usage rose amid escalating natural gas prices, and widespread vaccinations created a return to a more typical lifestyle for many people.
Further evidence supporting this claim can be found in the longer-term trends of greenhouse gas emissions in the United States. Between 2017 and 2021, carbon emissions decreased in all but eight states, with almost half of them seeing a reduction of 5% or more.
Why This Matters

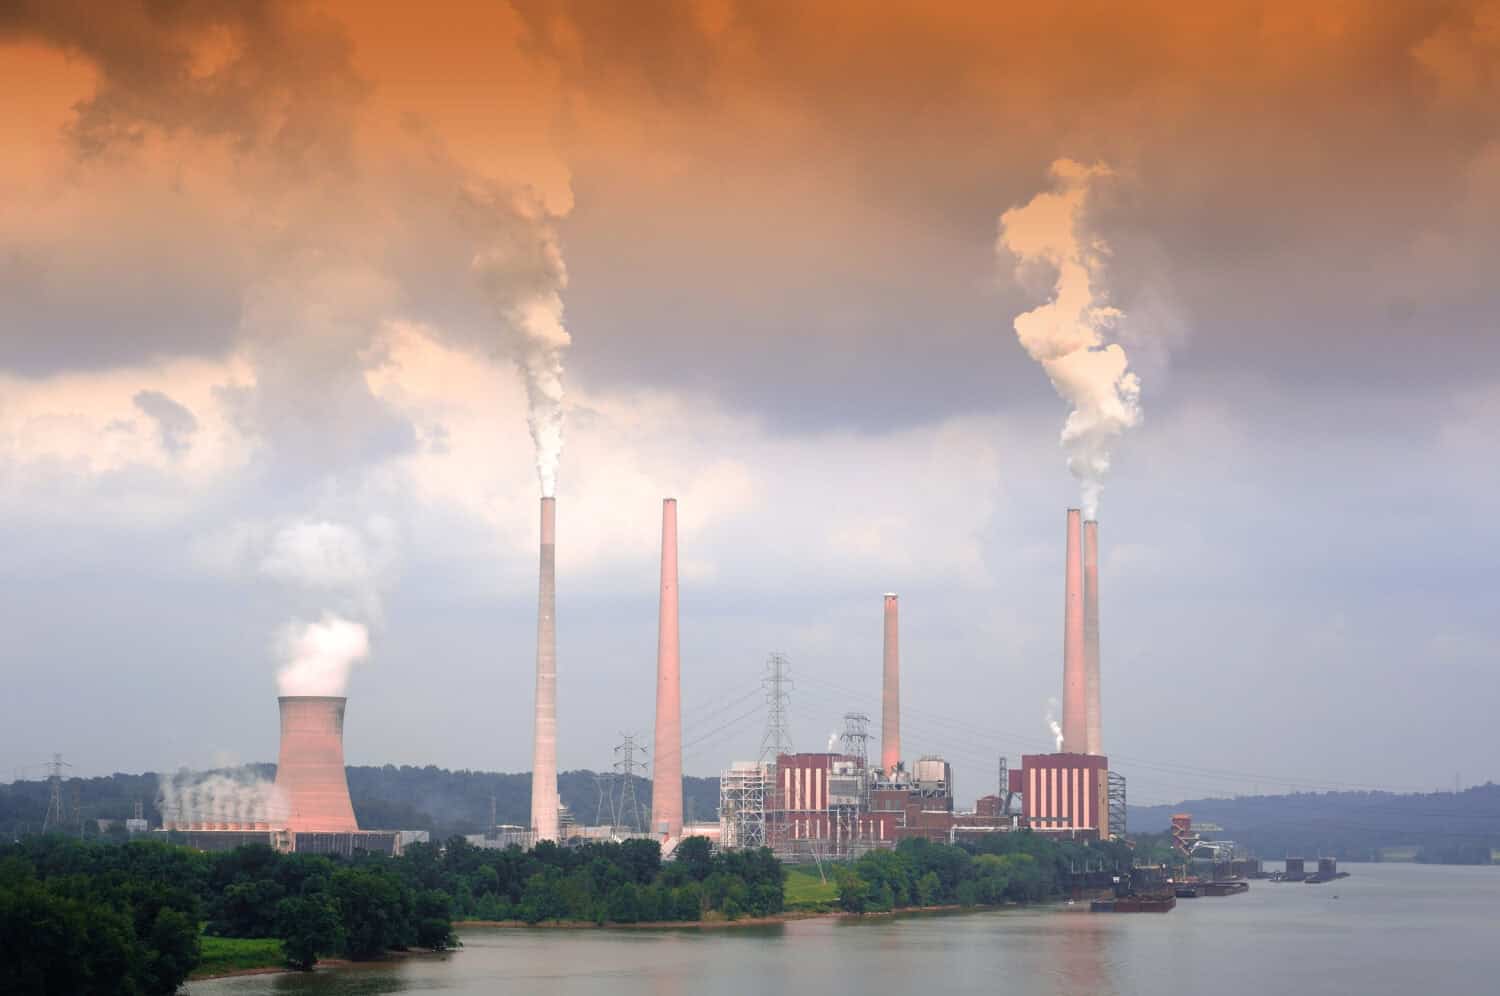
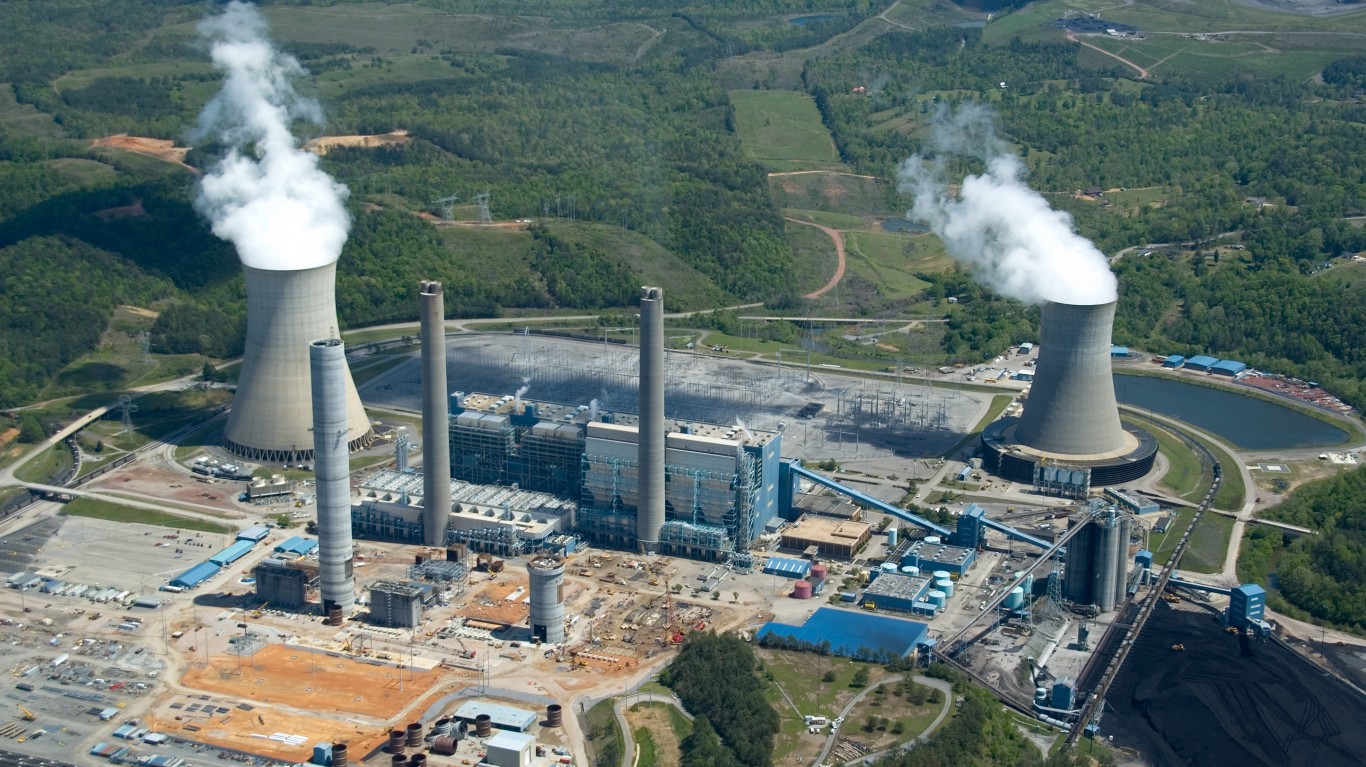
The US emits about 5 billion metric tons of carbon dioxide annually (as of 2021). This is more than twice what all 28 countries of the European Union do. Historically, the US has released the most CO2 of any country since 1850. Since carbon dioxide is a long-lived greenhouse gas that stays in the atmosphere for thousands of years, the US has to step up and accept responsibility for its part in global warming. As the detrimental economic effects of global warming cannot be stressed enough, we are writing this article to sensitize you to which states still have a problem, and which states are moving forward in combatting this problem.
These are states where carbon emissions are on the rise:
50. Wyoming
- Change in energy-related carbon dioxide emissions (2020 to 2021: -1.9% (-1.0 million metric tons)
- Change in energy-related carbon dioxide emissions (2017 to 2021): -13.1% (-8.2 million metric tons)
- Energy-related CO2 emissions in 2021: 94.3 metric tons per person – the highest (54.6 million metric tons total)
- Energy-related CO2 emissions in 2020: 96.2 metric tons per person – the highest (55.6 million metric tons total)
49. Virginia
- Change in energy-related carbon dioxide emissions (2020 to 2021: -0.2% (-222,446 metric tons)
- Change in energy-related carbon dioxide emissions (2017 to 2021): -7.2% (-7.6 million metric tons)
- Energy-related CO2 emissions in 2021: 11.3 metric tons per person – 16th lowest (98.0 million metric tons total)
- Energy-related CO2 emissions in 2020: 11.4 metric tons per person – 19th lowest (98.2 million metric tons total)
48. Mississippi
- Change in energy-related carbon dioxide emissions (2020 to 2021: -0.2% (-98,052 metric tons)
- Change in energy-related carbon dioxide emissions (2017 to 2021): +4.3% (+2.6 million metric tons)
- Energy-related CO2 emissions in 2021: 21.4 metric tons per person – 15th highest (63.1 million metric tons total)
- Energy-related CO2 emissions in 2020: 21.3 metric tons per person – 11th highest (63.2 million metric tons total)
47. South Dakota

- Change in energy-related carbon dioxide emissions (2020 to 2021: +1.4% (+204,640 metric tons)
- Change in energy-related carbon dioxide emissions (2017 to 2021): +3.4% (+500,422 metric tons)
- Energy-related CO2 emissions in 2021: 16.9 metric tons per person – 20th highest (15.2 million metric tons total)
- Energy-related CO2 emissions in 2020: 16.8 metric tons per person – 20th highest (15.0 million metric tons total)
46. New Mexico
- Change in energy-related carbon dioxide emissions (2020 to 2021: +1.5% (+675,752 metric tons)
- Change in energy-related carbon dioxide emissions (2017 to 2021): -7.5% (-3.7 million metric tons)
- Energy-related CO2 emissions in 2021: 21.7 metric tons per person – 13th highest (45.9 million metric tons total)
- Energy-related CO2 emissions in 2020: 21.3 metric tons per person – 12th highest (45.2 million metric tons total)
45. Nebraska
- Change in energy-related carbon dioxide emissions (2020 to 2021: +1.5% (+712,840 metric tons)
- Change in energy-related carbon dioxide emissions (2017 to 2021): -1.4% (-649,832 metric tons)
- Energy-related CO2 emissions in 2021: 24.0 metric tons per person – 9th highest (47.2 million metric tons total)
- Energy-related CO2 emissions in 2020: 23.7 metric tons per person – 7th highest (46.5 million metric tons total)
44. Oregon

- Change in energy-related carbon dioxide emissions (2020 to 2021: +2.7% (+1.0 million metric tons)
- Change in energy-related carbon dioxide emissions (2017 to 2021): -0.7% (-255,132 metric tons)
- Energy-related CO2 emissions in 2021: 9.1 metric tons per person – 6th lowest (38.5 million metric tons total)
- Energy-related CO2 emissions in 2020: 8.8 metric tons per person – 6th lowest (37.5 million metric tons total)
43. Vermont

- Change in energy-related carbon dioxide emissions (2020 to 2021: +2.8% (+149,613 metric tons)
- Change in energy-related carbon dioxide emissions (2017 to 2021): -4.4% (-258,736 metric tons)
- Energy-related CO2 emissions in 2021: 8.6 metric tons per person – 5th lowest (5.6 million metric tons total)
- Energy-related CO2 emissions in 2020: 8.4 metric tons per person – 5th lowest (5.4 million metric tons total)
42. Louisiana

- Change in energy-related carbon dioxide emissions (2020 to 2021: +2.9% (+5.3 million metric tons)
- Change in energy-related carbon dioxide emissions (2017 to 2021): -2.5% (-4.8 million metric tons)
- Energy-related CO2 emissions in 2021: 40.8 metric tons per person – 5th highest (188.6 million metric tons total)
- Energy-related CO2 emissions in 2020: 39.4 metric tons per person – 5th highest (183.3 million metric tons total)
41. Kansas
- Change in energy-related carbon dioxide emissions (2020 to 2021: +3.4% (+2.0 million metric tons)
- Change in energy-related carbon dioxide emissions (2017 to 2021): +1.2% (+725,806 metric tons)
- Energy-related CO2 emissions in 2021: 20.3 metric tons per person – 17th highest (59.8 million metric tons total)
- Energy-related CO2 emissions in 2020: 19.7 metric tons per person – 15th highest (57.8 million metric tons total)
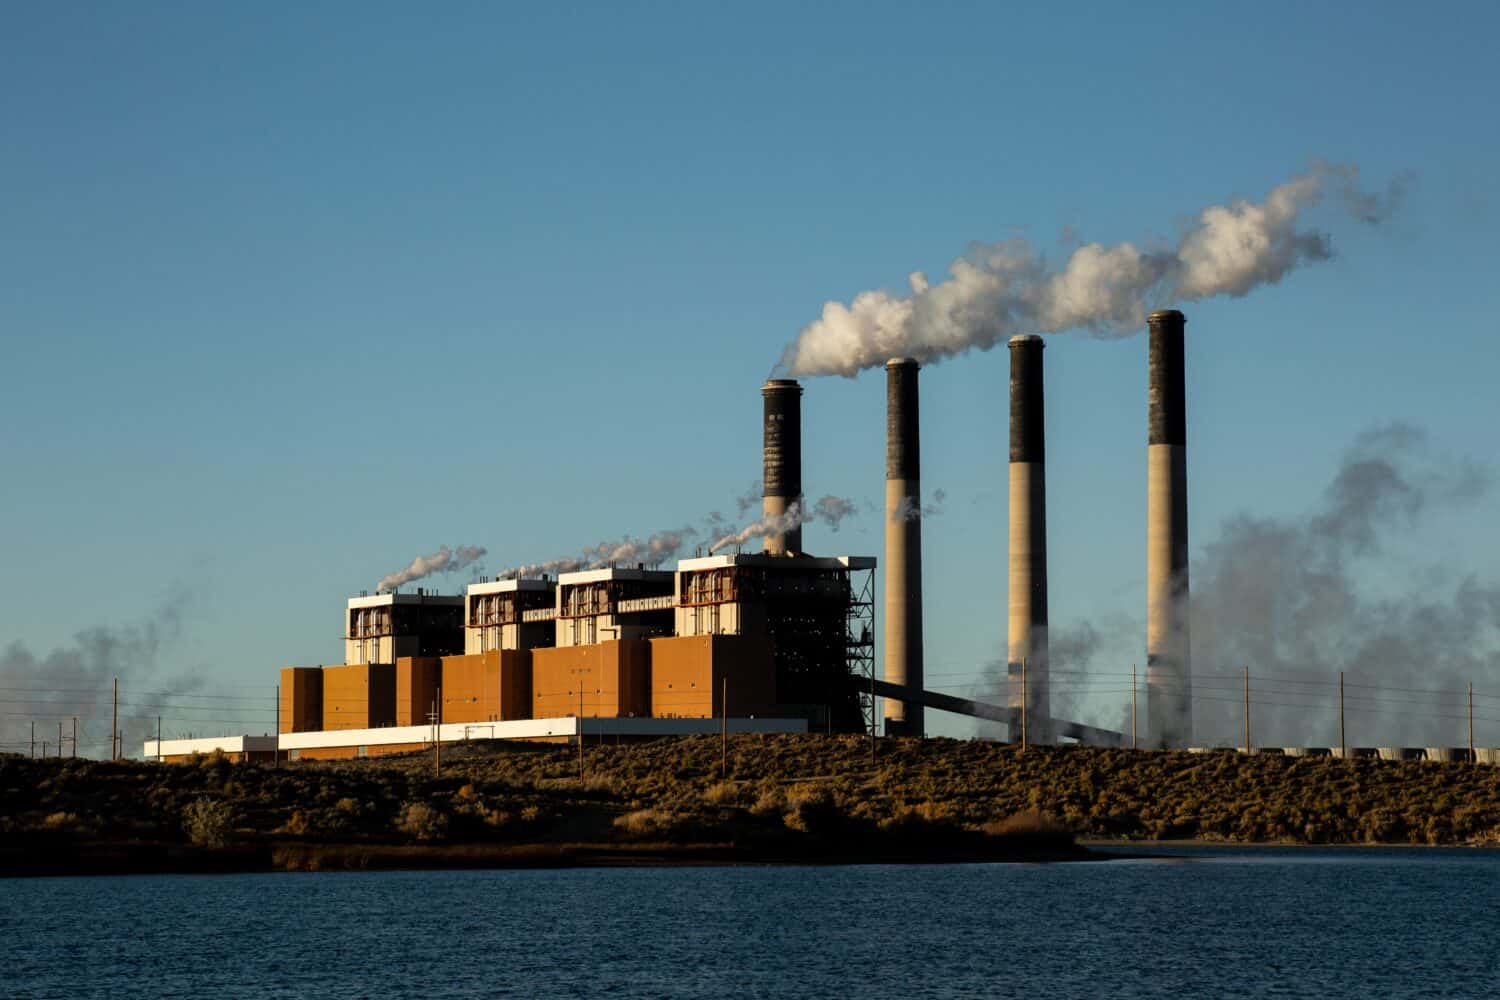
40. Arizona
- Change in energy-related carbon dioxide emissions (2020 to 2021: +3.6% (+2.9 million metric tons)
- Change in energy-related carbon dioxide emissions (2017 to 2021): -8.2% (-7.5 million metric tons)
- Energy-related CO2 emissions in 2021: 11.4 metric tons per person – 17th lowest (83.0 million metric tons total)
- Energy-related CO2 emissions in 2020: 11.2 metric tons per person – 18th lowest (80.2 million metric tons total)
39. ![]()

- Change in energy-related carbon dioxide emissions (2020 to 2021: +3.9% (+489,763 metric tons)
- Change in energy-related carbon dioxide emissions (2017 to 2021): -5.8% (-802,128 metric tons)
- Energy-related CO2 emissions in 2021: 12.9 metric tons per person – 21st lowest (13.0 million metric tons total)
- Energy-related CO2 emissions in 2020: 12.6 metric tons per person – 23rd lowest (12.5 million metric tons total)
38. Oklahoma

- Change in energy-related carbon dioxide emissions (2020 to 2021: +4.1% (+3.4 million metric tons)
- Change in energy-related carbon dioxide emissions (2017 to 2021): -6.0% (-5.7 million metric tons)
- Energy-related CO2 emissions in 2021: 22.0 metric tons per person – 12th highest (87.8 million metric tons total)
- Energy-related CO2 emissions in 2020: 21.3 metric tons per person – 13th highest (84.4 million metric tons total)
37. North Dakota
- Change in energy-related carbon dioxide emissions (2020 to 2021: +4.2% (+2.3 million metric tons)
- Change in energy-related carbon dioxide emissions (2017 to 2021): -0.7% (-382,006 metric tons)
- Energy-related CO2 emissions in 2021: 72.7 metric tons per person – 2nd highest (56.5 million metric tons total)
- Energy-related CO2 emissions in 2020: 69.6 metric tons per person – 2nd highest (54.3 million metric tons total)
36. Ohio
- Change in energy-related carbon dioxide emissions (2020 to 2021: +4.5% (+8.4 million metric tons)
- Change in energy-related carbon dioxide emissions (2017 to 2021): -5.4% (-11.0 million metric tons)
- Energy-related CO2 emissions in 2021: 16.5 metric tons per person – 21st highest (194.0 million metric tons total)
- Energy-related CO2 emissions in 2020: 15.7 metric tons per person – 21st highest (185.7 million metric tons total)
35. Idaho

- Change in energy-related carbon dioxide emissions (2020 to 2021: +6.0% (+1.2 million metric tons)
- Change in energy-related carbon dioxide emissions (2017 to 2021): +9.7% (+1.8 million metric tons)
- Energy-related CO2 emissions in 2021: 10.8 metric tons per person – 14th lowest (20.5 million metric tons total)
- Energy-related CO2 emissions in 2020: 10.5 metric tons per person – 16th lowest (19.4 million metric tons total)
34. Minnesota
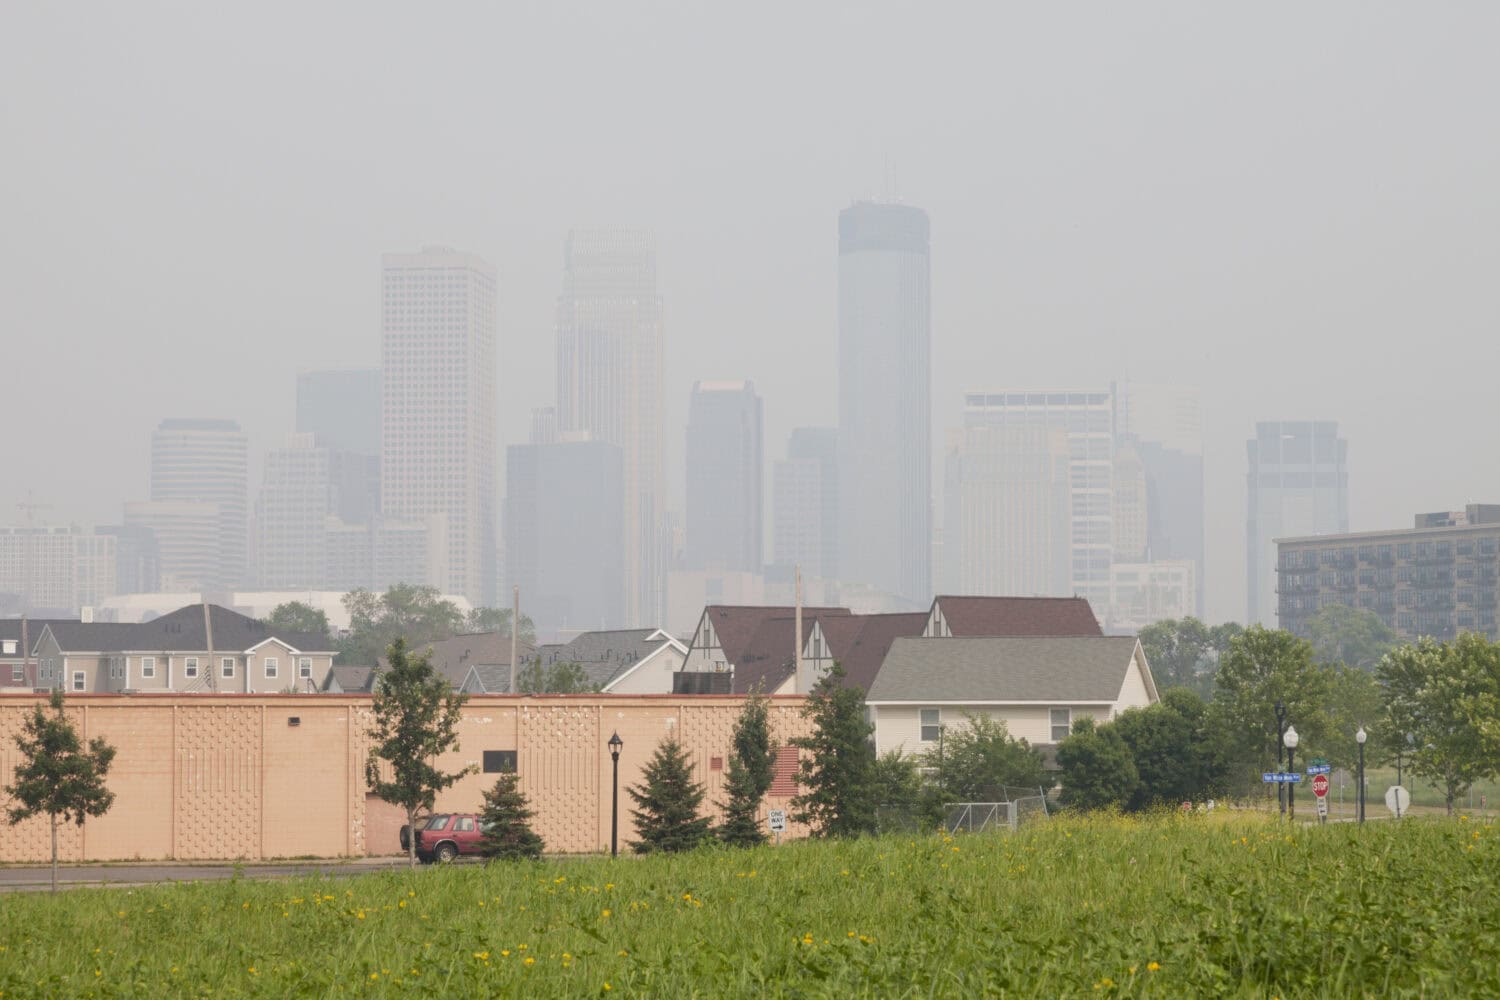
- Change in energy-related carbon dioxide emissions (2020 to 2021: +6.1% (+4.8 million metric tons)
- Change in energy-related carbon dioxide emissions (2017 to 2021): -8.9% (-8.1 million metric tons)
- Energy-related CO2 emissions in 2021: 14.6 metric tons per person – 25th lowest (83.2 million metric tons total)
- Energy-related CO2 emissions in 2020: 13.7 metric tons per person – 25th highest (78.4 million metric tons total)
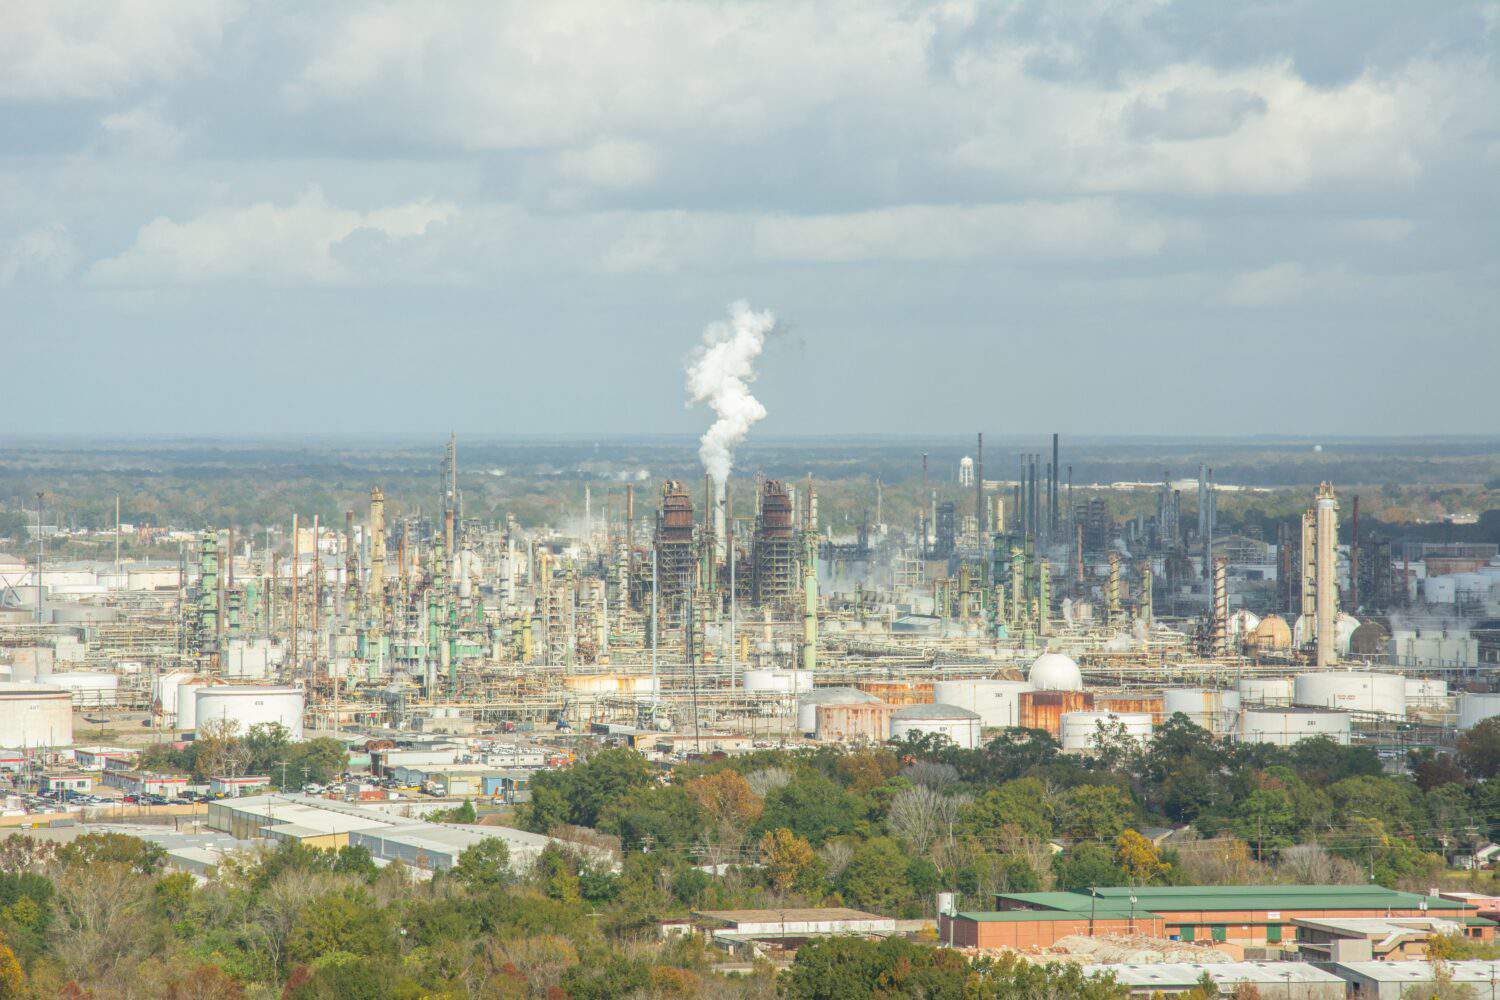
33.Texas![green trees in front of dirty petrochemical factory or oil refinery polluting carbon and pollution into the cloudy smog skies cuasing climate change and global warming and extreme weather events]()

- Change in energy-related carbon dioxide emissions (2020 to 2021: +6.2% (+38.8 million metric tons)
- Change in energy-related carbon dioxide emissions (2017 to 2021): -0.2% (-1.6 million metric tons)
- Energy-related CO2 emissions in 2021: 22.4 metric tons per person – 11th highest (663.5 million metric tons total)
- Energy-related CO2 emissions in 2020: 21.4 metric tons per person – 10th highest (624.7 million metric tons total)
32. Wisconsin
- Change in energy-related carbon dioxide emissions (2020 to 2021: +6.2% (+5.4 million metric tons)
- Change in energy-related carbon dioxide emissions (2017 to 2021): -6.3% (-6.2 million metric tons)
- Energy-related CO2 emissions in 2021: 15.7 metric tons per person – 23rd highest (92.5 million metric tons total)
- Energy-related CO2 emissions in 2020: 14.8 metric tons per person – 23rd highest (87.0 million metric tons total)
31. New Jersey

- Change in energy-related carbon dioxide emissions (2020 to 2021: +6.3% (+5.3 million metric tons)
- Change in energy-related carbon dioxide emissions (2017 to 2021): -10.3% (-10.2 million metric tons)
- Energy-related CO2 emissions in 2021: 9.6 metric tons per person – 9th lowest (89.1 million metric tons total)
- Energy-related CO2 emissions in 2020: 9.0 metric tons per person – 10th lowest (83.8 million metric tons total)
30. Georgia

- Change in energy-related carbon dioxide emissions (2020 to 2021: +6.5% (+7.5 million metric tons)
- Change in energy-related carbon dioxide emissions (2017 to 2021): -12.5% (-17.7 million metric tons)
- Energy-related CO2 emissions in 2021: 11.5 metric tons per person – 18th lowest (124.1 million metric tons total)
- Energy-related CO2 emissions in 2020: 10.9 metric tons per person – 17th lowest (116.6 million metric tons total)
29. California
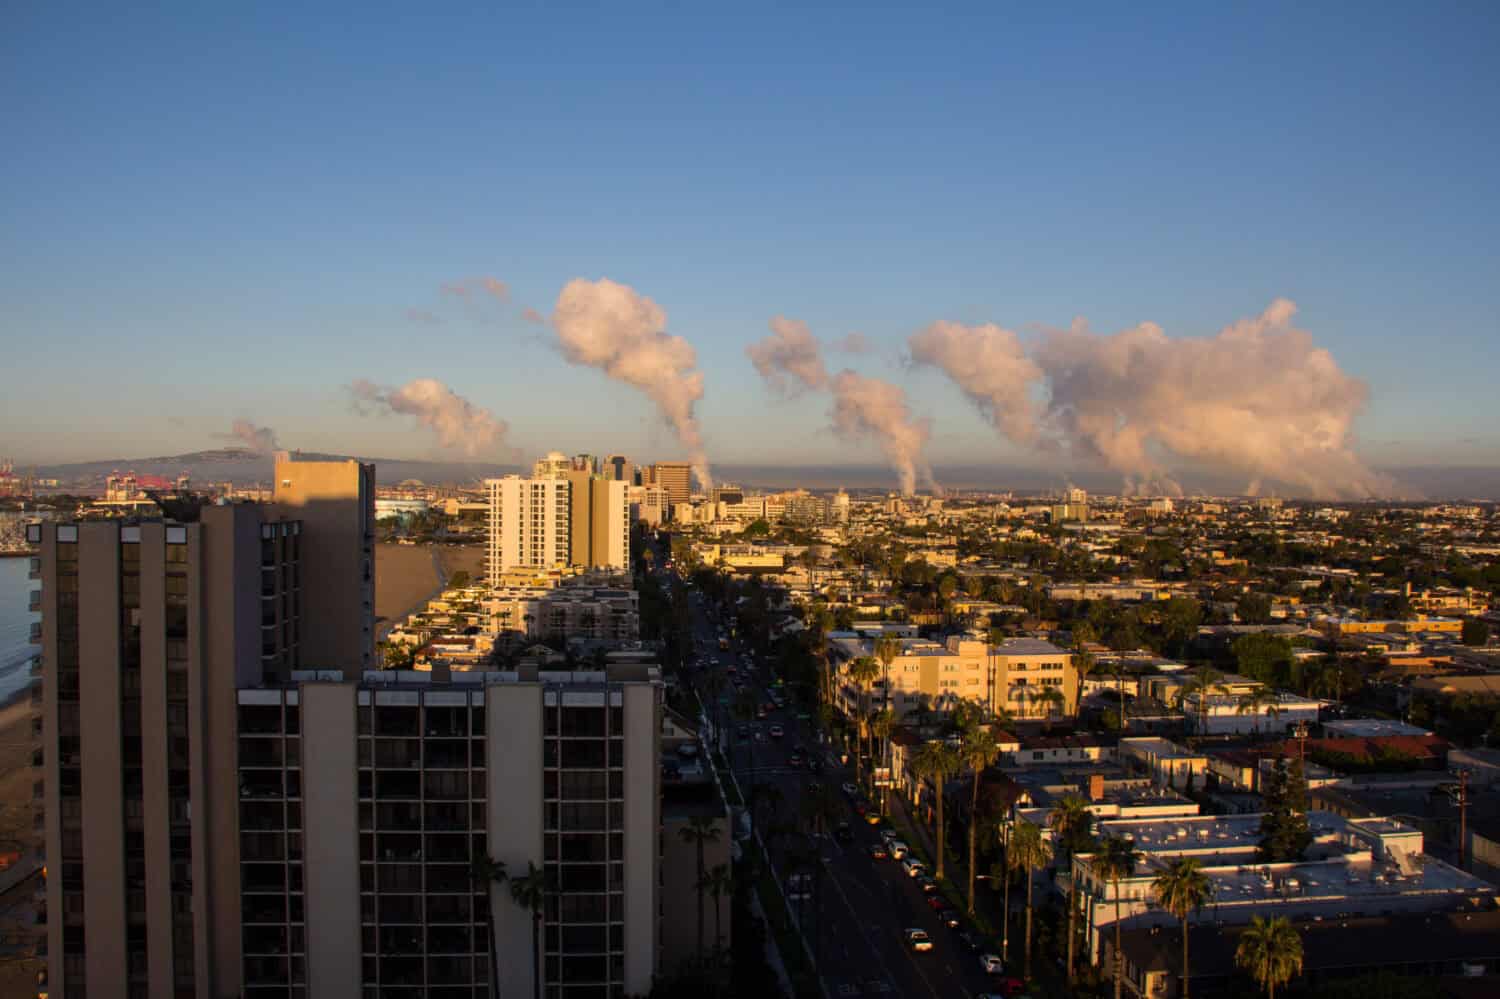
- Change in energy-related carbon dioxide emissions (2020 to 2021: +6.7% (+20.2 million metric tons)
- Change in energy-related carbon dioxide emissions (2017 to 2021): -9.1% (-32.5 million metric tons)
- Energy-related CO2 emissions in 2021: 8.3 metric tons per person – 3rd lowest (324.0 million metric tons total)
- Energy-related CO2 emissions in 2020: 7.7 metric tons per person – 3rd lowest (303.8 million metric tons total)
28. New Hampshire

- Change in energy-related carbon dioxide emissions (2020 to 2021: +6.7% (+831,385 metric tons)
- Change in energy-related carbon dioxide emissions (2017 to 2021): -1.6% (-222,708 metric tons)
- Energy-related CO2 emissions in 2021: 9.6 metric tons per person – 8th lowest (13.3 million metric tons total)
- Energy-related CO2 emissions in 2020: 9.0 metric tons per person – 9th lowest (12.5 million metric tons total)
27. Maine

- Change in energy-related carbon dioxide emissions (2020 to 2021: +6.7% (+904,274 metric tons)
- Change in energy-related carbon dioxide emissions (2017 to 2021): -6.3% (-969,048 metric tons)
- Energy-related CO2 emissions in 2021: 10.5 metric tons per person – 13th lowest (14.4 million metric tons total)
- Energy-related CO2 emissions in 2020: 9.9 metric tons per person – 13th lowest (13.5 million metric tons total)
26. Colorado

- Change in energy-related carbon dioxide emissions (2020 to 2021: +6.8% (+5.5 million metric tons)
- Change in energy-related carbon dioxide emissions (2017 to 2021): -3.8% (-3.4 million metric tons)
- Energy-related CO2 emissions in 2021: 14.7 metric tons per person – 25th highest (85.4 million metric tons total)
- Energy-related CO2 emissions in 2020: 13.8 metric tons per person – 24th highest (79.9 million metric tons total)
25. Massachusetts
- Change in energy-related carbon dioxide emissions (2020 to 2021: +7.3% (+3.8 million metric tons)
- Change in energy-related carbon dioxide emissions (2017 to 2021): -13.3% (-8.6 million metric tons)
- Energy-related CO2 emissions in 2021: 8.0 metric tons per person – 2nd lowest (56.1 million metric tons total)
- Energy-related CO2 emissions in 2020: 7.5 metric tons per person – 2nd lowest (52.3 million metric tons total)
24. Missouri

- Change in energy-related carbon dioxide emissions (2020 to 2021: +7.6% (+8.2 million metric tons)
- Change in energy-related carbon dioxide emissions (2017 to 2021): -6.1% (-7.6 million metric tons)
- Energy-related CO2 emissions in 2021: 19.0 metric tons per person – 18th highest (117.0 million metric tons total)
- Energy-related CO2 emissions in 2020: 17.7 metric tons per person – 18th highest (108.7 million metric tons total)
23. Indiana
- Change in energy-related carbon dioxide emissions (2020 to 2021: +7.7% (+11.9 million metric tons)
- Change in energy-related carbon dioxide emissions (2017 to 2021): -5.4% (-9.5 million metric tons)
- Energy-related CO2 emissions in 2021: 24.4 metric tons per person – 8th highest (166.4 million metric tons total)
- Energy-related CO2 emissions in 2020: 22.7 metric tons per person – 8th highest (154.4 million metric tons total)
22. Washington

- Change in energy-related carbon dioxide emissions (2020 to 2021: +7.9% (+5.4 million metric tons)
- Change in energy-related carbon dioxide emissions (2017 to 2021): -6.7% (-5.3 million metric tons)
- Energy-related CO2 emissions in 2021: 9.5 metric tons per person – 7th lowest (73.8 million metric tons total)
- Energy-related CO2 emissions in 2020: 8.9 metric tons per person – 7th lowest (68.4 million metric tons total)
21. Michigan
- Change in energy-related carbon dioxide emissions (2020 to 2021: +8.0% (+11.0 million metric tons)
- Change in energy-related carbon dioxide emissions (2017 to 2021): -5.0% (-7.9 million metric tons)
- Energy-related CO2 emissions in 2021: 14.7 metric tons per person – 24th highest (147.8 million metric tons total)
- Energy-related CO2 emissions in 2020: 13.6 metric tons per person – 25th lowest (136.9 million metric tons total)
20. Alaska
- Change in energy-related carbon dioxide emissions (2020 to 2021: +8.0% (+2.9 million metric tons)
- Change in energy-related carbon dioxide emissions (2017 to 2021): +15.2% (+5.1 million metric tons)
- Energy-related CO2 emissions in 2021: 53.0 metric tons per person – 3rd highest (38.9 million metric tons total)
- Energy-related CO2 emissions in 2020: 49.1 metric tons per person – 3rd highest (36.0 million metric tons total)
19. Utah

- Change in energy-related carbon dioxide emissions (2020 to 2021: +8.1% (+4.7 million metric tons)
- Change in energy-related carbon dioxide emissions (2017 to 2021): +5.1% (+3.0 million metric tons)
- Energy-related CO2 emissions in 2021: 18.6 metric tons per person – 19th highest (62.1 million metric tons total)
- Energy-related CO2 emissions in 2020: 17.5 metric tons per person – 19th highest (57.4 million metric tons total)
18. Illinois

- Change in energy-related carbon dioxide emissions (2020 to 2021: +8.3% (+14.1 million metric tons)
- Change in energy-related carbon dioxide emissions (2017 to 2021): -10.6% (-21.7 million metric tons)
- Energy-related CO2 emissions in 2021: 14.5 metric tons per person – 24th lowest (184.2 million metric tons total)
- Energy-related CO2 emissions in 2020: 13.3 metric tons per person – 24th lowest (170.2 million metric tons total)
17. Rhode Island

- Change in energy-related carbon dioxide emissions (2020 to 2021: +8.3% (+815,845 metric tons)
- Change in energy-related carbon dioxide emissions (2017 to 2021): +6.8% (+676,797 metric tons)
- Energy-related CO2 emissions in 2021: 9.7 metric tons per person – 10th lowest (10.6 million metric tons total)
- Energy-related CO2 emissions in 2020: 9.0 metric tons per person – 8th lowest (9.8 million metric tons total)
16. Connecticut
- Change in energy-related carbon dioxide emissions (2020 to 2021: +8.3% (+2.8 million metric tons)
- Change in energy-related carbon dioxide emissions (2017 to 2021): +8.0% (+2.7 million metric tons)
- Energy-related CO2 emissions in 2021: 10.1 metric tons per person – 11th lowest (36.6 million metric tons total)
- Energy-related CO2 emissions in 2020: 9.4 metric tons per person – 11th lowest (33.8 million metric tons total)
15. North Carolina

- Change in energy-related carbon dioxide emissions (2020 to 2021: +8.4% (+9.0 million metric tons)
- Change in energy-related carbon dioxide emissions (2017 to 2021): -4.6% (-5.6 million metric tons)
- Energy-related CO2 emissions in 2021: 10.9 metric tons per person – 15th lowest (115.6 million metric tons total)
- Energy-related CO2 emissions in 2020: 10.2 metric tons per person – 14th lowest (106.6 million metric tons total)
14. Montana
- Change in energy-related carbon dioxide emissions (2020 to 2021: +8.5% (+2.2 million metric tons)
- Change in energy-related carbon dioxide emissions (2017 to 2021): -8.7% (-2.7 million metric tons)
- Energy-related CO2 emissions in 2021: 25.8 metric tons per person – 6th highest (28.5 million metric tons total)
- Energy-related CO2 emissions in 2020: 24.2 metric tons per person – 6th highest (26.3 million metric tons total)
13. New York

- Change in energy-related carbon dioxide emissions (2020 to 2021: +8.8% (+12.6 million metric tons)
- Change in energy-related carbon dioxide emissions (2017 to 2021): -5.9% (-9.8 million metric tons)
- Energy-related CO2 emissions in 2021: 7.9 metric tons per person – the lowest (156.0 million metric tons total)
- Energy-related CO2 emissions in 2020: 7.1 metric tons per person – the lowest (143.4 million metric tons total)
12. Nevada
- Change in energy-related carbon dioxide emissions (2020 to 2021: +8.9% (+3.2 million metric tons)
- Change in energy-related carbon dioxide emissions (2017 to 2021): -1.9% (-782,687 metric tons)
- Energy-related CO2 emissions in 2021: 12.5 metric tons per person – 20th lowest (39.4 million metric tons total)
- Energy-related CO2 emissions in 2020: 11.6 metric tons per person – 20th lowest (36.2 million metric tons total)
11. Florida

- Change in energy-related carbon dioxide emissions (2020 to 2021: +9.0% (+18.6 million metric tons)
- Change in energy-related carbon dioxide emissions (2017 to 2021): -5.1% (-12.1 million metric tons)
- Energy-related CO2 emissions in 2021: 10.4 metric tons per person – 12th lowest (226.3 million metric tons total)
- Energy-related CO2 emissions in 2020: 9.6 metric tons per person – 12th lowest (207.7 million metric tons total)
10. South Carolina

- Change in energy-related carbon dioxide emissions (2020 to 2021: +9.1% (+5.8 million metric tons)
- Change in energy-related carbon dioxide emissions (2017 to 2021): -0.9% (-625,075 metric tons)
- Energy-related CO2 emissions in 2021: 13.4 metric tons per person – 23rd lowest (69.3 million metric tons total)
- Energy-related CO2 emissions in 2020: 12.4 metric tons per person – 22nd lowest (63.6 million metric tons total)
9. Maryland
- Change in energy-related carbon dioxide emissions (2020 to 2021: +9.3% (+4.5 million metric tons)
- Change in energy-related carbon dioxide emissions (2017 to 2021): -4.5% (-2.5 million metric tons)
- Energy-related CO2 emissions in 2021: 8.5 metric tons per person – 4th lowest (52.6 million metric tons total)
- Energy-related CO2 emissions in 2020: 7.8 metric tons per person – 4th lowest (48.1 million metric tons total)
8. Kentucky

- Change in energy-related carbon dioxide emissions (2020 to 2021: +10.0% (+10.1 million metric tons)
- Change in energy-related carbon dioxide emissions (2017 to 2021): -4.7% (-5.5 million metric tons)
- Energy-related CO2 emissions in 2021: 24.7 metric tons per person – 7th highest (111.3 million metric tons total)
- Energy-related CO2 emissions in 2020: 22.4 metric tons per person – 9th highest (101.2 million metric tons total)
7. Alabama
- Change in energy-related carbon dioxide emissions (2020 to 2021: +10.1% (+10.0 million metric tons)
- Change in energy-related carbon dioxide emissions (2017 to 2021): -0.2% (-202,453 metric tons)
- Energy-related CO2 emissions in 2021: 21.5 metric tons per person – 14th highest (108.4 million metric tons total)
- Energy-related CO2 emissions in 2020: 19.6 metric tons per person – 16th highest (98.4 million metric tons total)
6. Pennsylvania

- Change in energy-related carbon dioxide emissions (2020 to 2021: +10.5% (+20.2 million metric tons)
- Change in energy-related carbon dioxide emissions (2017 to 2021): -0.8% (-1.8 million metric tons)
- Energy-related CO2 emissions in 2021: 16.4 metric tons per person – 22nd highest (213.5 million metric tons total)
- Energy-related CO2 emissions in 2020: 14.9 metric tons per person – 22nd highest (193.3 million metric tons total)
5. Tennessee

- Change in energy-related carbon dioxide emissions (2020 to 2021: +11.2% (+9.4 million metric tons)
- Change in energy-related carbon dioxide emissions (2017 to 2021): -4.9% (-4.7 million metric tons)
- Energy-related CO2 emissions in 2021: 13.3 metric tons per person – 22nd lowest (92.7 million metric tons total)
- Energy-related CO2 emissions in 2020: 12.0 metric tons per person – 21st lowest (83.3 million metric tons total)
4. Iowa
- Change in energy-related carbon dioxide emissions (2020 to 2021: +11.4% (+7.5 million metric tons)
- Change in energy-related carbon dioxide emissions (2017 to 2021): -4.1% (-3.2 million metric tons)
- Energy-related CO2 emissions in 2021: 22.9 metric tons per person – 10th highest (73.1 million metric tons total)
- Energy-related CO2 emissions in 2020: 20.6 metric tons per person – 14th highest (65.7 million metric tons total)
3. Arkansas
- Change in energy-related carbon dioxide emissions (2020 to 2021: +13.3% (+7.3 million metric tons)
- Change in energy-related carbon dioxide emissions (2017 to 2021): -3.4% (-2.2 million metric tons)
- Energy-related CO2 emissions in 2021: 20.5 metric tons per person – 16th highest (62.0 million metric tons total)
- Energy-related CO2 emissions in 2020: 18.2 metric tons per person – 17th highest (54.7 million metric tons total)
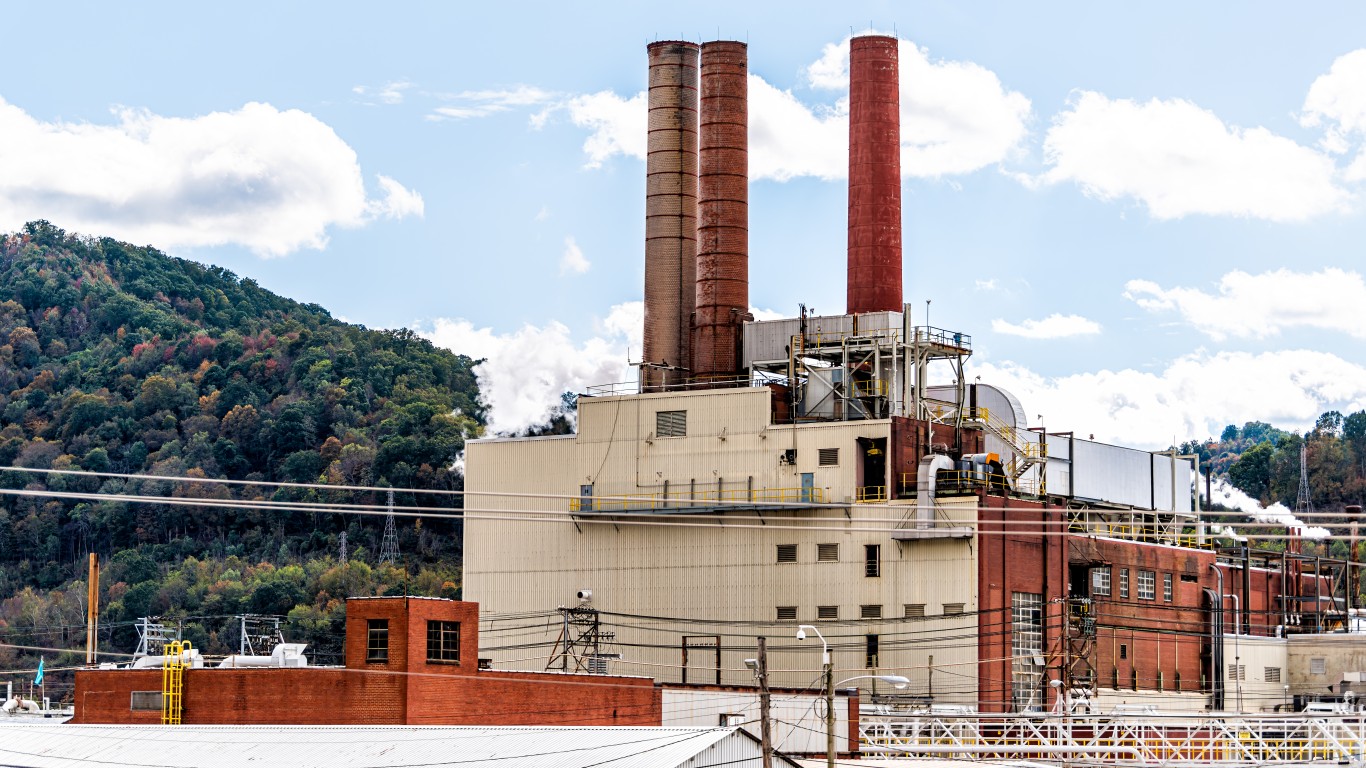
2. West Virginia
- Change in energy-related carbon dioxide emissions (2020 to 2021: +14.9% (+11.5 million metric tons)
- Change in energy-related carbon dioxide emissions (2017 to 2021): -2.7% (-2.4 million metric tons)
- Energy-related CO2 emissions in 2021: 49.5 metric tons per person – 4th highest (88.4 million metric tons total)
- Energy-related CO2 emissions in 2020: 43.0 metric tons per person – 4th highest (76.9 million metric tons total)
1. Hawaii

- Change in energy-related carbon dioxide emissions (2020 to 2021: +16.2% (+2.4 million metric tons)
- Change in energy-related carbon dioxide emissions (2017 to 2021): -15.1% (-3.1 million metric tons)
- Energy-related carbon dioxide emissions in 2021: 12.0 metric tons per person – 19th lowest (17.3 million metric tons total)
- Energy-related carbon dioxide emissions in 2020: 10.3 metric tons per person – 15th lowest (14.9 million metric tons total)
Smart Investors Are Quietly Loading Up on These “Dividend Legends” (Sponsored)
If you want your portfolio to pay you cash like clockwork, it’s time to stop blindly following conventional wisdom like relying on Dividend Aristocrats. There’s a better option, and we want to show you. We’re offering a brand-new report on 2 stocks we believe offer the rare combination of a high dividend yield and significant stock appreciation upside. If you’re tired of feeling one step behind in this market, this free report is a must-read for you.
Click here to download your FREE copy of “2 Dividend Legends to Hold Forever” and start improving your portfolio today.
The post The State Where CO2 Pollution is Skyrocketing: Every State Ranked appeared first on 24/7 Wall St..