24/7 Wall St. Insights
- A stunning nine of the best 40 counties across the U.S. are located in a single US state– do you live in one of them?
- One county on this list, has an average life expectancy of 112.5 years, which is nearly three decades higher than the American average life expectancy.
- The best counties are usually decided by a holistic measure similar to the Human Development Index which looks at education, financial stability, and life expectancy.
- Also: 2 Dividend Legends to Hold Forever
Earlier in 2024, a U.S. News Healthiest Communities analysis found Nassau County, New York to be the safest county across the entire nation. Nassau County, which is located in Long Island, comprises multiple cities including Great Neck, Hempstead, Syosset, and East Meadow (among others). Its ranking of safest county was determined by a perfect 100/100 safety score; the county was also found to spend a solid amount on emergency and healthcare services. While Nassau County may now hold a reputation as the safest place to be in America, safety isn’t the only thing that goes into deciding the best places to live. Other factors that people should consider when looking to relocate include environmental qualities, access to quality education, recreation, community, and poverty levels. Choosing the best county to live in can actually positively affect your health and quality of life. (Nassau County might be safe, but here are the most dangerous cities in the world.)
Despite the U.S. having high levels of wealth and a strong economy, the U.S. also lags behind many other countries with similar democratic, free market values. For example, life expectancy at birth has fallen for two consecutive years in the U.S., according to the Organization for Economic Cooperation and Development. At just 76 years as of 2021, life expectancy in the U.S. is the seventh lowest among the 38 OECD member states.
The Human Development Index is another, more holistic measure of wellbeing that shows the U.S. falls behind many of its global peers. The HDI, created by the United Nations Development Programme, is made up of three components: educational attainment, financial stability, and life expectancy, and is designed to capture a country’s development potential and overall quality of life. According to the latest HDI report, the U.S. ranks behind 19 other countries, including Australia, Belgium, Canada, Ireland, the United Arab Emirates, and the United Kingdom. However, when applied to geographies within the U.S., the HDI reveals that in many parts of the country, quality of life is on par with some of the highest ranking nations in the U.N.’s report.
Using an index inspired by the HDI, 24/7 Wall St. identified the 40 best U.S. counties across the U.S. to live in. Counties and county equivalents, including independent cities, are ranked on a combination of three measures — average life expectancy at birth, the share of adults with a bachelor’s degree or higher, and poverty rate. Data used to calculate rankings are from the U.S. Census Bureau’s 2022 American Community Survey and County Health Rankings & Roadmaps, a joint program of the Robert Wood Johnson Foundation and the University of Wisconsin Population Health Institute. All ACS data are five-year averages, and this is the most up-to-date data at this time. Counties with incomplete data were excluded from analysis. To avoid geographic clustering, we only included one county per metropolitan statistical area.
The 40 counties and county equivalents on this list are spread across the country, including five in the Northeast, six in the Midwest, 11 in the South, and 18 in the West. In each of these 40 counties, average life expectancy at birth exceeds the national average by at least two years, according to data from County Health Rankings & Roadmaps. Most of these places also have poverty rates that are at least 4 percentage points below the 12.5% U.S. poverty rate, and in all but six of these counties, over half of all adults have a bachelor’s degree or higher, compared to only about one-third of all adults nationwide. (Unlike these counties below, this is the poorest city in ever U.S. state.)
Most of these places also have relatively high-earning populations. Even though income was not considered in the ranking, in every county but one on this list, the typical household earns more than the national median household income of $75,149 — in most cases, by tens of thousands of dollars. Though there isn’t a direct correlation between safety and positive HDI scores, the best counties to live in are often more financially stable and can invest in safety measures in infrastructures. That being said, while Nassau County might be safe, it did not land a spot on this list.
These are the 40 best U.S. counties to live in:
Why We Felt This Was Important to Share

Choosing somewhere to live can be challenging. There are so many factors that go into living your best life. But you need more than just a nice neighborhood to thrive. By looking at the best counties to live in America, you can see what really goes into improving quality of life. If you’re getting ready to move, or thinking about the idea in the future, understanding what counties are ranking high in health, finances, and education can help you choose the best place for your needs.
40. Kendall County, Texas

- Avg. life expectancy at birth: 81.5 years (2.9 years above U.S. avg.)
- Poverty rate: 5.1% (7.4 ppt. below U.S. avg.)
- Adults with a bachelor’s degree: 48.5% (14.2 ppt. above U.S. avg.)
- Median household income: $104,196 ($29,047 more than U.S. median)
- Population: 45,376
- County seat: Boerne
39. Newport County, Rhode Island

- Avg. life expectancy at birth: 82.0 years (3.5 years above U.S. avg.)
- Poverty rate: 7.8% (4.8 ppt. below U.S. avg.)
- Adults with a bachelor’s degree: 52.1% (17.8 ppt. above U.S. avg.)
- Median household income: $96,319 ($21,170 more than U.S. median)
- Population: 85,442
- County seat: Newport
38. Routt County, Colorado
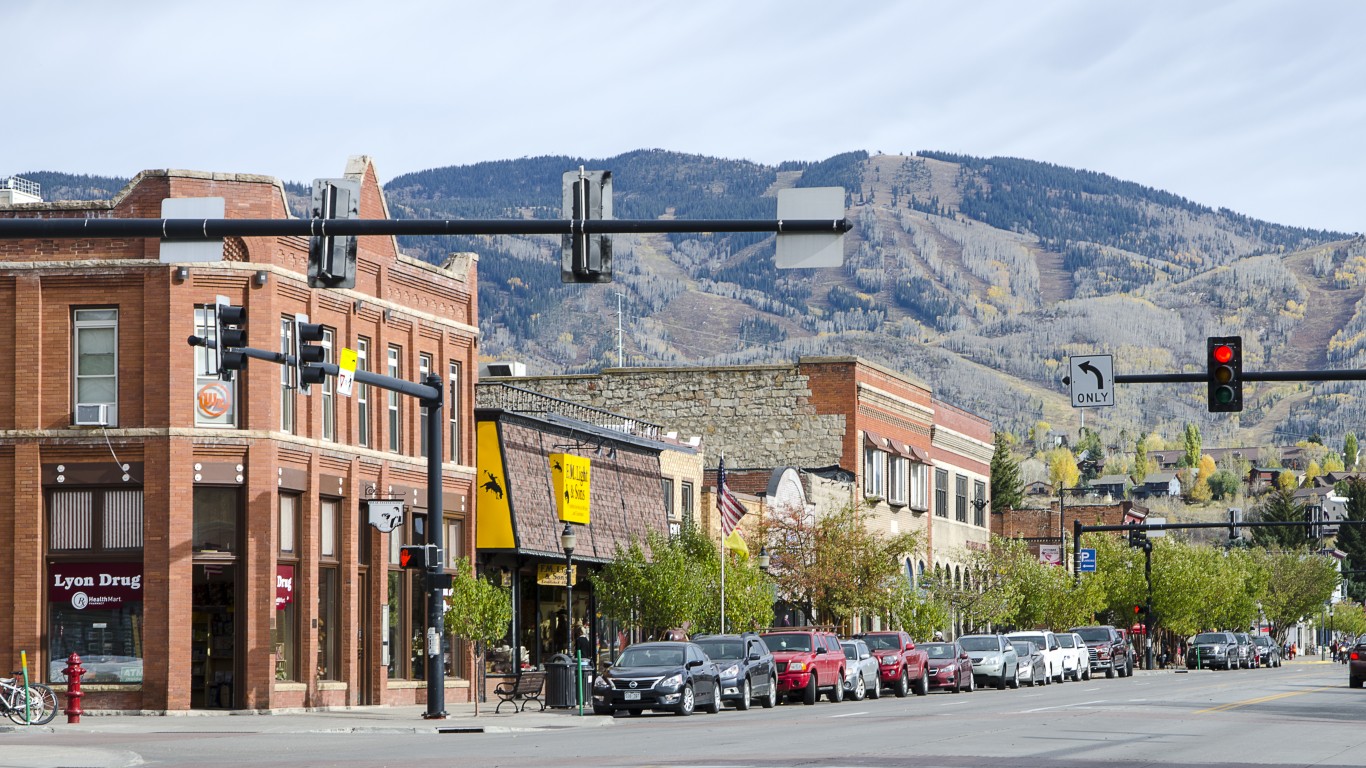
- Avg. life expectancy at birth: 84.1 years (5.6 years above U.S. avg.)
- Poverty rate: 8.0% (4.6 ppt. below U.S. avg.)
- Adults with a bachelor’s degree: 50.0% (15.7 ppt. above U.S. avg.)
- Median household income: $95,144 ($19,995 more than U.S. median)
- Population: 24,944
- County seat: Steamboat Springs
37. York County, Virginia

- Avg. life expectancy at birth: 81.5 years (3.0 years above U.S. avg.)
- Poverty rate: 4.7% (7.8 ppt. below U.S. avg.)
- Adults with a bachelor’s degree: 49.5% (15.2 ppt. above U.S. avg.)
- Median household income: $105,154 ($30,005 more than U.S. median)
- Population: 70,238
- County seat: Yorktown
36. DuPage County, Illinois

- Avg. life expectancy at birth: 81.9 years (3.4 years above U.S. avg.)
- Poverty rate: 6.3% (6.3 ppt. below U.S. avg.)
- Adults with a bachelor’s degree: 51.1% (16.8 ppt. above U.S. avg.)
- Median household income: $107,035 ($31,886 more than U.S. median)
- Population: 930,559
- County seat: Wheaton
35. Dallas County, Iowa
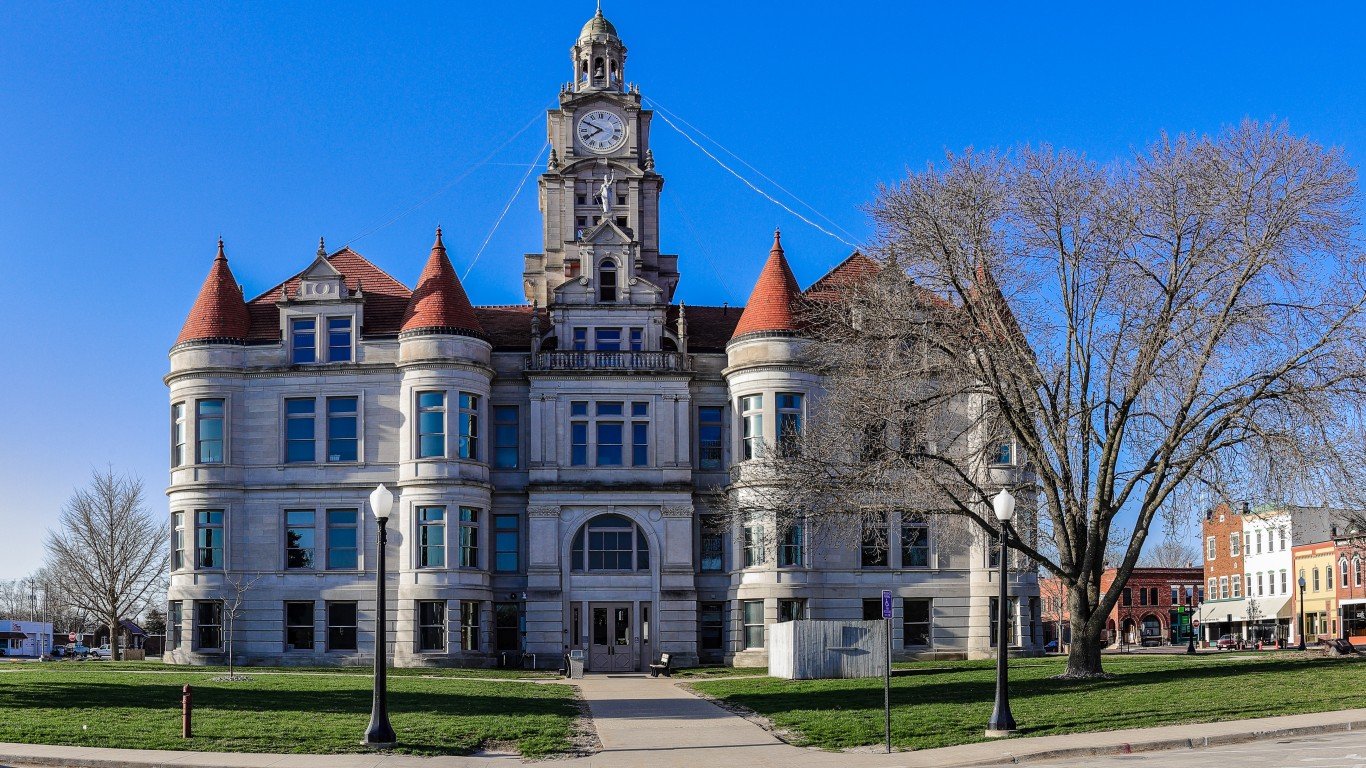
- Avg. life expectancy at birth: 81.8 years (3.2 years above U.S. avg.)
- Poverty rate: 5.7% (6.9 ppt. below U.S. avg.)
- Adults with a bachelor’s degree: 51.5% (17.2 ppt. above U.S. avg.)
- Median household income: $99,533 ($24,384 more than U.S. median)
- Population: 100,367
- County seat: Adel
34. Aleutians East Borough, Alaska

- Avg. life expectancy at birth: 112.5 years (34.0 years above U.S. avg.)
- Poverty rate: 12.6% (0.1 ppt. above U.S. avg.)
- Adults with a bachelor’s degree: 16.9% (17.4 ppt. below U.S. avg.)
- Median household income: $79,961 ($4,812 more than U.S. median)
- Population: 3,407
- Borough seat: Sand Point
33. King County, Washington

- Avg. life expectancy at birth: 82.3 years (3.8 years above U.S. avg.)
- Poverty rate: 8.4% (4.1 ppt. below U.S. avg.)
- Adults with a bachelor’s degree: 54.8% (20.5 ppt. above U.S. avg.)
- Median household income: $116,340 ($41,191 more than U.S. median)
- Population: 2,254,371
- County seat: Seattle
32. San Juan County, Washington

- Avg. life expectancy at birth: 86.3 years (7.7 years above U.S. avg.)
- Poverty rate: 11.0% (1.5 ppt. below U.S. avg.)
- Adults with a bachelor’s degree: 52.6% (18.3 ppt. above U.S. avg.)
- Median household income: $76,745 ($1,596 more than U.S. median)
- Population: 18,001
- County seat: Friday Harbor
31. Wake County, North Carolina

- Avg. life expectancy at birth: 81.6 years (3.1 years above U.S. avg.)
- Poverty rate: 8.2% (4.3 ppt. below U.S. avg.)
- Adults with a bachelor’s degree: 55.7% (21.3 ppt. above U.S. avg.)
- Median household income: $96,734 ($21,585 more than U.S. median)
- Population: 1,132,103
- County seat: Raleigh
30. Orange County, North Carolina

- Avg. life expectancy at birth: 82.1 years (3.6 years above U.S. avg.)
- Poverty rate: 12.3% (0.3 ppt. below U.S. avg.)
- Adults with a bachelor’s degree: 61.7% (27.4 ppt. above U.S. avg.)
- Median household income: $85,785 ($10,636 more than U.S. median)
- Population: 145,919
- County seat: Hillsborough
29. Oconee County, Georgia

- Avg. life expectancy at birth: 80.6 years (2.0 years above U.S. avg.)
- Poverty rate: 4.5% (8.1 ppt. below U.S. avg.)
- Adults with a bachelor’s degree: 53.5% (19.1 ppt. above U.S. avg.)
- Median household income: $116,221 ($41,072 more than U.S. median)
- Population: 41,978
- County seat: Watkinsville
28. Collin County, Texas

- Avg. life expectancy at birth: 82.2 years (3.7 years above U.S. avg.)
- Poverty rate: 6.3% (6.2 ppt. below U.S. avg.)
- Adults with a bachelor’s degree: 54.3% (20.0 ppt. above U.S. avg.)
- Median household income: $113,255 ($38,106 more than U.S. median)
- Population: 1,079,153
- County seat: McKinney
27. Carver County, Minnesota

- Avg. life expectancy at birth: 83.2 years (4.6 years above U.S. avg.)
- Poverty rate: 3.8% (8.8 ppt. below U.S. avg.)
- Adults with a bachelor’s degree: 49.8% (15.5 ppt. above U.S. avg.)
- Median household income: $116,308 ($41,159 more than U.S. median)
- Population: 107,216
- County seat: Chaska
26. Chester County, Pennsylvania

- Avg. life expectancy at birth: 81.2 years (2.7 years above U.S. avg.)
- Poverty rate: 6.0% (6.6 ppt. below U.S. avg.)
- Adults with a bachelor’s degree: 56.1% (21.8 ppt. above U.S. avg.)
- Median household income: $118,574 ($43,425 more than U.S. median)
- Population: 536,474
- County seat: West Chester
25. Mono County, California

- Avg. life expectancy at birth: 103.3 years (24.8 years above U.S. avg.)
- Poverty rate: 11.3% (1.2 ppt. below U.S. avg.)
- Adults with a bachelor’s degree: 31.7% (2.6 ppt. below U.S. avg.)
- Median household income: $82,038 ($6,889 more than U.S. median)
- Population: 13,219
- County seat: Bridgeport
24. Gunnison County, Colorado

- Avg. life expectancy at birth: 83.9 years (5.4 years above U.S. avg.)
- Poverty rate: 10.8% (1.7 ppt. below U.S. avg.)
- Adults with a bachelor’s degree: 59.3% (25.0 ppt. above U.S. avg.)
- Median household income: $76,538 ($1,389 more than U.S. median)
- Population: 17,018
- County seat: Gunnison
23. Middlesex County, Massachusetts

- Avg. life expectancy at birth: 81.9 years (3.4 years above U.S. avg.)
- Poverty rate: 7.4% (5.1 ppt. below U.S. avg.)
- Adults with a bachelor’s degree: 58.5% (24.2 ppt. above U.S. avg.)
- Median household income: $121,304 ($46,155 more than U.S. median)
- Population: 1,623,109
- County seat: Cambridge
22. Ouray County, Colorado

- Avg. life expectancy at birth: 85.7 years (7.2 years above U.S. avg.)
- Poverty rate: 4.8% (7.7 ppt. below U.S. avg.)
- Adults with a bachelor’s degree: 49.6% (15.2 ppt. above U.S. avg.)
- Median household income: $78,750 ($3,601 more than U.S. median)
- Population: 4,936
- County seat: Ouray
21. Johnson County, Kansas

- Avg. life expectancy at birth: 81.4 years (2.9 years above U.S. avg.)
- Poverty rate: 5.3% (7.3 ppt. below U.S. avg.)
- Adults with a bachelor’s degree: 56.7% (22.4 ppt. above U.S. avg.)
- Median household income: $103,644 ($28,495 more than U.S. median)
- Population: 610,742
- County seat: Olathe
20. Boulder County, Colorado

- Avg. life expectancy at birth: 82.6 years (4.1 years above U.S. avg.)
- Poverty rate: 11.3% (1.3 ppt. below U.S. avg.)
- Adults with a bachelor’s degree: 63.2% (28.9 ppt. above U.S. avg.)
- Median household income: $99,770 ($24,621 more than U.S. median)
- Population: 328,658
- County seat: Boulder
19. Santa Clara County, California

- Avg. life expectancy at birth: 84.7 years (6.1 years above U.S. avg.)
- Poverty rate: 6.9% (5.7 ppt. below U.S. avg.)
- Adults with a bachelor’s degree: 55.3% (21.0 ppt. above U.S. avg.)
- Median household income: $153,792 ($78,643 more than U.S. median)
- Population: 1,916,831
- County seat: San Jose
18. Forsyth County, Georgia
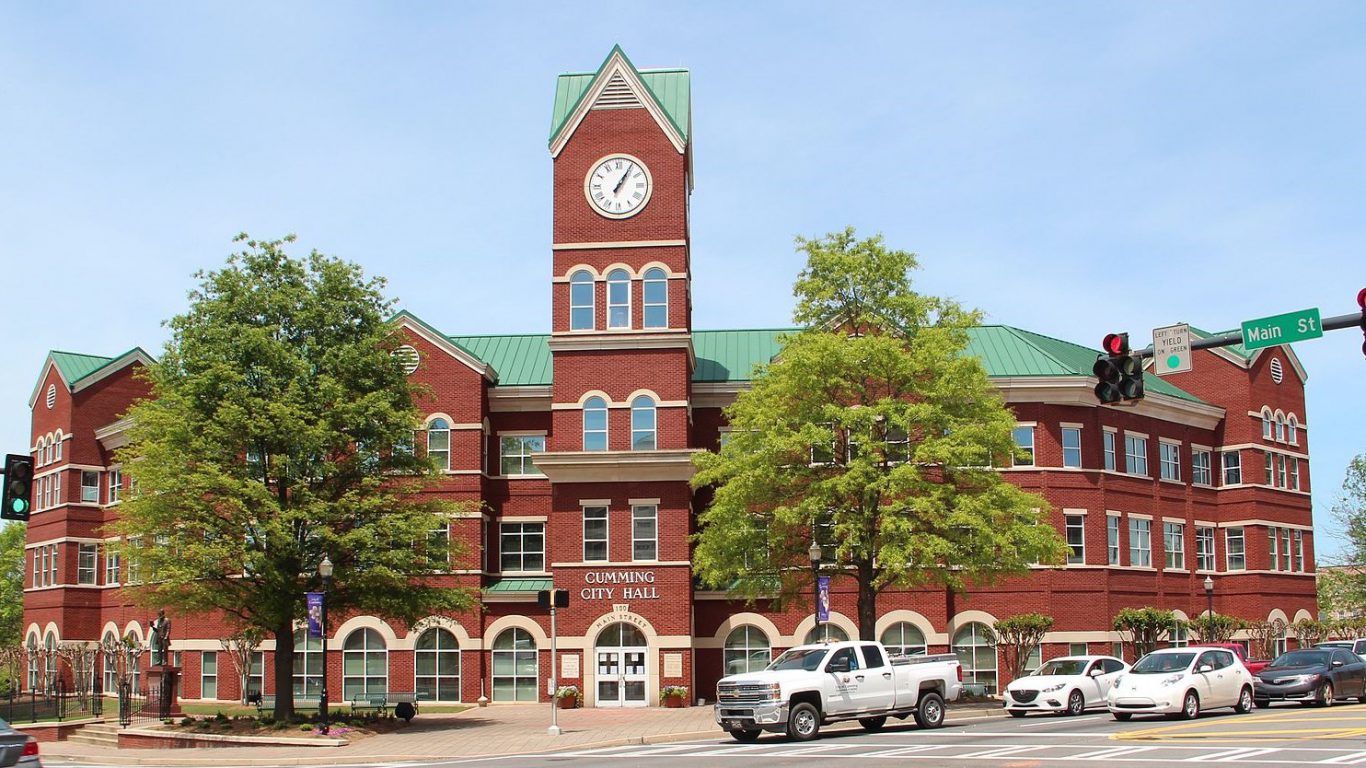
- Avg. life expectancy at birth: 82.3 years (3.7 years above U.S. avg.)
- Poverty rate: 4.6% (7.9 ppt. below U.S. avg.)
- Adults with a bachelor’s degree: 56.2% (21.9 ppt. above U.S. avg.)
- Median household income: $131,660 ($56,511 more than U.S. median)
- Population: 253,225
- County seat: Cumming
17. Albemarle County, Virginia

- Avg. life expectancy at birth: 82.3 years (3.7 years above U.S. avg.)
- Poverty rate: 7.1% (5.4 ppt. below U.S. avg.)
- Adults with a bachelor’s degree: 60.1% (25.8 ppt. above U.S. avg.)
- Median household income: $97,708 ($22,559 more than U.S. median)
- Population: 112,513
- County seat: Charlottesville
16. Delaware County, Ohio
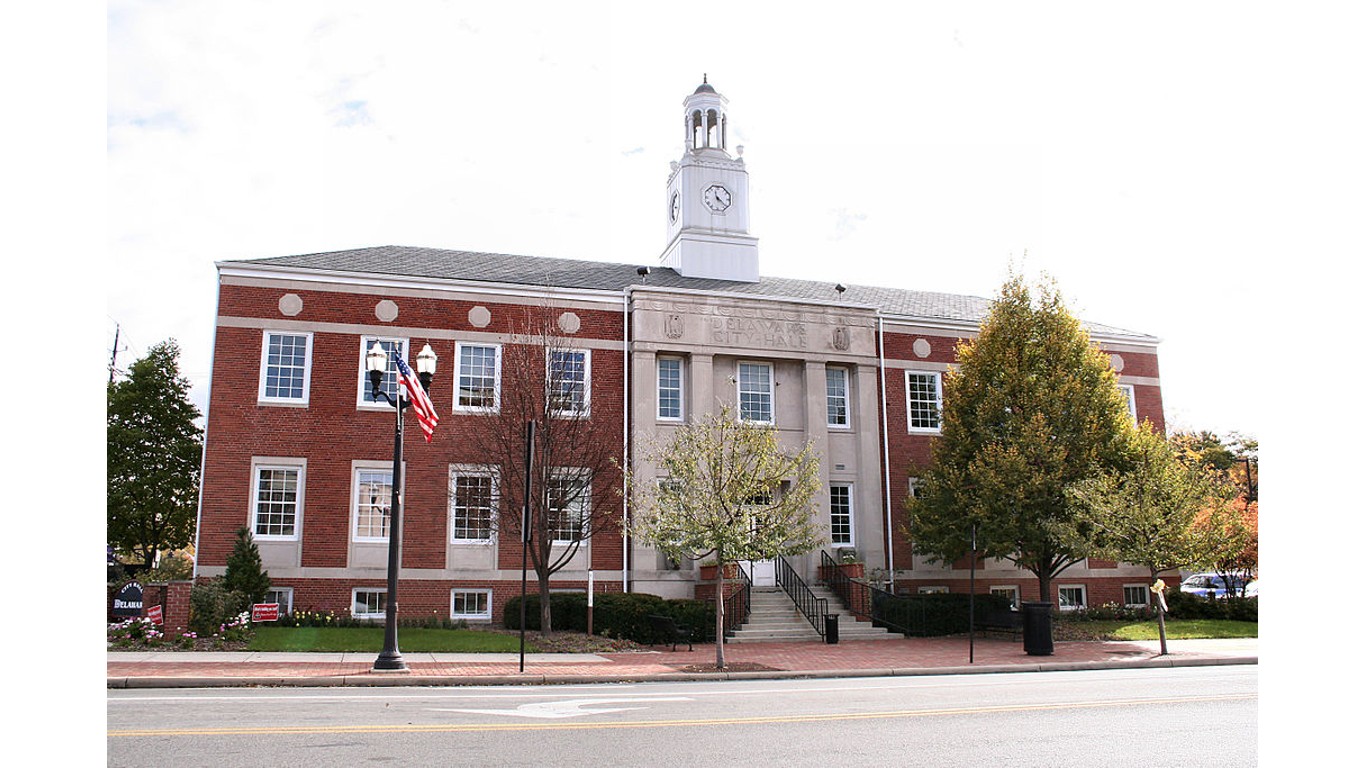
- Avg. life expectancy at birth: 81.7 years (3.2 years above U.S. avg.)
- Poverty rate: 4.5% (8.0 ppt. below U.S. avg.)
- Adults with a bachelor’s degree: 57.4% (23.1 ppt. above U.S. avg.)
- Median household income: $123,995 ($48,846 more than U.S. median)
- Population: 216,074
- County seat: Delaware
15. Nantucket County, Massachusetts

- Avg. life expectancy at birth: 83.0 years (4.5 years above U.S. avg.)
- Poverty rate: 4.9% (7.6 ppt. below U.S. avg.)
- Adults with a bachelor’s degree: 57.4% (23.1 ppt. above U.S. avg.)
- Median household income: $135,590 ($60,441 more than U.S. median)
- Population: 14,065
- County seat: Nantucket
14. Hunterdon County, New Jersey

- Avg. life expectancy at birth: 83.2 years (4.6 years above U.S. avg.)
- Poverty rate: 3.7% (8.8 ppt. below U.S. avg.)
- Adults with a bachelor’s degree: 55.5% (21.2 ppt. above U.S. avg.)
- Median household income: $133,534 ($58,385 more than U.S. median)
- Population: 129,099
- County seat: Flemington
13. Eagle County, Colorado

- Avg. life expectancy at birth: 91.4 years (12.8 years above U.S. avg.)
- Poverty rate: 8.0% (4.5 ppt. below U.S. avg.)
- Adults with a bachelor’s degree: 51.8% (17.5 ppt. above U.S. avg.)
- Median household income: $98,887 ($23,738 more than U.S. median)
- Population: 55,650
- County seat: Eagle
12. Hamilton County, Indiana

- Avg. life expectancy at birth: 81.6 years (3.0 years above U.S. avg.)
- Poverty rate: 4.2% (8.3 ppt. below U.S. avg.)
- Adults with a bachelor’s degree: 60.8% (26.5 ppt. above U.S. avg.)
- Median household income: $114,866 ($39,717 more than U.S. median)
- Population: 349,527
- County seat: Noblesville
11. Summit County, Utah

- Avg. life expectancy at birth: 85.6 years (7.0 years above U.S. avg.)
- Poverty rate: 5.2% (7.3 ppt. below U.S. avg.)
- Adults with a bachelor’s degree: 57.4% (23.1 ppt. above U.S. avg.)
- Median household income: $126,392 ($51,243 more than U.S. median)
- Population: 42,524
- County seat: Coalville
10. Williamson County, Tennessee
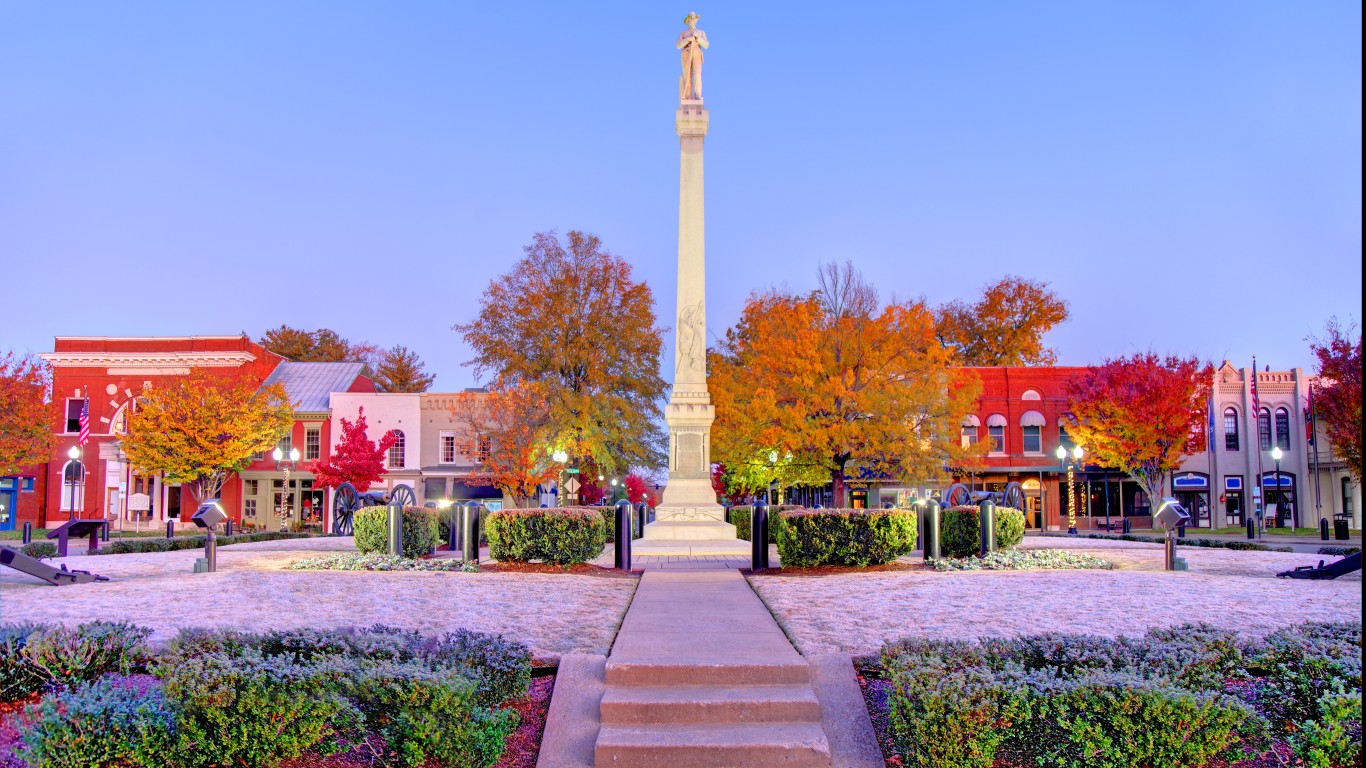
- Avg. life expectancy at birth: 81.5 years (3.0 years above U.S. avg.)
- Poverty rate: 4.2% (8.4 ppt. below U.S. avg.)
- Adults with a bachelor’s degree: 62.0% (27.7 ppt. above U.S. avg.)
- Median household income: $125,943 ($50,794 more than U.S. median)
- Population: 248,897
- County seat: Franklin
9. Marin County, California

- Avg. life expectancy at birth: 85.3 years (6.7 years above U.S. avg.)
- Poverty rate: 7.0% (5.6 ppt. below U.S. avg.)
- Adults with a bachelor’s degree: 61.1% (26.8 ppt. above U.S. avg.)
- Median household income: $142,019 ($66,870 more than U.S. median)
- Population: 260,485
- County seat: San Rafael
8. Teton County, Wyoming

- Avg. life expectancy at birth: 86.7 years (8.2 years above U.S. avg.)
- Poverty rate: 6.9% (5.6 ppt. below U.S. avg.)
- Adults with a bachelor’s degree: 60.3% (26.0 ppt. above U.S. avg.)
- Median household income: $108,279 ($33,130 more than U.S. median)
- Population: 23,346
- County seat: Jackson
7. Howard County, Maryland

- Avg. life expectancy at birth: 82.7 years (4.2 years above U.S. avg.)
- Poverty rate: 5.4% (7.2 ppt. below U.S. avg.)
- Adults with a bachelor’s degree: 64.0% (29.7 ppt. above U.S. avg.)
- Median household income: $140,971 ($65,822 more than U.S. median)
- Population: 332,011
- County seat: Ellicott City
6. Douglas County, Colorado

- Avg. life expectancy at birth: 83.4 years (4.9 years above U.S. avg.)
- Poverty rate: 3.0% (9.5 ppt. below U.S. avg.)
- Adults with a bachelor’s degree: 60.0% (25.7 ppt. above U.S. avg.)
- Median household income: $139,010 ($63,861 more than U.S. median)
- Population: 360,206
- County seat: Castle Rock
5. Summit County, Colorado

- Avg. life expectancy at birth: 93.5 years (15.0 years above U.S. avg.)
- Poverty rate: 7.4% (5.1 ppt. below U.S. avg.)
- Adults with a bachelor’s degree: 52.3% (17.9 ppt. above U.S. avg.)
- Median household income: $100,611 ($25,462 more than U.S. median)
- Population: 30,955
- County seat: Breckenridge
4. San Miguel County, Colorado

- Avg. life expectancy at birth: 93.6 years (15.1 years above U.S. avg.)
- Poverty rate: 8.5% (4.1 ppt. below U.S. avg.)
- Adults with a bachelor’s degree: 62.2% (27.8 ppt. above U.S. avg.)
- Median household income: $72,829 ($2,320 less than U.S. median)
- Population: 8,082
- County seat: Telluride
3. Los Alamos County, New Mexico

- Avg. life expectancy at birth: 83.9 years (5.3 years above U.S. avg.)
- Poverty rate: 3.7% (8.8 ppt. below U.S. avg.)
- Adults with a bachelor’s degree: 69.7% (35.4 ppt. above U.S. avg.)
- Median household income: $135,801 ($60,652 more than U.S. median)
- Population: 19,253
- County seat: Los Alamos
2. Pitkin County, Colorado

- Avg. life expectancy at birth: 92.5 years (14.0 years above U.S. avg.)
- Poverty rate: 6.7% (5.9 ppt. below U.S. avg.)
- Adults with a bachelor’s degree: 63.1% (28.8 ppt. above U.S. avg.)
- Median household income: $96,123 ($20,974 more than U.S. median)
- Population: 17,325
- County seat: Aspen
1. Falls Church, Virginia (independent city)
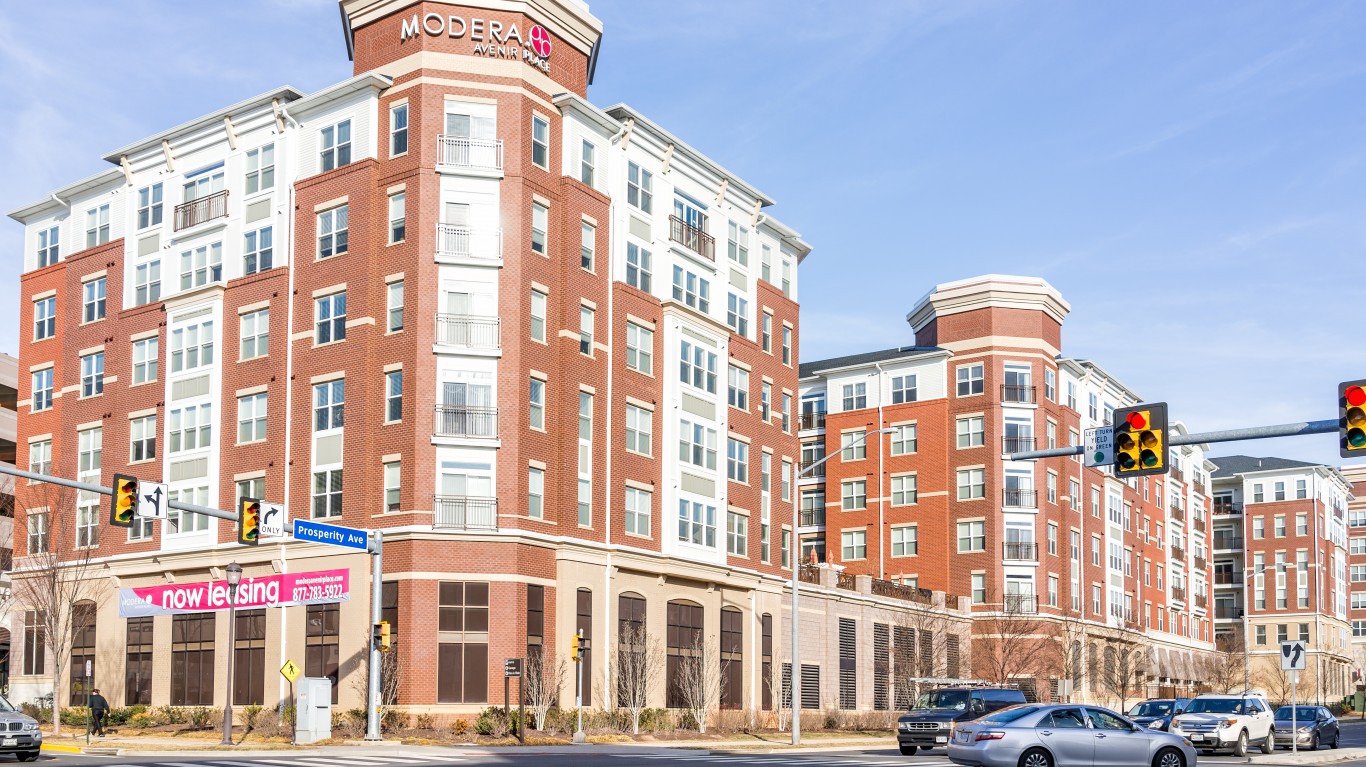
- Avg. life expectancy at birth: 80.6 years (2.1 years above U.S. avg.)
- Poverty rate: 2.3% (10.2 ppt. below U.S. avg.)
- Adults with a bachelor’s degree: 78.9% (44.6 ppt. above U.S. avg.)
- Median household income: $164,536 ($89,387 more than U.S. median)
- Population: 14,576
- County seat: None
“The Next NVIDIA” Could Change Your Life
If you missed out on NVIDIA’s historic run, your chance to see life-changing profits from AI isn’t over.
The 24/7 Wall Street Analyst who first called NVIDIA’s AI-fueled rise in 2009 just published a brand-new research report named “The Next NVIDIA.”
Click here to download your FREE copy.
The post People In This Part of America Live 34 Years Longer Than Average appeared first on 24/7 Wall St..