24/7 Wall St. Insights
- Even after the Emancipation Proclamation, Black Americans went on to endure many roadblocks to equal treatment and true freedom
- Despite all the forward advancements through the years, racism is still strong in the United States
Also, Discover “The Next NVIDIA”
The history of Blacks in America is sordid, to say the least. The first blacks in America arrived by slave ship in 1619 in Hampton, Virginia, where they were traded for supplies. Throughout the remainder of the 17th century, Europeans decided the captured African people were a better option for labor than the previously used white indentured servants. The following century (1700s) brought 6.5 million enslaved Africans to America. They were primarily sold to Southern states, where they lived a life of slavery, working on plantations. The passing of the Emancipation Proclamation in 1863 was a huge turning point, though it existed somewhat only in theory, as many freed slaves were marginalized and worked for extremely small wages.
Black Americans went on to endure many roadblocks to equal treatment and true freedom. The post-Civil War era Jim Crow Laws created dangerous conditions for many in the South. They faced deeply enforced segregation, limited opportunities, threats, and violence at the hands of their white neighbors. From 1865 – 1954, the nation watched as treatment of blacks remained untenable and became worse in many cities.
The civil rights movement was a grass-roots effort that gained traction in 1954 and brought attention to the country’s social disparities, injustices, and discrimination. A full 100 years after the Emancipation Proclamation, Black Americans won another victory with the 1964 Civil Rights Act, which banned segregation. Yet, the inhumane treatment, acts of violence, and deep-seated beliefs, behaviors, and policies had already left a legacy and taken deep root in many cities in the South and across America.
Despite all the forward advancements through the years, racism is still strong in the United States. As recently as 2020, George Floyd made national news when he was murdered in cold blood by a white police officer in the streets of Minneapolis, Minnesota. Additionally, statistics reveal that Blacks are disproportionately arrested for crimes like marijuana possession. But racism is not consistent across U.S. cities and states, with some areas of the country remaining worse for Black citizens than others.
According to the U.S. Department of the Treasury, racial disparity or inequality is “the unequal distribution of resources, power, and economic opportunity across race in a society. While the discussion of racial inequality in the United States is often focused on economic inequality, racial inequality also manifests itself in a multitude of ways that alone and together impact the well-being of all Americans. This includes racial disparities in wealth, education, employment, housing, mobility, health, rates of incarceration, and more.”
To determine the worst cities for Black Americans, 24/7 Wall St. examined data from eight socioeconomic measures in each of the nation’s 384 metropolitan areas. For each city, we evaluated the gap between White and Black residents in poverty, high school and college education, income, homeownership, unemployment, mortality, and incarceration.
We consulted data from the U.S. Census Bureau’s 2022 American Community Survey, Bureau of Justice Statistics, and Centers For Disease Control and Prevention. These figures were adjusted for population using ACS data. For each measure, we constructed an index of the gaps between Black and White Americans. The index was standardized using min-max normalization. We excluded metro areas where Black residents comprise less than 5% of the population. Because states, rather than metro areas, are responsible for the prison population, incarceration rates are for the state where the metro area is located. If a metro area spans more than one state, we used the state in which the metro area’s principal city is located. We aggregated mortality rates from the county to the metropolitan level using boundary definitions from the Census Bureau. Incarceration and mortality rates are per 100,000 residents.
Why This Matters
 Despite significant strides and continued efforts to address racial inequalities and disparities in the United States, racism remains. Recent findings suggest that even our Artificial Intelligence may be programed toward racism. Jeff Raikes, The Gates Foundation former CEO, stated that some AI programs “are still subtly perpetuating — or worse, enhancing — the biases of their (mostly white male) creators.” He also revealed that when scanning faces, AI tends to identify people of color as criminals or janitors. Deeply rooted views and practices need to change for these discriminating practices to further improve. Increased awareness of the issues and knowledge of the data can serve both individuals and decision-makers.
25. Decatur, IL

- Median household income, 2022: $32,570 (Black); $67,048 (White)
- Homeownership rate, 2022: 35.2% (Black); 76.4% (White)
- Unemployment rate, 2022: 18.9% (Black); 5.6% (White)
- Black population, 2022: 17,530 (16.9% of total)
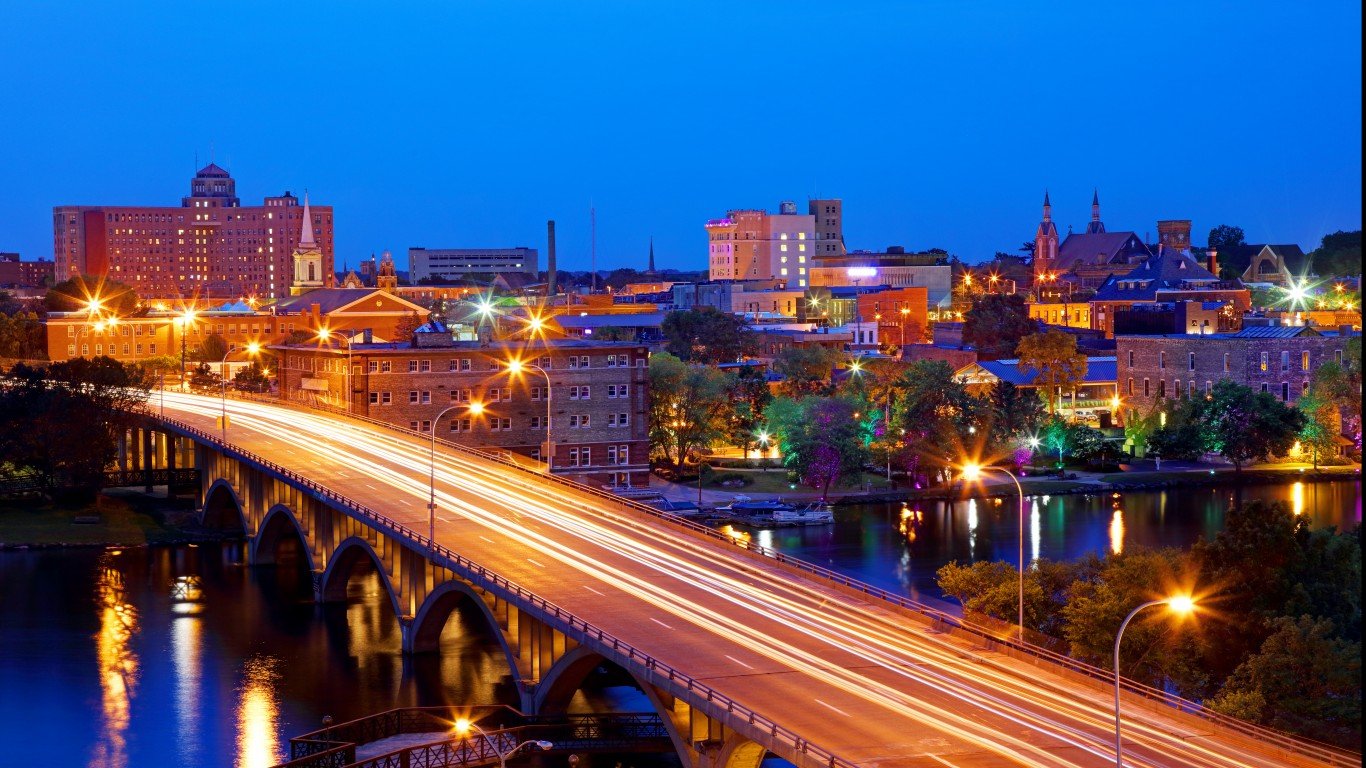
24. Erie, PA
- Median household income, 2022: $26,626 (Black); $63,010 (White)
- Homeownership rate, 2022: 33.6% (Black); 71.8% (White)
- Unemployment rate, 2022: 9.3% (Black); 5.2% (White)
- Black population, 2022: 18,087 (6.7% of total)
23. Champaign-Urbana, IL
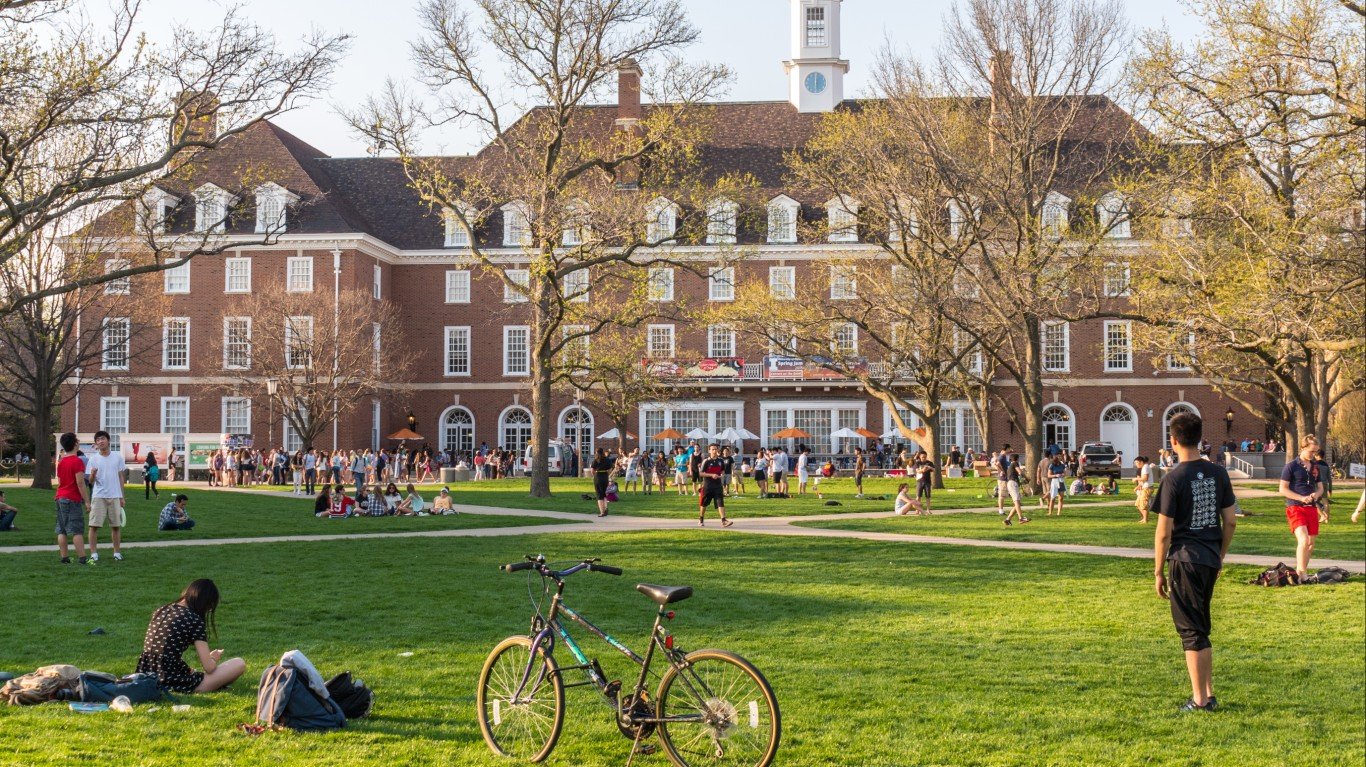
- Median household income, 2022: $37,241 (Black); $73,120 (White)
- Homeownership rate, 2022: 26.6% (Black); 65.4% (White)
- Unemployment rate, 2022: 12.5% (Black); 4.0% (White)
- Black population, 2022: 27,057 (12.1% of total)
22. Bridgeport-Stamford-Norwalk, CT

- Median household income, 2022: $70,129 (Black); $122,437 (White)
- Homeownership rate, 2022: 40.1% (Black); 74.7% (White)
- Unemployment rate, 2022: 8.5% (Black); 5.7% (White)
- Black population, 2022: 95,447 (10.0% of total)
21. Buffalo-Cheektowaga, NY
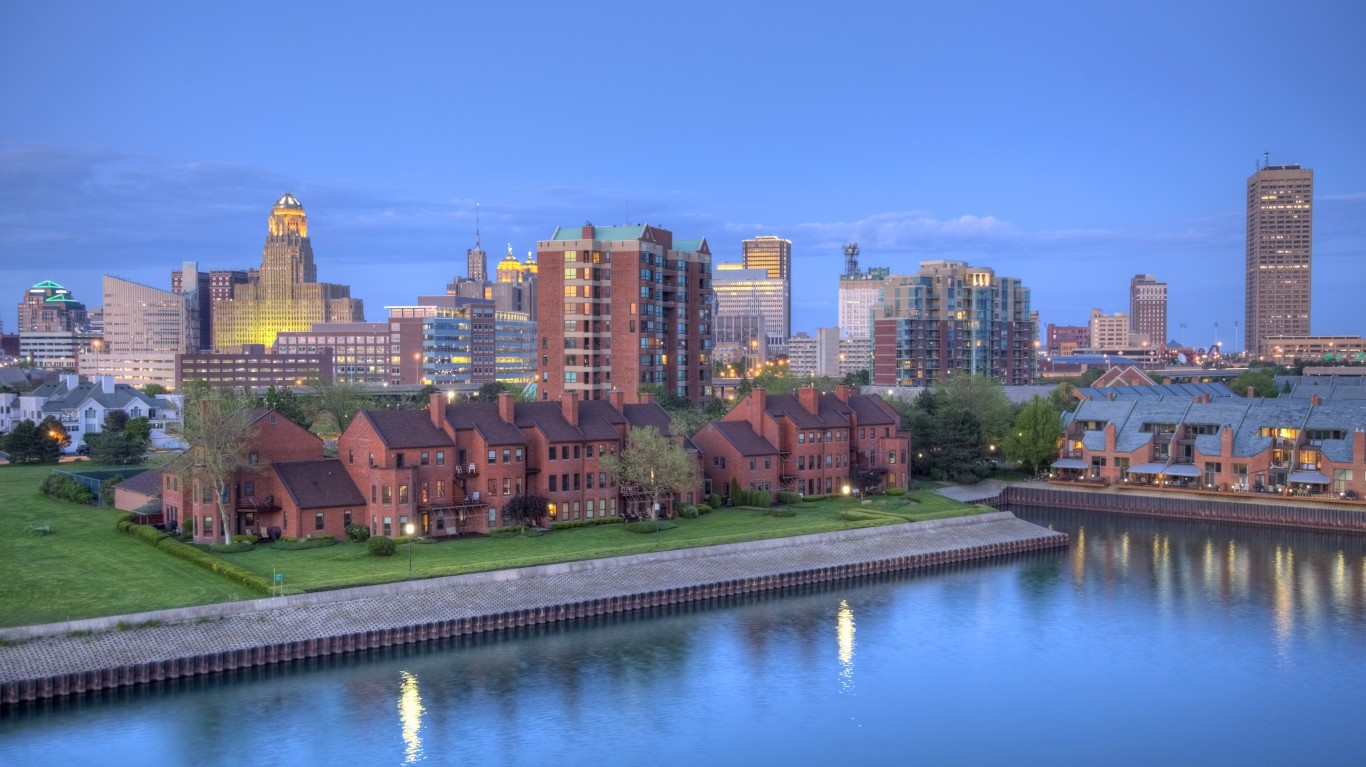
- Median household income, 2022: $39,461 (Black); $74,245 (White)
- Homeownership rate, 2022: 37.6% (Black); 72.2% (White)
- Unemployment rate, 2022: 9.8% (Black); 4.5% (White)
- Black population, 2022: 132,849 (11.4% of total)
20. Rockford, IL
- Median household income, 2022: $34,676 (Black); $69,224 (White)
- Homeownership rate, 2022: 28.0% (Black); 74.4% (White)
- Unemployment rate, 2022: 16.5% (Black); 6.6% (White)
- Black population, 2022: 38,033 (11.3% of total)
19. Albany-Schenectady-Troy, NY

- Median household income, 2022: $45,681 (Black); $88,060 (White)
- Homeownership rate, 2022: 25.1% (Black); 68.9% (White)
- Unemployment rate, 2022: 10.8% (Black); 4.2% (White)
- Black population, 2022: 65,586 (7.3% of total)
18. Omaha-Council Bluffs, NE-IA
- Median household income, 2022: $43,856 (Black); $84,385 (White)
- Homeownership rate, 2022: 31.9% (Black); 70.6% (White)
- Unemployment rate, 2022: 8.8% (Black); 3.0% (White)
- Black population, 2022: 70,849 (7.3% of total)
17. Peoria, IL

- Median household income, 2022: $34,891 (Black); $70,355 (White)
- Homeownership rate, 2022: 33.4% (Black); 76.5% (White)
- Unemployment rate, 2022: 15.6% (Black); 4.5% (White)
- Black population, 2022: 34,545 (8.6% of total)
16. Minneapolis-St. Paul-Bloomington, MN-WI
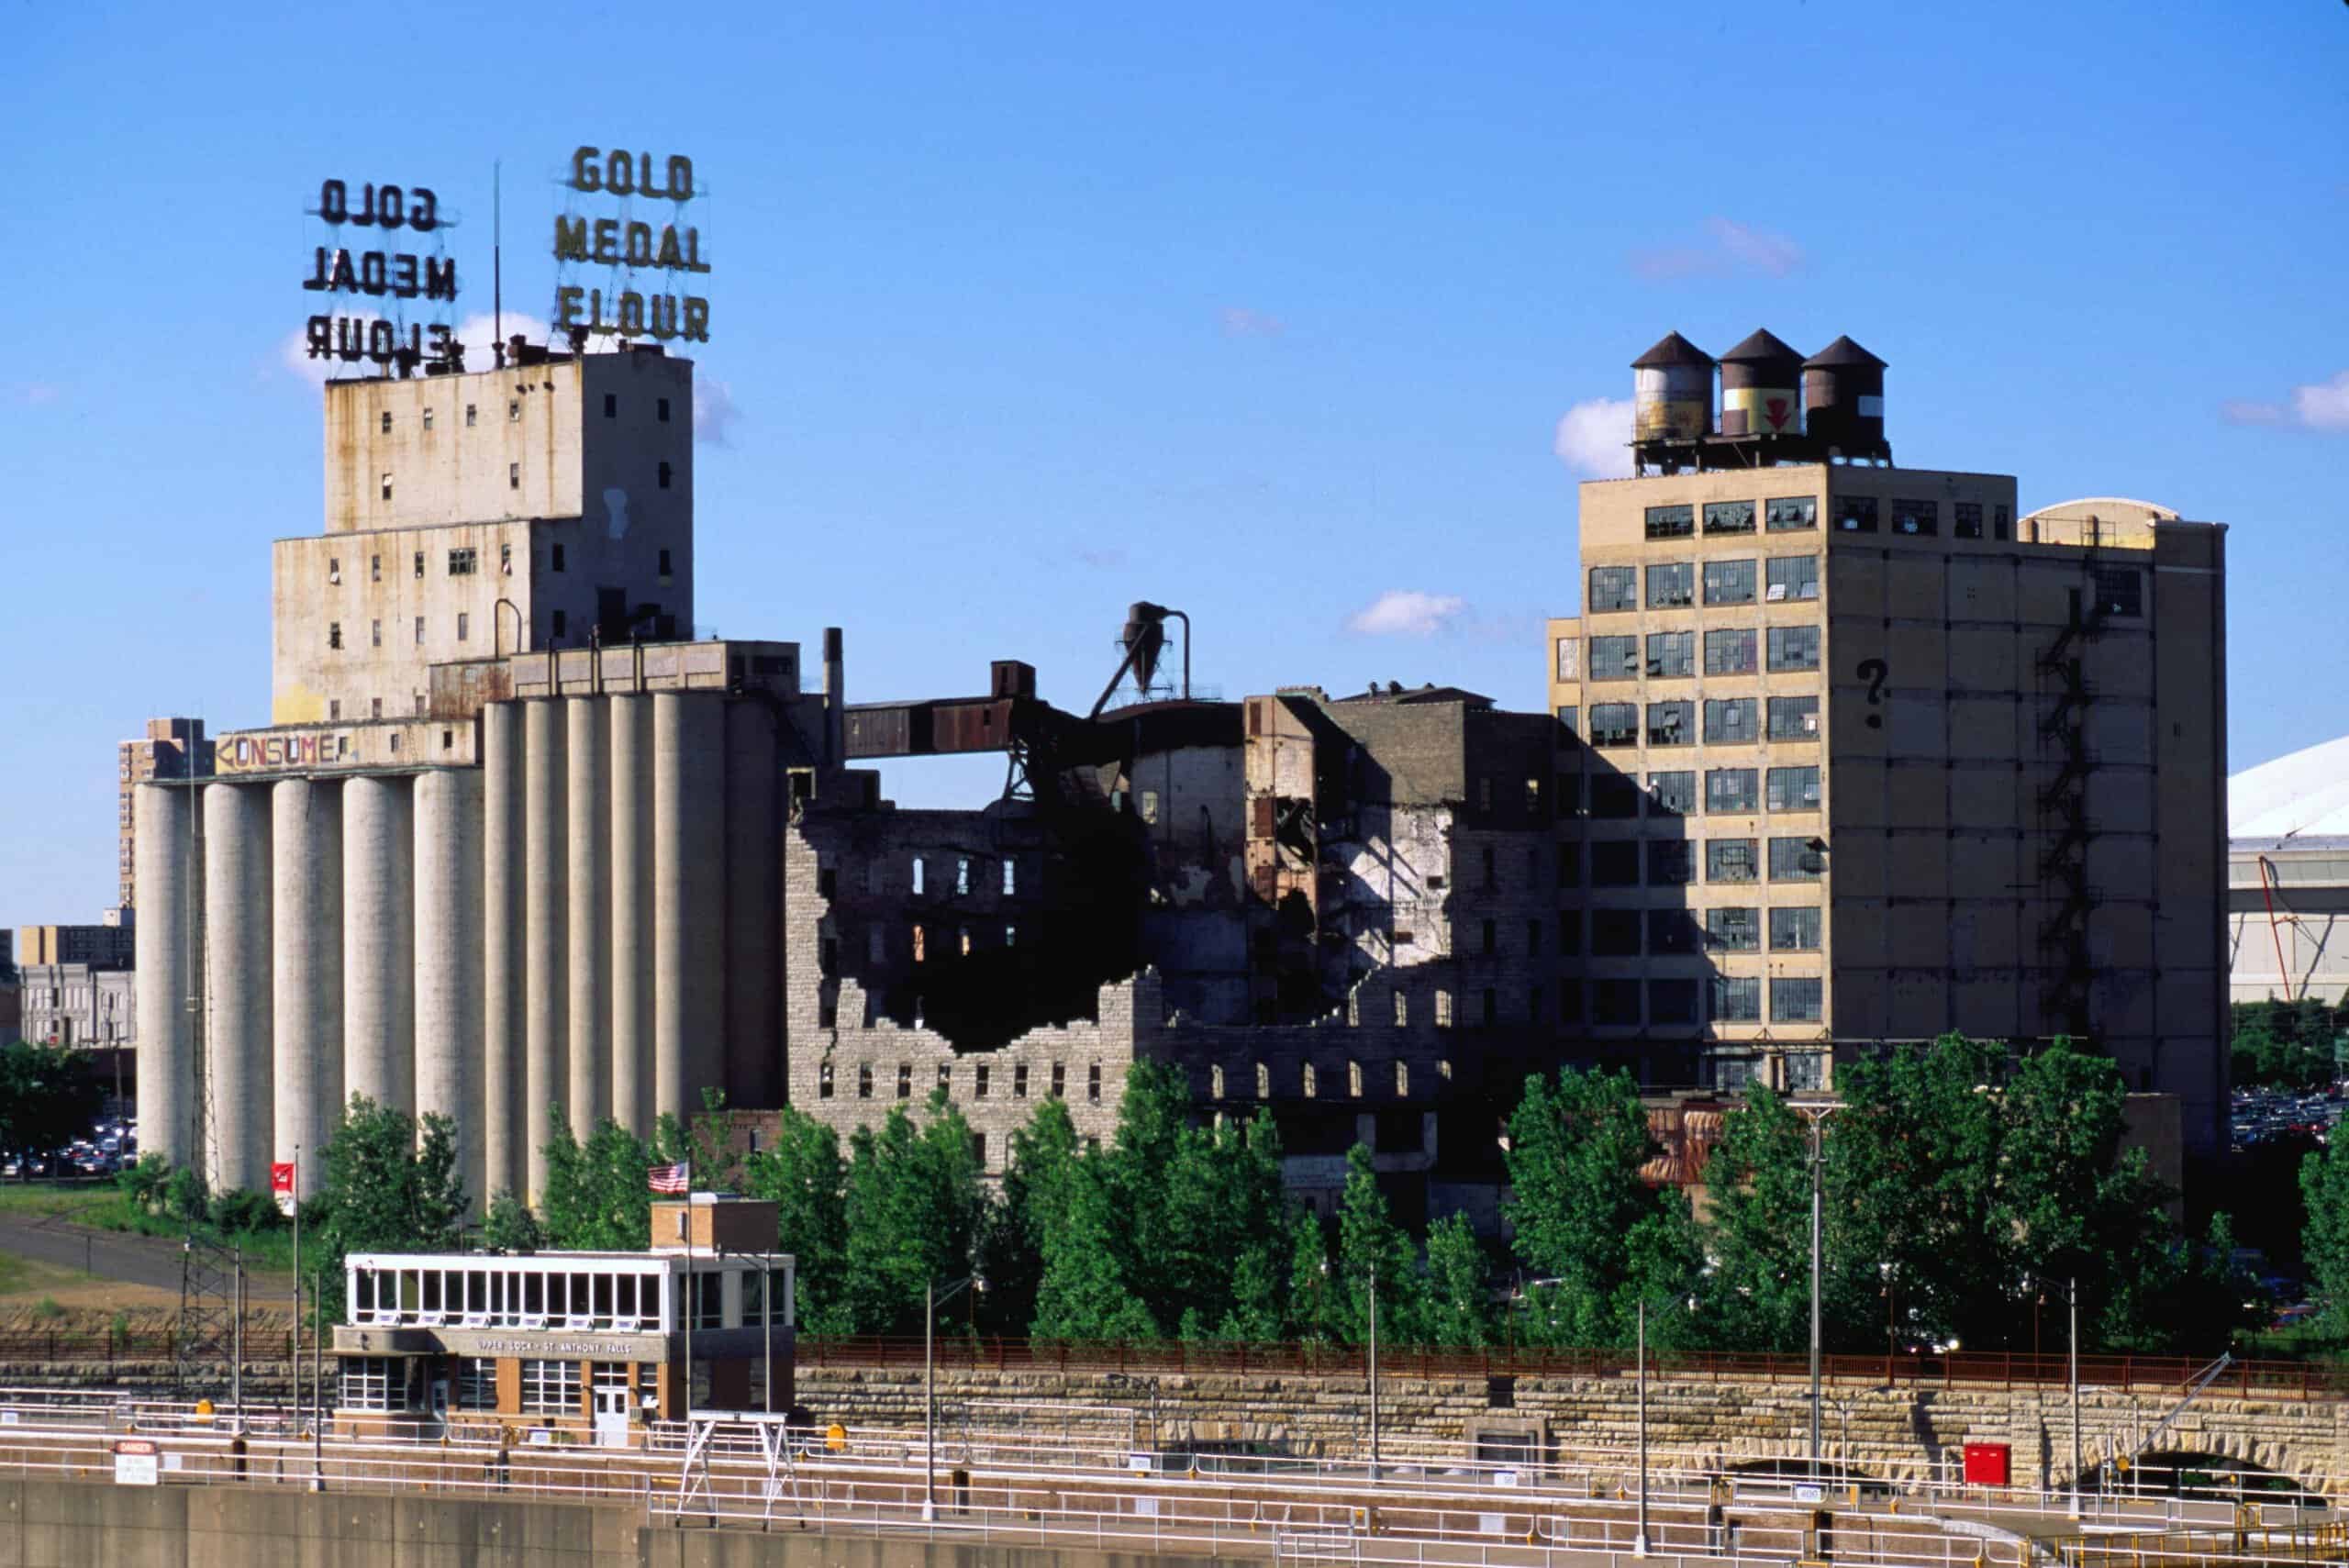
- Median household income, 2022: $51,321 (Black); $100,582 (White)
- Homeownership rate, 2022: 29.9% (Black); 76.4% (White)
- Unemployment rate, 2022: 8.2% (Black); 3.3% (White)
- Black population, 2022: 320,181 (8.7% of total)
15. Niles, MI
- Median household income, 2022: $29,073 (Black); $67,707 (White)
- Homeownership rate, 2022: 38.3% (Black); 79.2% (White)
- Unemployment rate, 2022: 15.4% (Black); 5.0% (White)
- Black population, 2022: 21,433 (13.9% of total)
14. Des Moines-West Des Moines, IA
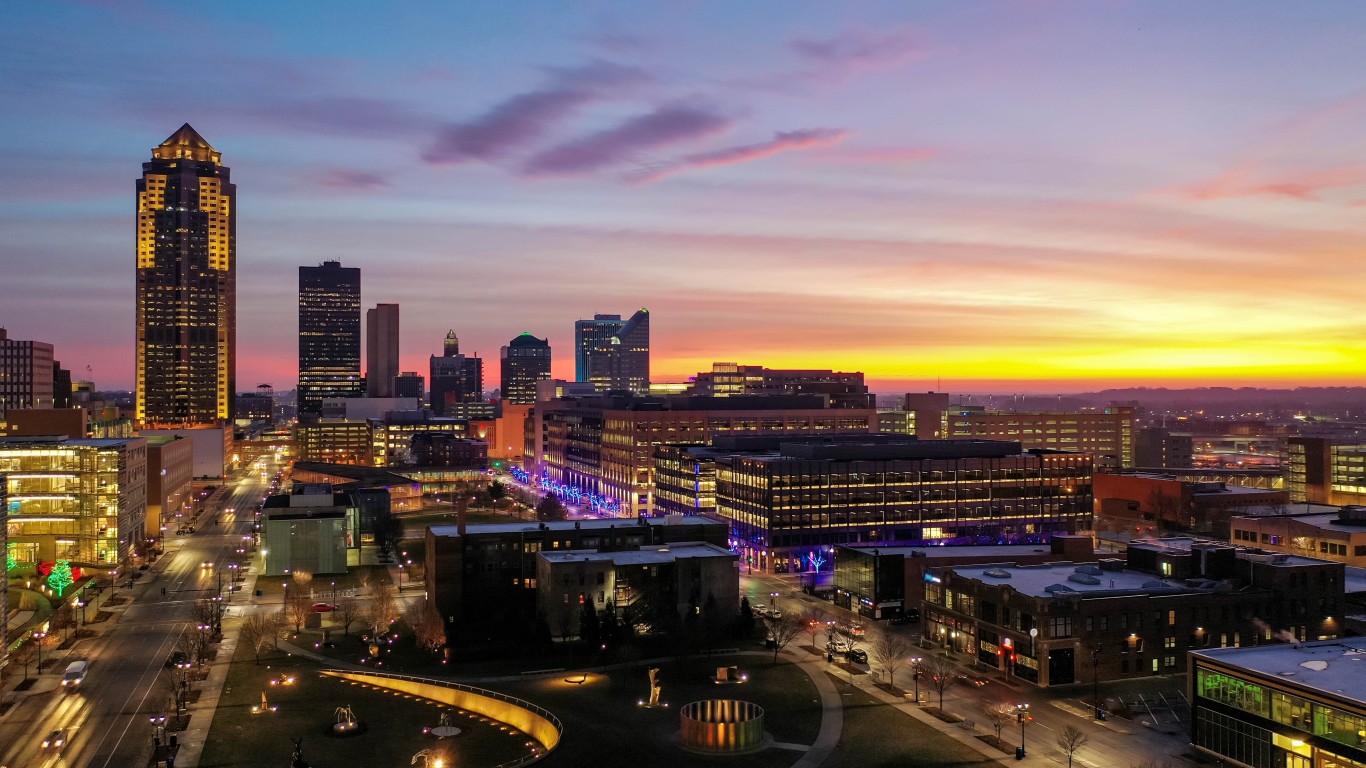
- Median household income, 2022: $45,529 (Black); $83,994 (White)
- Homeownership rate, 2022: 30.2% (Black); 73.0% (White)
- Unemployment rate, 2022: 8.9% (Black); 3.6% (White)
- Black population, 2022: 38,739 (5.4% of total)
13. Atlantic City-Hammonton, NJ
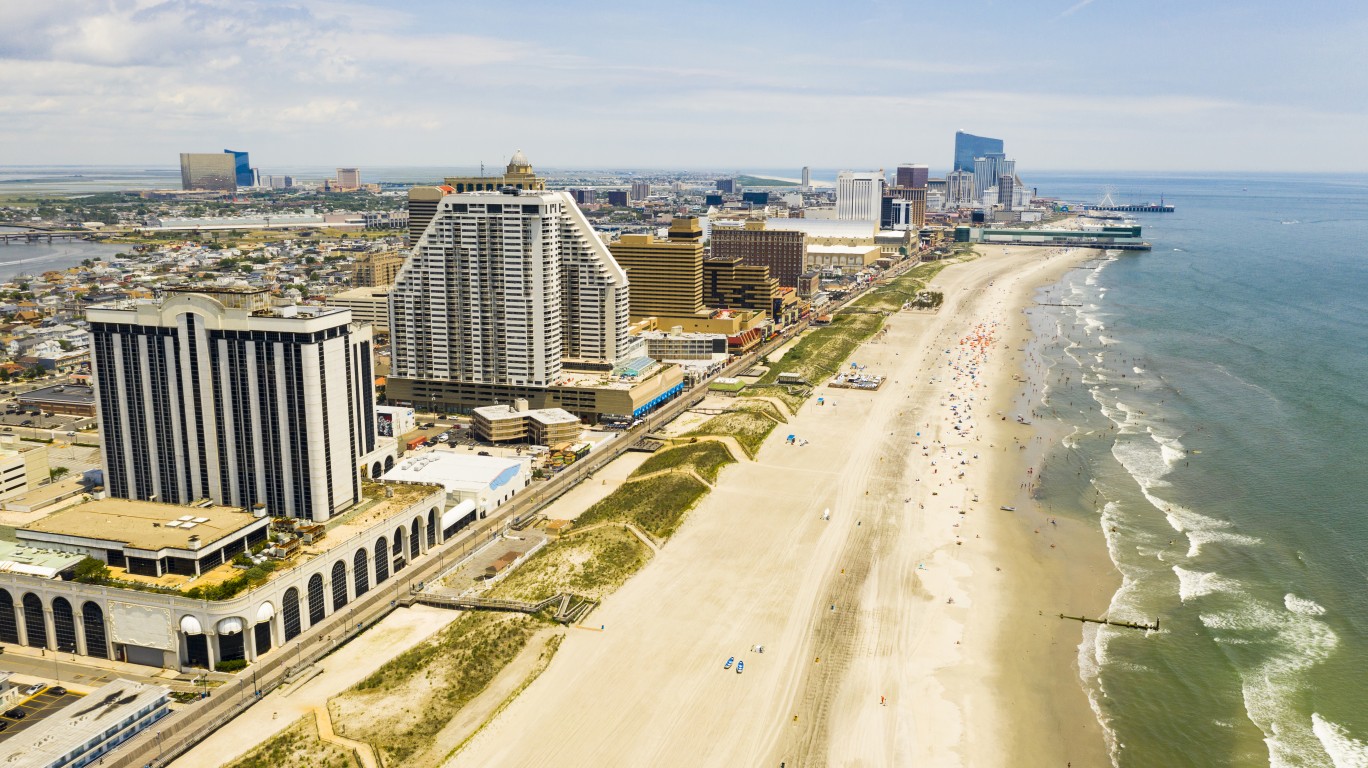
- Median household income, 2022: $49,658 (Black); $83,877 (White)
- Homeownership rate, 2022: 42.1% (Black); 76.8% (White)
- Unemployment rate, 2022: 11.3% (Black); 6.9% (White)
- Black population, 2022: 35,485 (12.9% of total)
12. Rochester, NY

- Median household income, 2022: $40,670 (Black); $77,124 (White)
- Homeownership rate, 2022: 35.0% (Black); 73.3% (White)
- Unemployment rate, 2022: 10.7% (Black); 4.1% (White)
- Black population, 2022: 114,029 (10.5% of total)
11. Chicago-Naperville-Elgin, IL-IN-WI
- Median household income, 2022: $49,194 (Black); $97,568 (White)
- Homeownership rate, 2022: 41.6% (Black); 73.5% (White)
- Unemployment rate, 2022: 13.7% (Black); 4.8% (White)
- Black population, 2022: 1,522,030 (15.9% of total)
10. Syracuse, NY

- Median household income, 2022: $37,127 (Black); $74,176 (White)
- Homeownership rate, 2022: 30.2% (Black); 72.6% (White)
- Unemployment rate, 2022: 12.5% (Black); 5.3% (White)
- Black population, 2022: 51,468 (7.8% of total)
9. Davenport-Moline-Rock Island, IA-IL
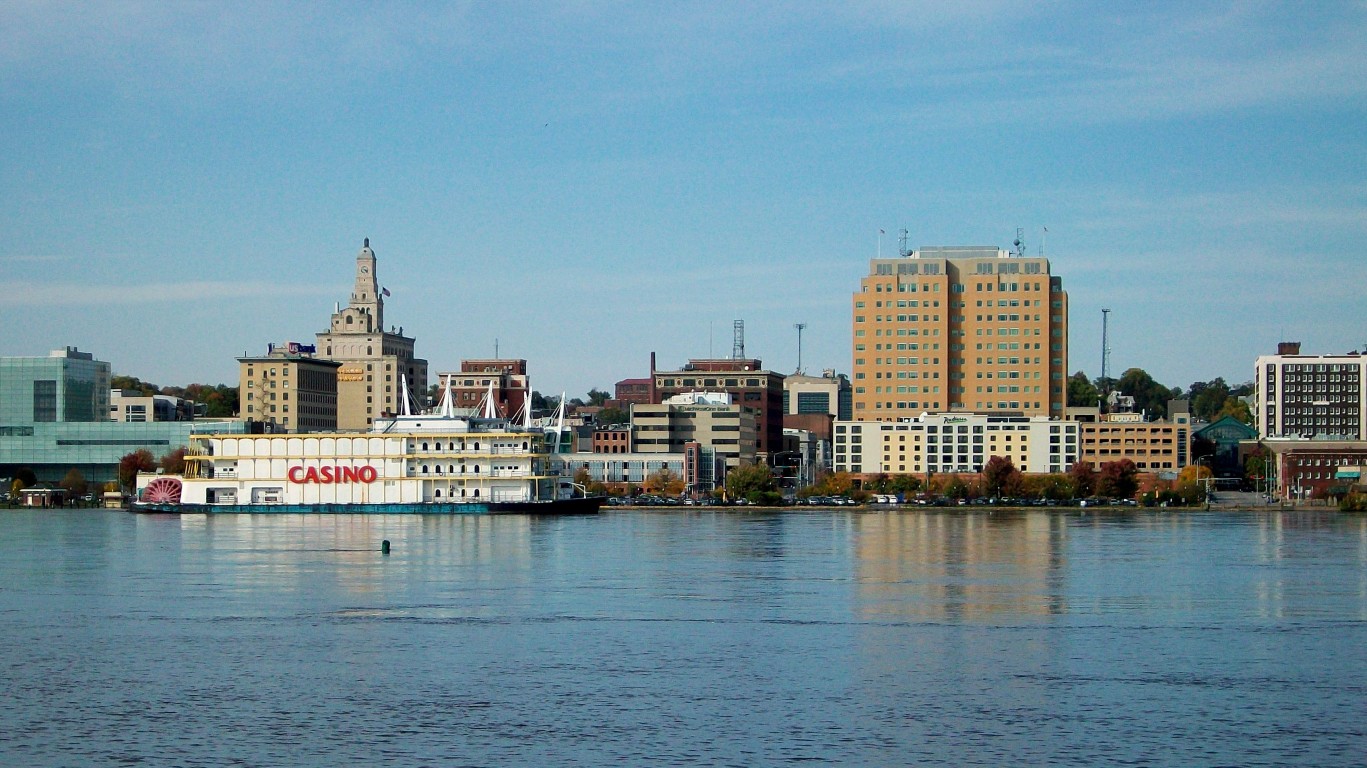
- Median household income, 2022: $40,288 (Black); $71,697 (White)
- Homeownership rate, 2022: 30.9% (Black); 74.6% (White)
- Unemployment rate, 2022: 16.2% (Black); 4.0% (White)
- Black population, 2022: 27,796 (7.3% of total)
8. Waterloo-Cedar Falls, IA

- Median household income, 2022: $34,268 (Black); $70,413 (White)
- Homeownership rate, 2022: 31.7% (Black); 73.4% (White)
- Unemployment rate, 2022: 18.1% (Black); 3.4% (White)
- Black population, 2022: 12,996 (7.7% of total)
7. San Francisco-Oakland-Berkeley, CA

- Median household income, 2022: $70,119 (Black); $145,999 (White)
- Homeownership rate, 2022: 35.1% (Black); 60.0% (White)
- Unemployment rate, 2022: 9.2% (Black); 4.8% (White)
- Black population, 2022: 326,676 (7.0% of total)
6. Trenton-Princeton, NJ
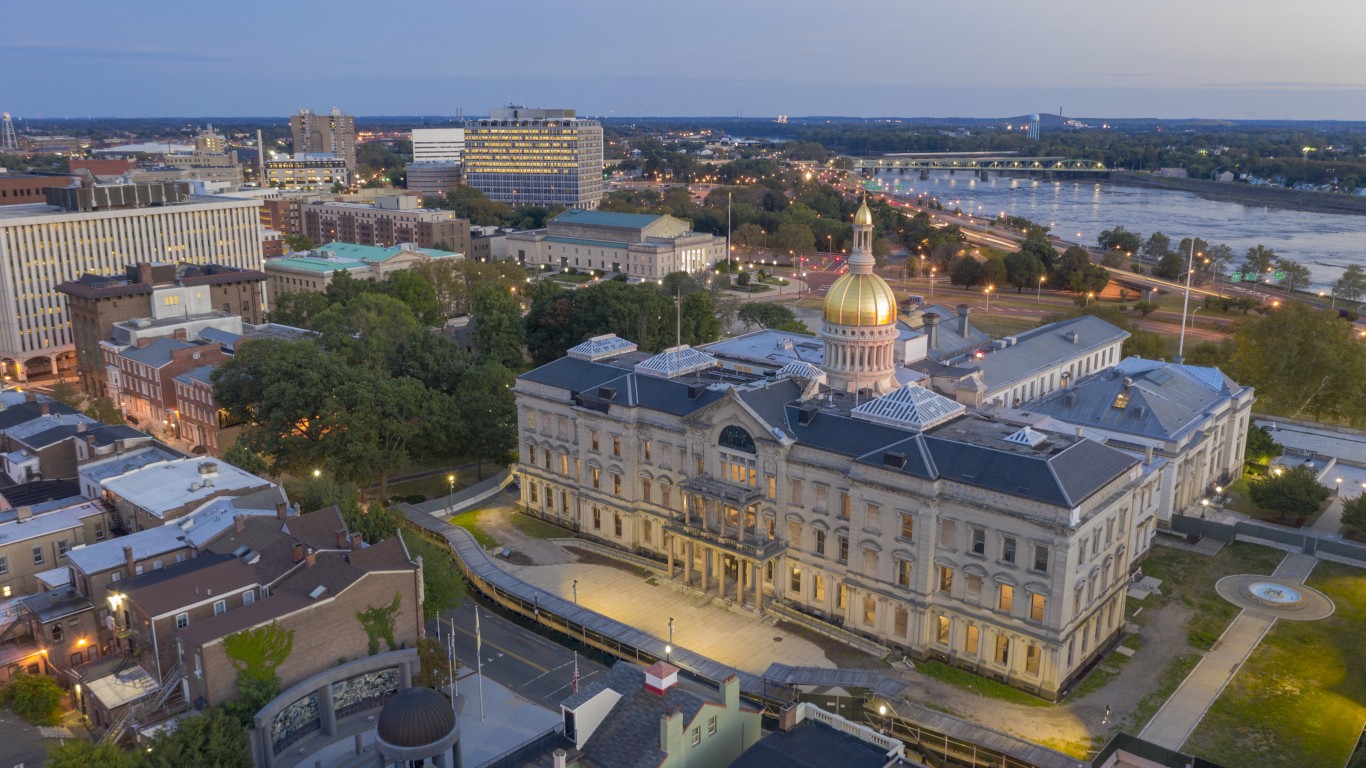
- Median household income, 2022: $56,828 (Black); $103,481 (White)
- Homeownership rate, 2022: 40.1% (Black); 71.7% (White)
- Unemployment rate, 2022: 10.0% (Black); 5.6% (White)
- Black population, 2022: 73,261 (19.1% of total)
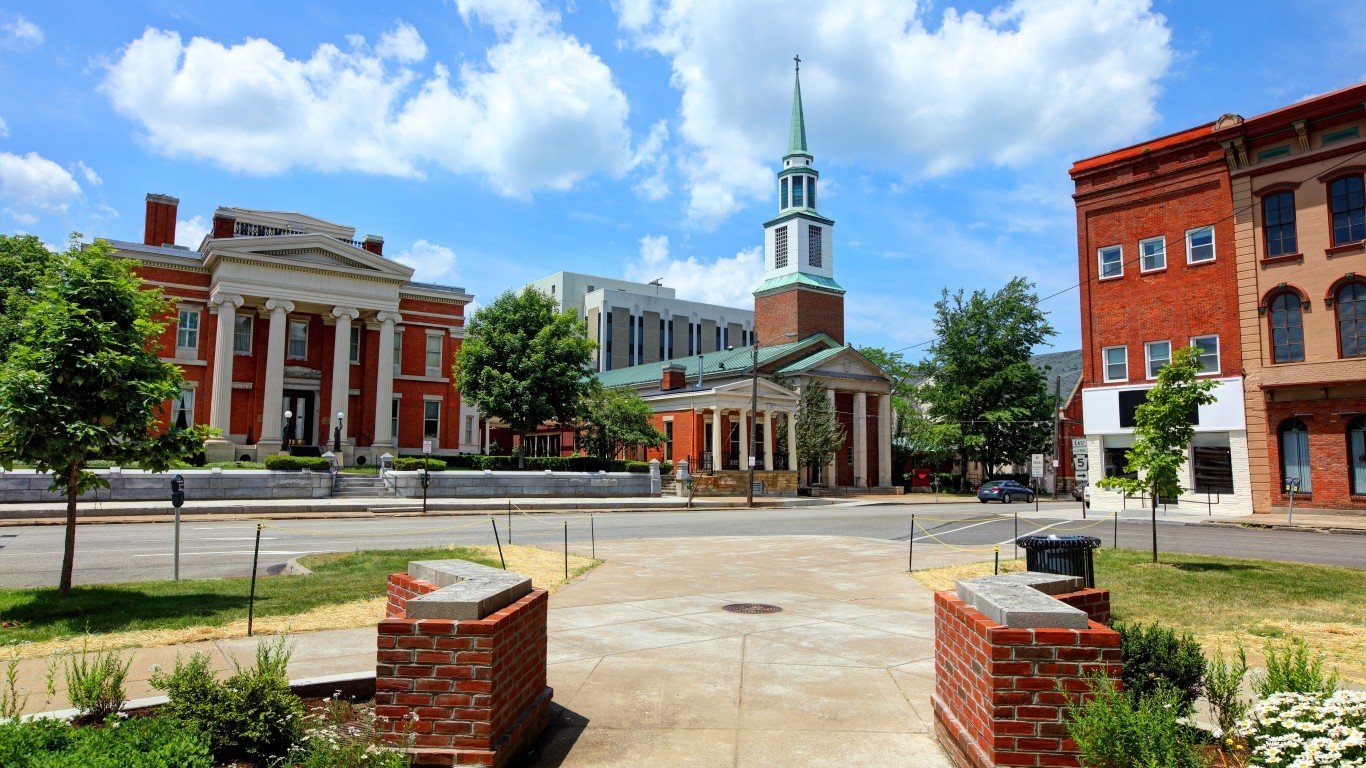
5. Springfield, IL
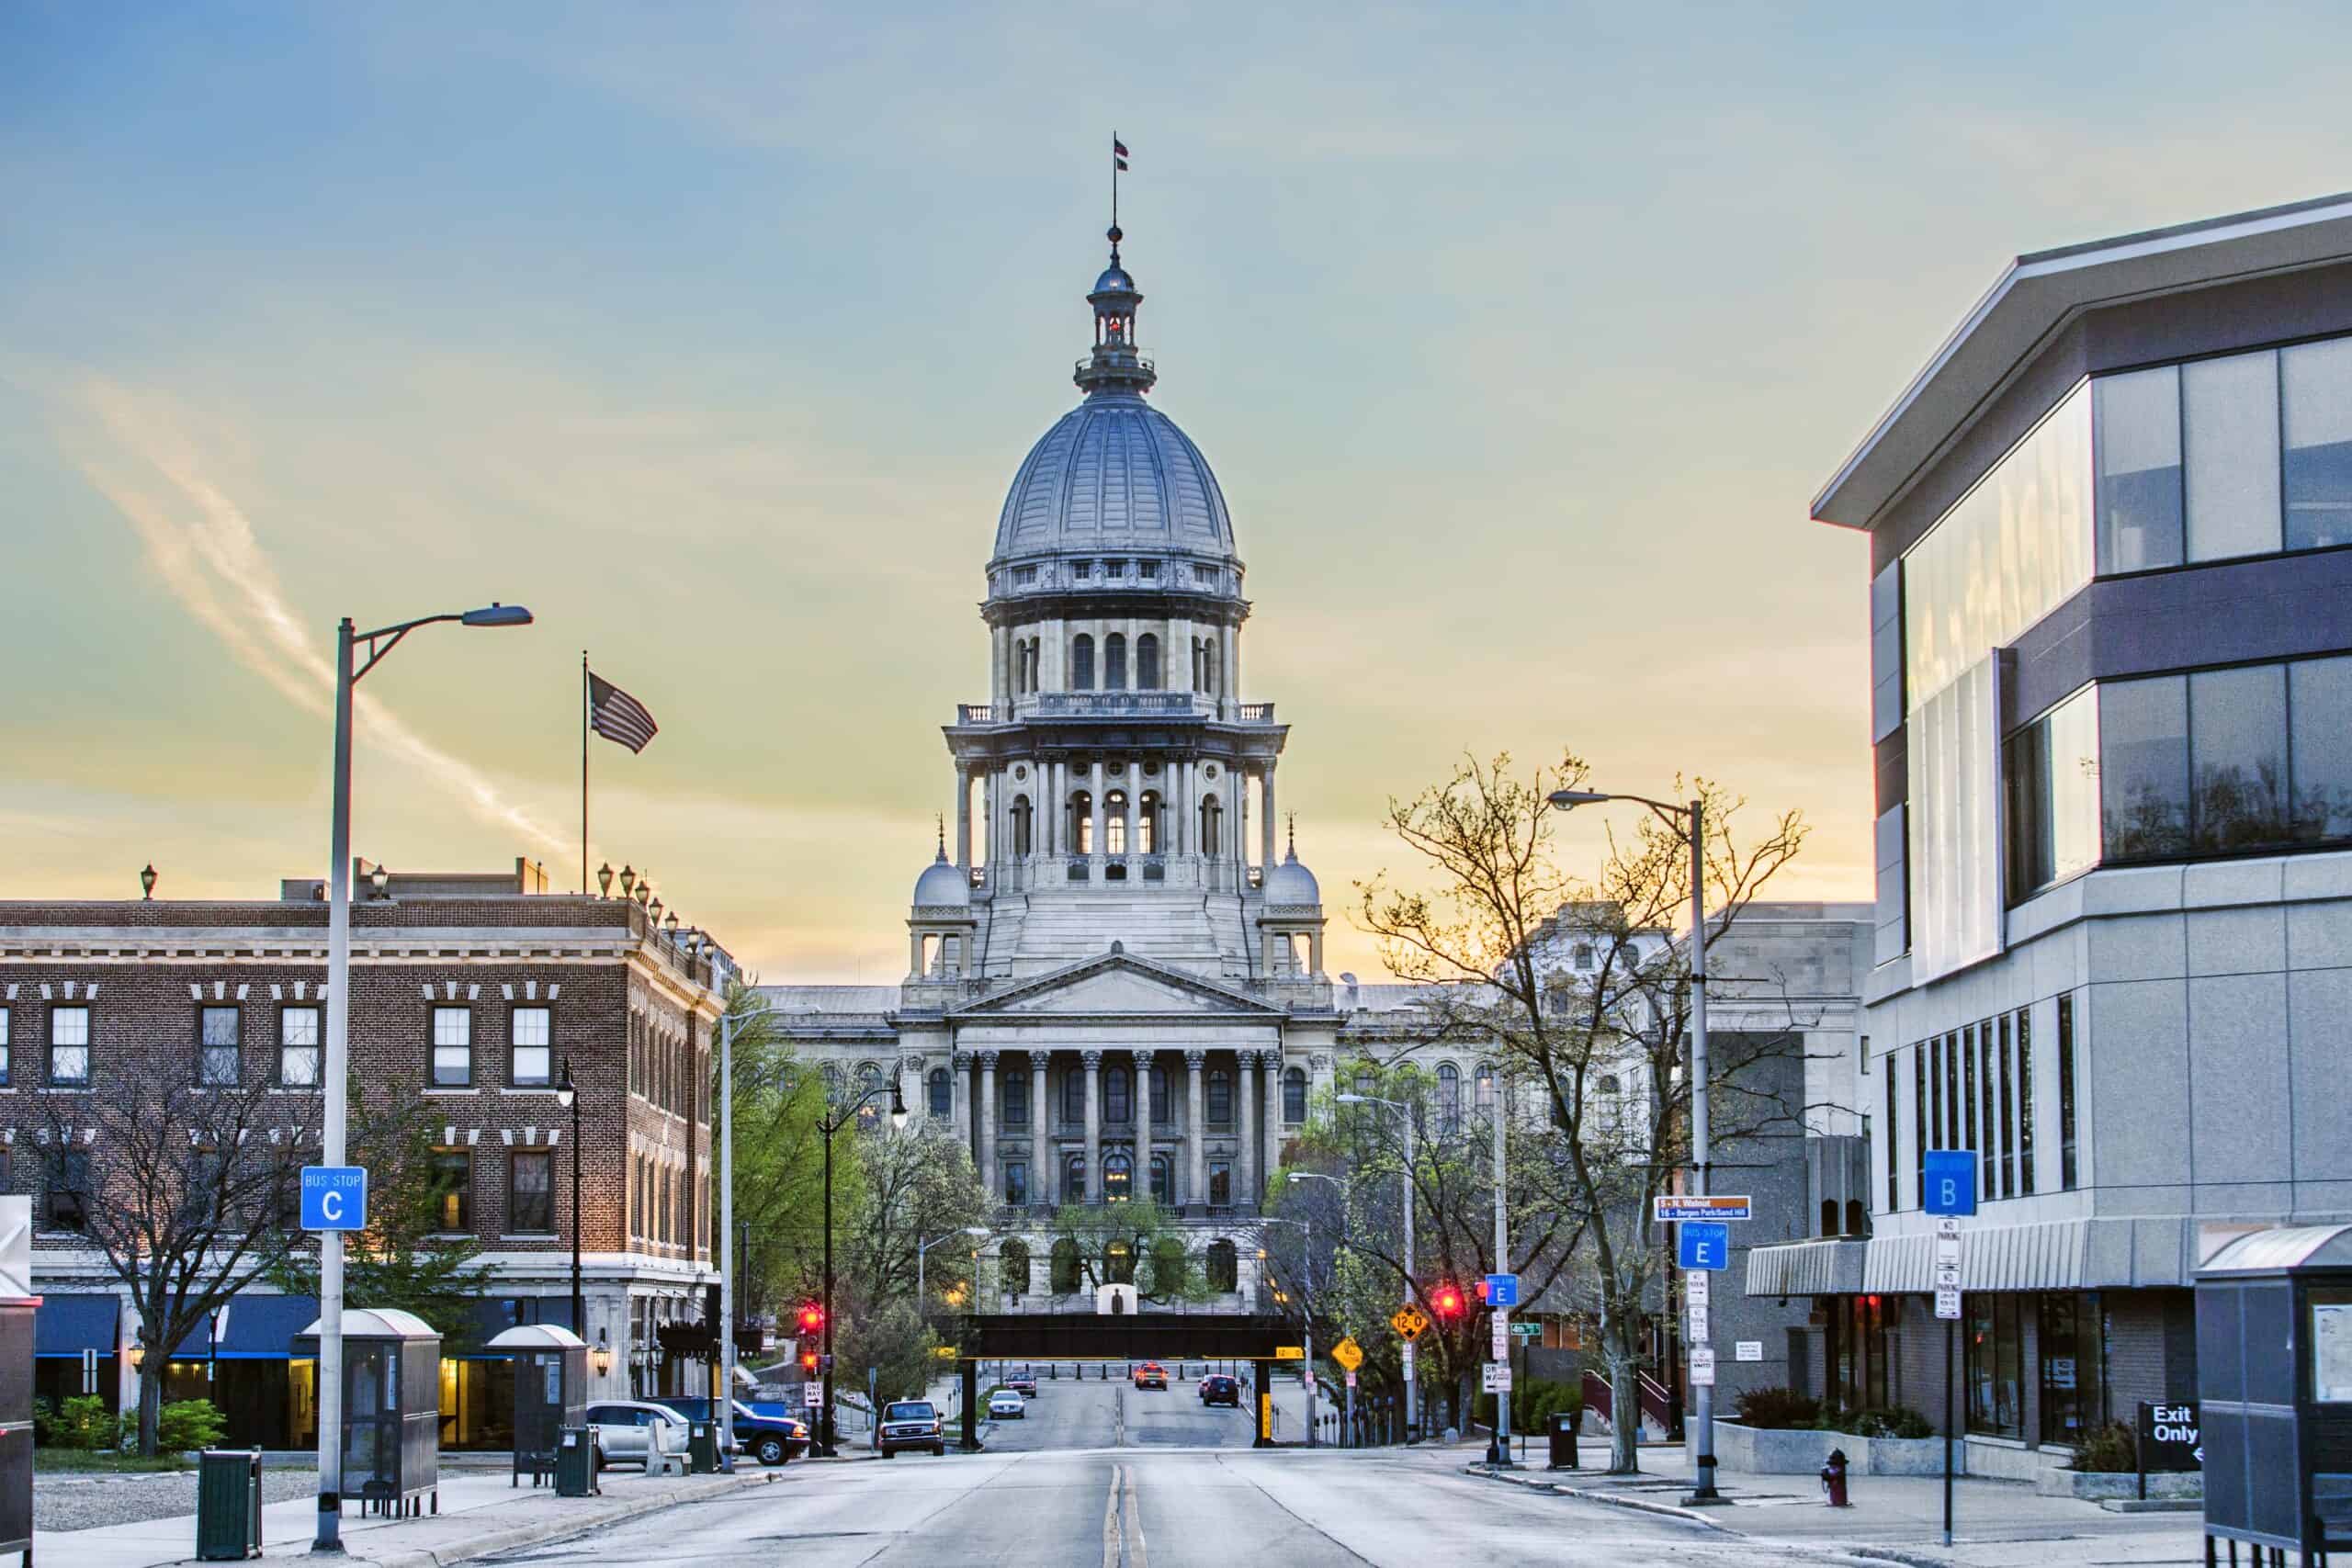
- Median household income, 2022: $29,482 (Black); $78,904 (White)
- Homeownership rate, 2022: 27.8% (Black); 77.3% (White)
- Unemployment rate, 2022: 15.8% (Black); 3.9% (White)
- Black population, 2022: 24,804 (11.9% of total)
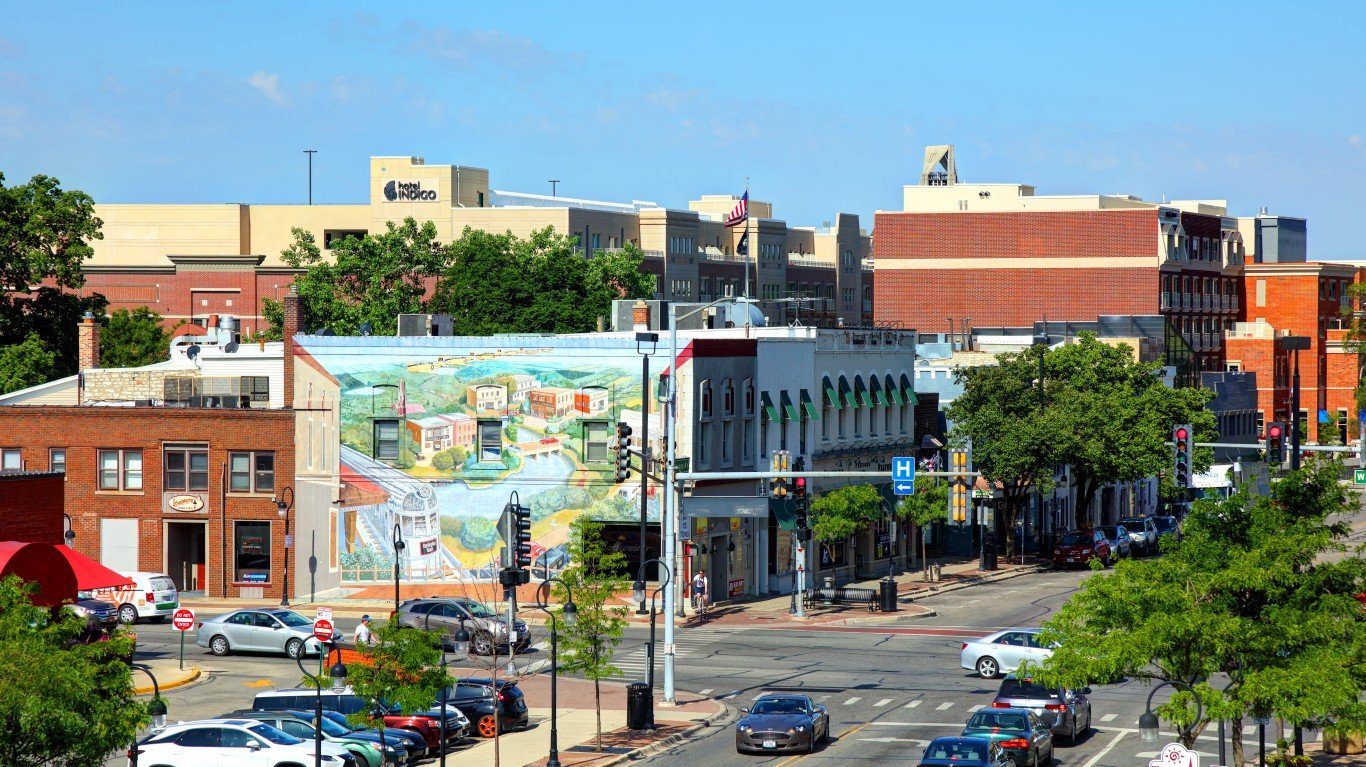
4. Racine, WI

- Median household income, 2022: $41,458 (Black); $79,477 (White)
- Homeownership rate, 2022: 29.6% (Black); 76.3% (White)
- Unemployment rate, 2022: 7.6% (Black); 3.4% (White)
- Black population, 2022: 21,090 (10.7% of total)
3. Rochester, MN
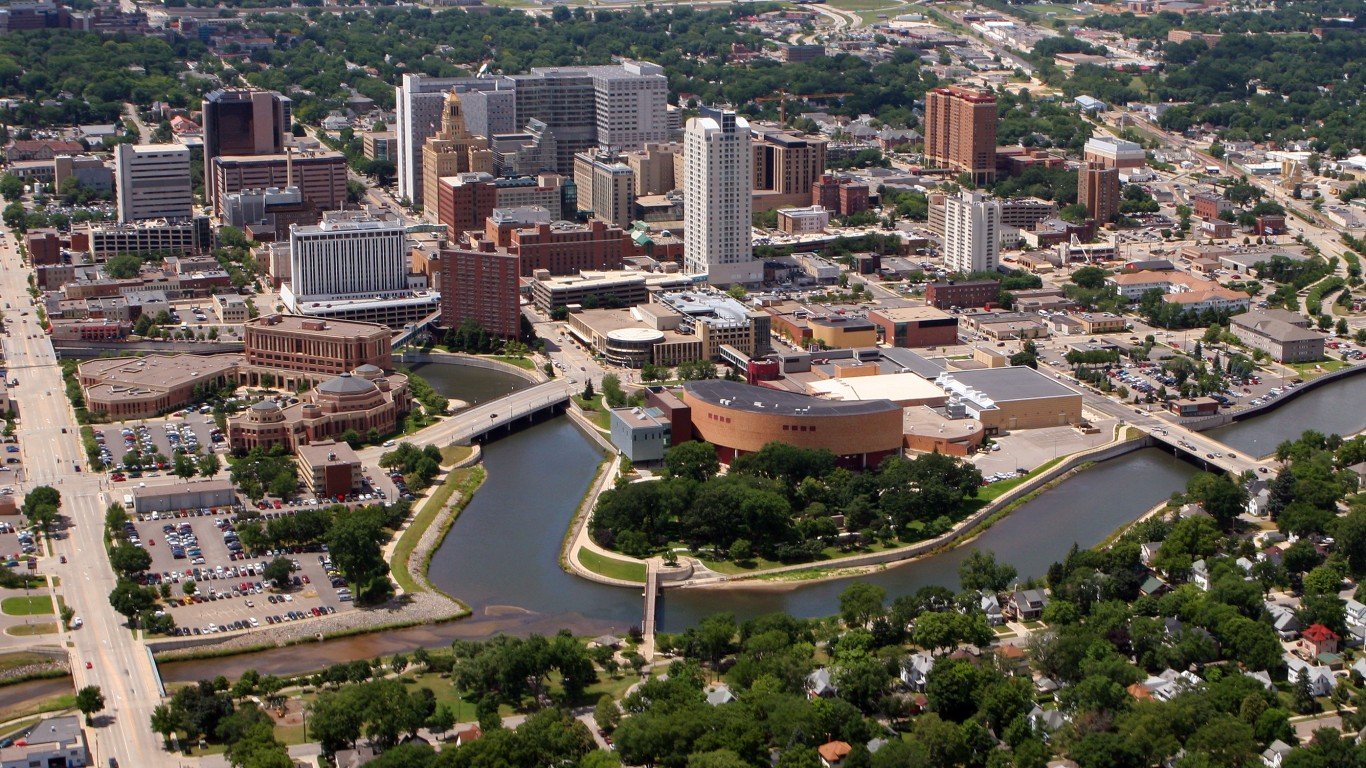
- Median household income, 2022: $38,617 (Black); $90,820 (White)
- Homeownership rate, 2022: 20.8% (Black); 78.1% (White)
- Unemployment rate, 2022: 9.2% (Black); 2.8% (White)
- Black population, 2022: 11,618 (5.1% of total)
2. St. Cloud, MN

- Median household income, 2022: $44,597 (Black); $76,223 (White)
- Homeownership rate, 2022: 11.5% (Black); 72.5% (White)
- Unemployment rate, 2022: 16.3% (Black); 3.6% (White)
- Black population, 2022: 15,003 (7.5% of total)
1. Milwaukee-Waukesha, WI

- Median household income, 2022: $37,182 (Black); $84,267 (White)
- Homeownership rate, 2022: 27.5% (Black); 69.0% (White)
- Unemployment rate, 2022: 8.5% (Black); 3.0% (White)
- Black population, 2022: 248,989 (15.9% of total)
“The Next NVIDIA” Could Change Your Life
If you missed out on NVIDIA’s historic run, your chance to see life-changing profits from AI isn’t over.
The 24/7 Wall Street Analyst who first called NVIDIA’s AI-fueled rise in 2009 just published a brand-new research report named “The Next NVIDIA.”
Click here to download your FREE copy.
The post Black Americans Should Avoid Moving to This City appeared first on 24/7 Wall St..