24/7 Wall St. Insights
- Those most likely to experience poverty are people living in a home where the head of household is unemployed.
- California ranks in the top 10 in terms of wealth, but there are still California towns that see a high poverty rate.
Also, Discover “The Next NVIDIA”
Poverty is not new to American life. In fact, homelessness became a national issue as early as the 1870s. Poverty has fluctuated over time, with the highest national poverty rate recorded in the 195os, at 22%. The lowest rate was documented as recently as 2019, at only 10.5%. In modern America, those most likely to experience poverty are Black Americans (19.5%); individuals residing in homes without men, such as single women (23%); those lacking a high school education (25.2%); and people living in a home where the head of household is out of work (30%).
There is great variety in the level of poverty across the nation. A handful of Eastcoast states, including Connecticut, Massachusetts, New Jersey, and Maryland rank in the top 10 wealthiest states in the country. This is due in part to their proximity to top universities like Harvard and Princeton. Since earning potential is directly linked to education, these findings are not hard to believe. Though the state of California also ranks in the top 10 in terms of wealth, there are still some towns in the Westcoast state that see a high poverty rate.
The effects of poverty extend far beyond economics. According to the latest Pulse Survey from the U.S. Census Bureau, 38% of American adults earning less than $25,000 reported feeling depressed or hopeless on most days, compared to 17% of all adults. Additionally, 27% of adults in the lowest income bracket reported not having enough to eat within the last week, three times the food insufficiency rate among all adults.
In most of the country, including California, the U.S. Department of Health and Human Services sets the poverty line at an annual income of $15,060 for individuals and $31,200 for a family of four. In California, 12.1% of the population live below these thresholds — and in many towns across the state, the poverty rate is far higher.
Using five-year estimates from the Census’ 2022 American Community Survey, 24/7 Wall St. identified the towns in California with the highest poverty rates. We considered all places — including cities, towns, and unincorporated communities — with populations between 5,000 and 50,000. Because the presence of colleges and universities can distort economic realities in a given area, places where 20% or more of the population are enrolled in a post-secondary institution were excluded from analysis.
Among the 35 places on this list, poverty rates range from 23.3% to 46.5%, and in each of these places, the typical household earns less than the statewide median household income of $91,905.
Widespread financial hardship in these areas is partially attributable to a lack of economic opportunity. In most places on this list, the five-year average unemployment rate is higher than the comparable 6.4% jobless rate across California.
Incomes and job security tend to rise with educational attainment. According to the Bureau of Labor Statistics, the typical worker with a bachelor’s degree earns 66% more than those with no more than a high school diploma. Additionally, workers with only a high school education are far more likely to be unemployed than college graduates. In every town on this list, the share of adults with a bachelor’s degree is below the 35.9% statewide bachelor’s degree attainment rate.
Why It Matters

The United States is, in many ways, the center of gravity of the global economy. The U.S. dollar has been the world’s leading reserve currency since the end of World War II, and American gross domestic product accounts for over a quarter of economic activity worldwide. Despite these advantages, more than one in every 10 Americans have been living below the poverty line for decades. For those facing serious financial hardship, the effects are far reaching. Poverty can negatively impact mental health, social relationships, and life expectancy.
35. Oroville

- Poverty rate: 23.3%
- Median household income: $46,362
- 5-yr. avg. unemployment rate: 7.5%
- Adults with a bachelor’s degree or higher: 14.1%
- Population: 20,283
34. Bell
- Poverty rate: 23.4%
- Median household income: $56,685
- 5-yr. avg. unemployment rate: 6.5%
- Adults with a bachelor’s degree or higher: 8.8%
- Population: 33,377
33. West Modesto

- Poverty rate: 23.4%
- Median household income: $55,500
- 5-yr. avg. unemployment rate: 9.7%
- Adults with a bachelor’s degree or higher: 7.1%
- Population: 5,438
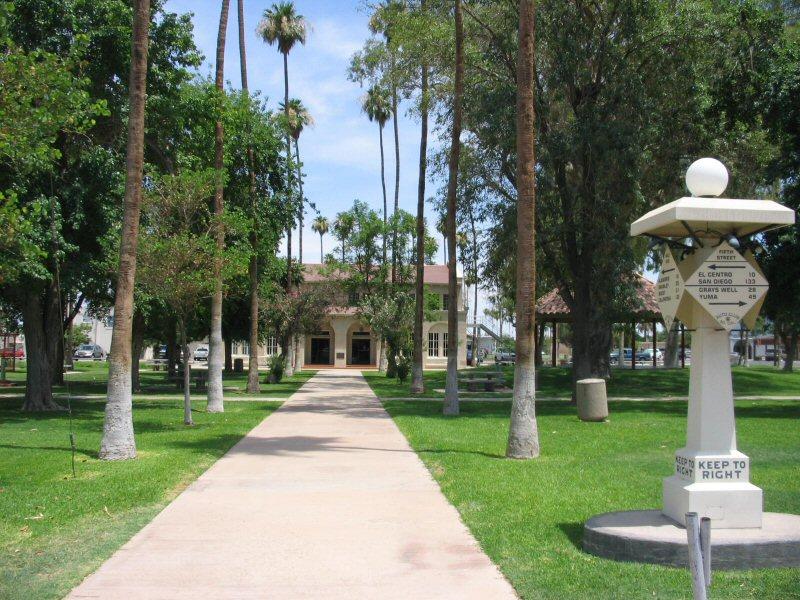
32. Brawley
- Poverty rate: 23.6%
- Median household income: $56,229
- 5-yr. avg. unemployment rate: 18.1%
- Adults with a bachelor’s degree or higher: 15.2%
- Population: 26,509
31. Bell Gardens
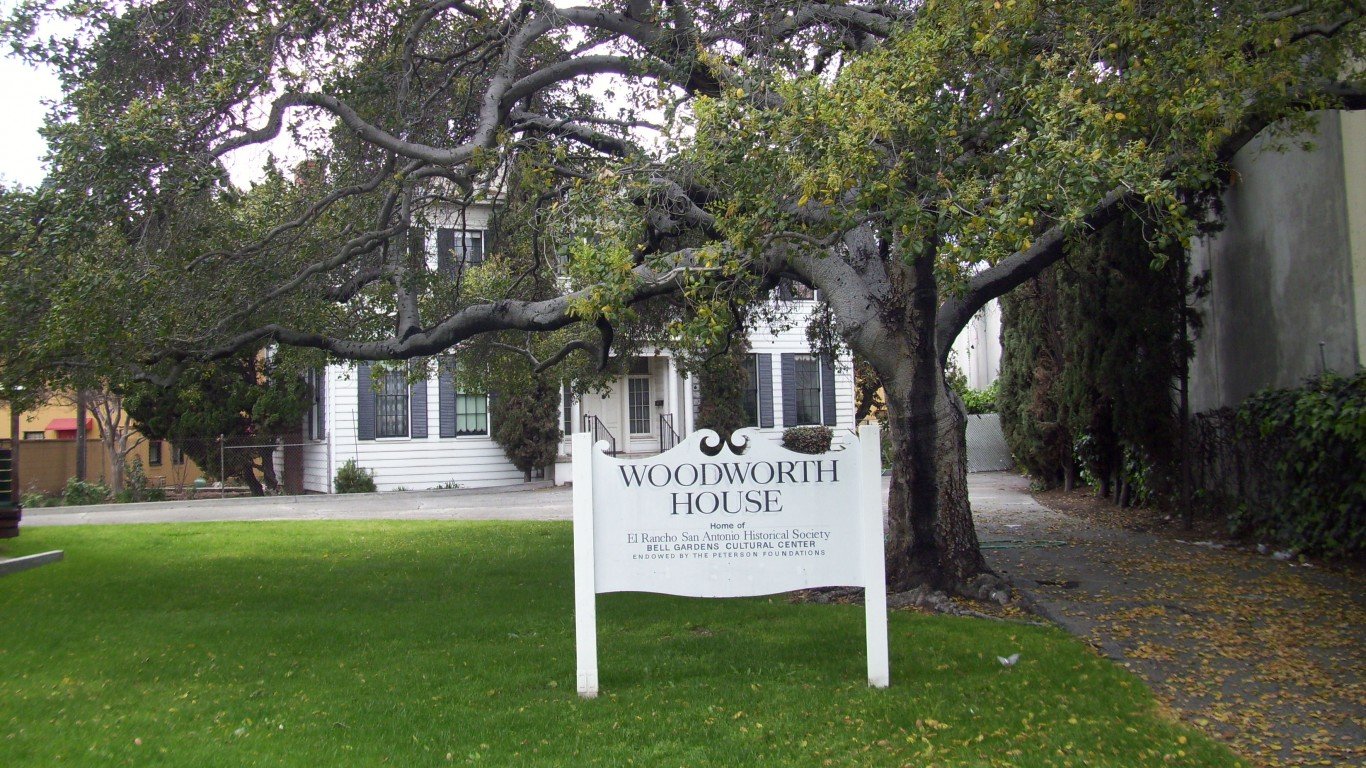
- Poverty rate: 23.6%
- Median household income: $53,935
- 5-yr. avg. unemployment rate: 5.7%
- Adults with a bachelor’s degree or higher: 6.1%
- Population: 39,263
30. Holtville
- Poverty rate: 23.7%
- Median household income: $44,939
- 5-yr. avg. unemployment rate: 11.2%
- Adults with a bachelor’s degree or higher: 11.6%
- Population: 5,620
29. Marysville
- Poverty rate: 24.2%
- Median household income: $52,012
- 5-yr. avg. unemployment rate: 7.5%
- Adults with a bachelor’s degree or higher: 14.7%
- Population: 12,681
28. Potomac Park
- Poverty rate: 24.5%
- Median household income: $51,739
- 5-yr. avg. unemployment rate: 13.7%
- Adults with a bachelor’s degree or higher: 4.2%
- Population: 10,697
27. Woodlake

- Poverty rate: 24.5%
- Median household income: $44,719
- 5-yr. avg. unemployment rate: 9.1%
- Adults with a bachelor’s degree or higher: 11.4%
- Population: 7,495
26. Farmersville

- Poverty rate: 24.6%
- Median household income: $52,714
- 5-yr. avg. unemployment rate: 9.8%
- Adults with a bachelor’s degree or higher: 4.5%
- Population: 10,393
25. Clearlake

- Poverty rate: 24.7%
- Median household income: $41,047
- 5-yr. avg. unemployment rate: 16.7%
- Adults with a bachelor’s degree or higher: 7.8%
- Population: 16,612
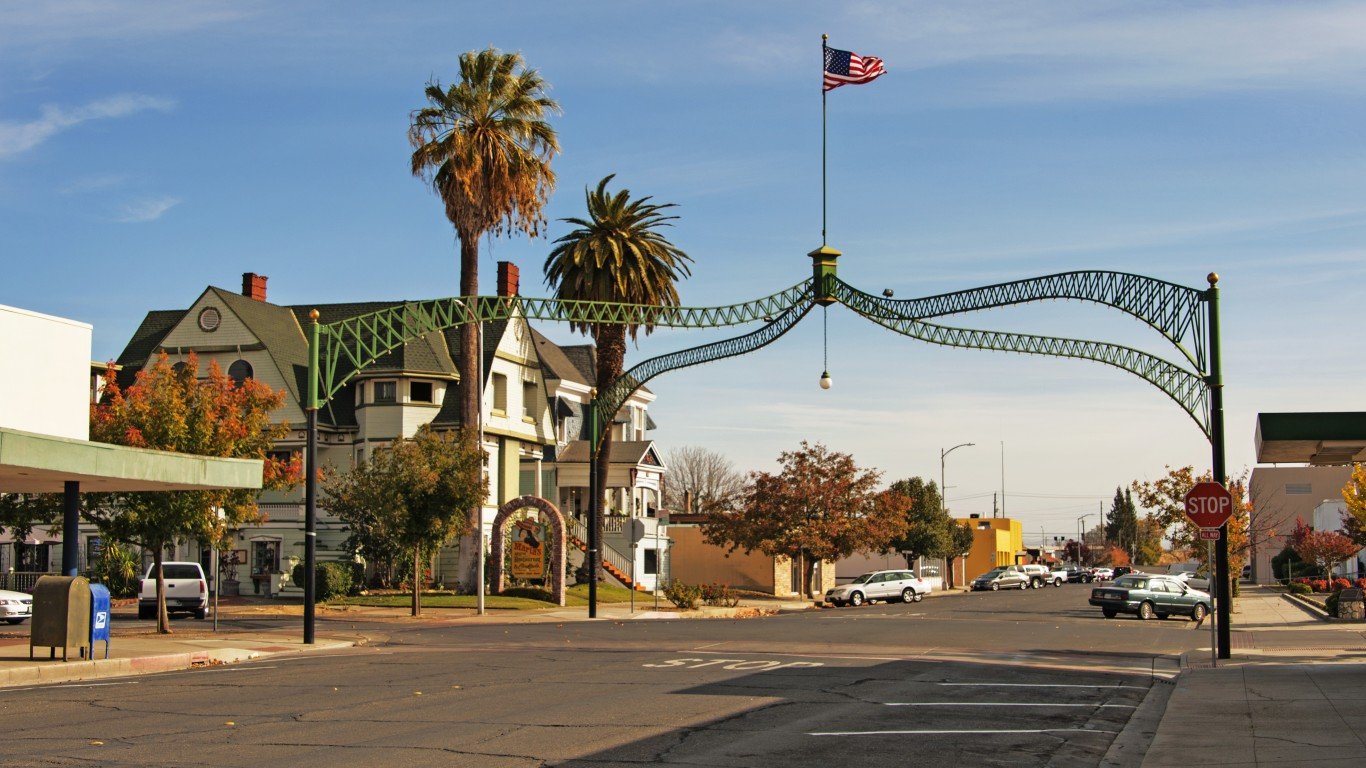
24. Willows
![]()
- Poverty rate: 25.3%
- Median household income: $61,806
- 5-yr. avg. unemployment rate: 9.2%
- Adults with a bachelor’s degree or higher: 16.8%
- Population: 6,201
23. Orosi

- Poverty rate: 25.9%
- Median household income: $52,692
- 5-yr. avg. unemployment rate: 10.6%
- Adults with a bachelor’s degree or higher: 5.7%
- Population: 9,100
22. Cudahy
- Poverty rate: 26.7%
- Median household income: $49,596
- 5-yr. avg. unemployment rate: 9.2%
- Adults with a bachelor’s degree or higher: 5.3%
- Population: 22,657
21. McFarland
- Poverty rate: 26.8%
- Median household income: $42,641
- 5-yr. avg. unemployment rate: 6.4%
- Adults with a bachelor’s degree or higher: 4.0%
- Population: 13,971
20. Parlier
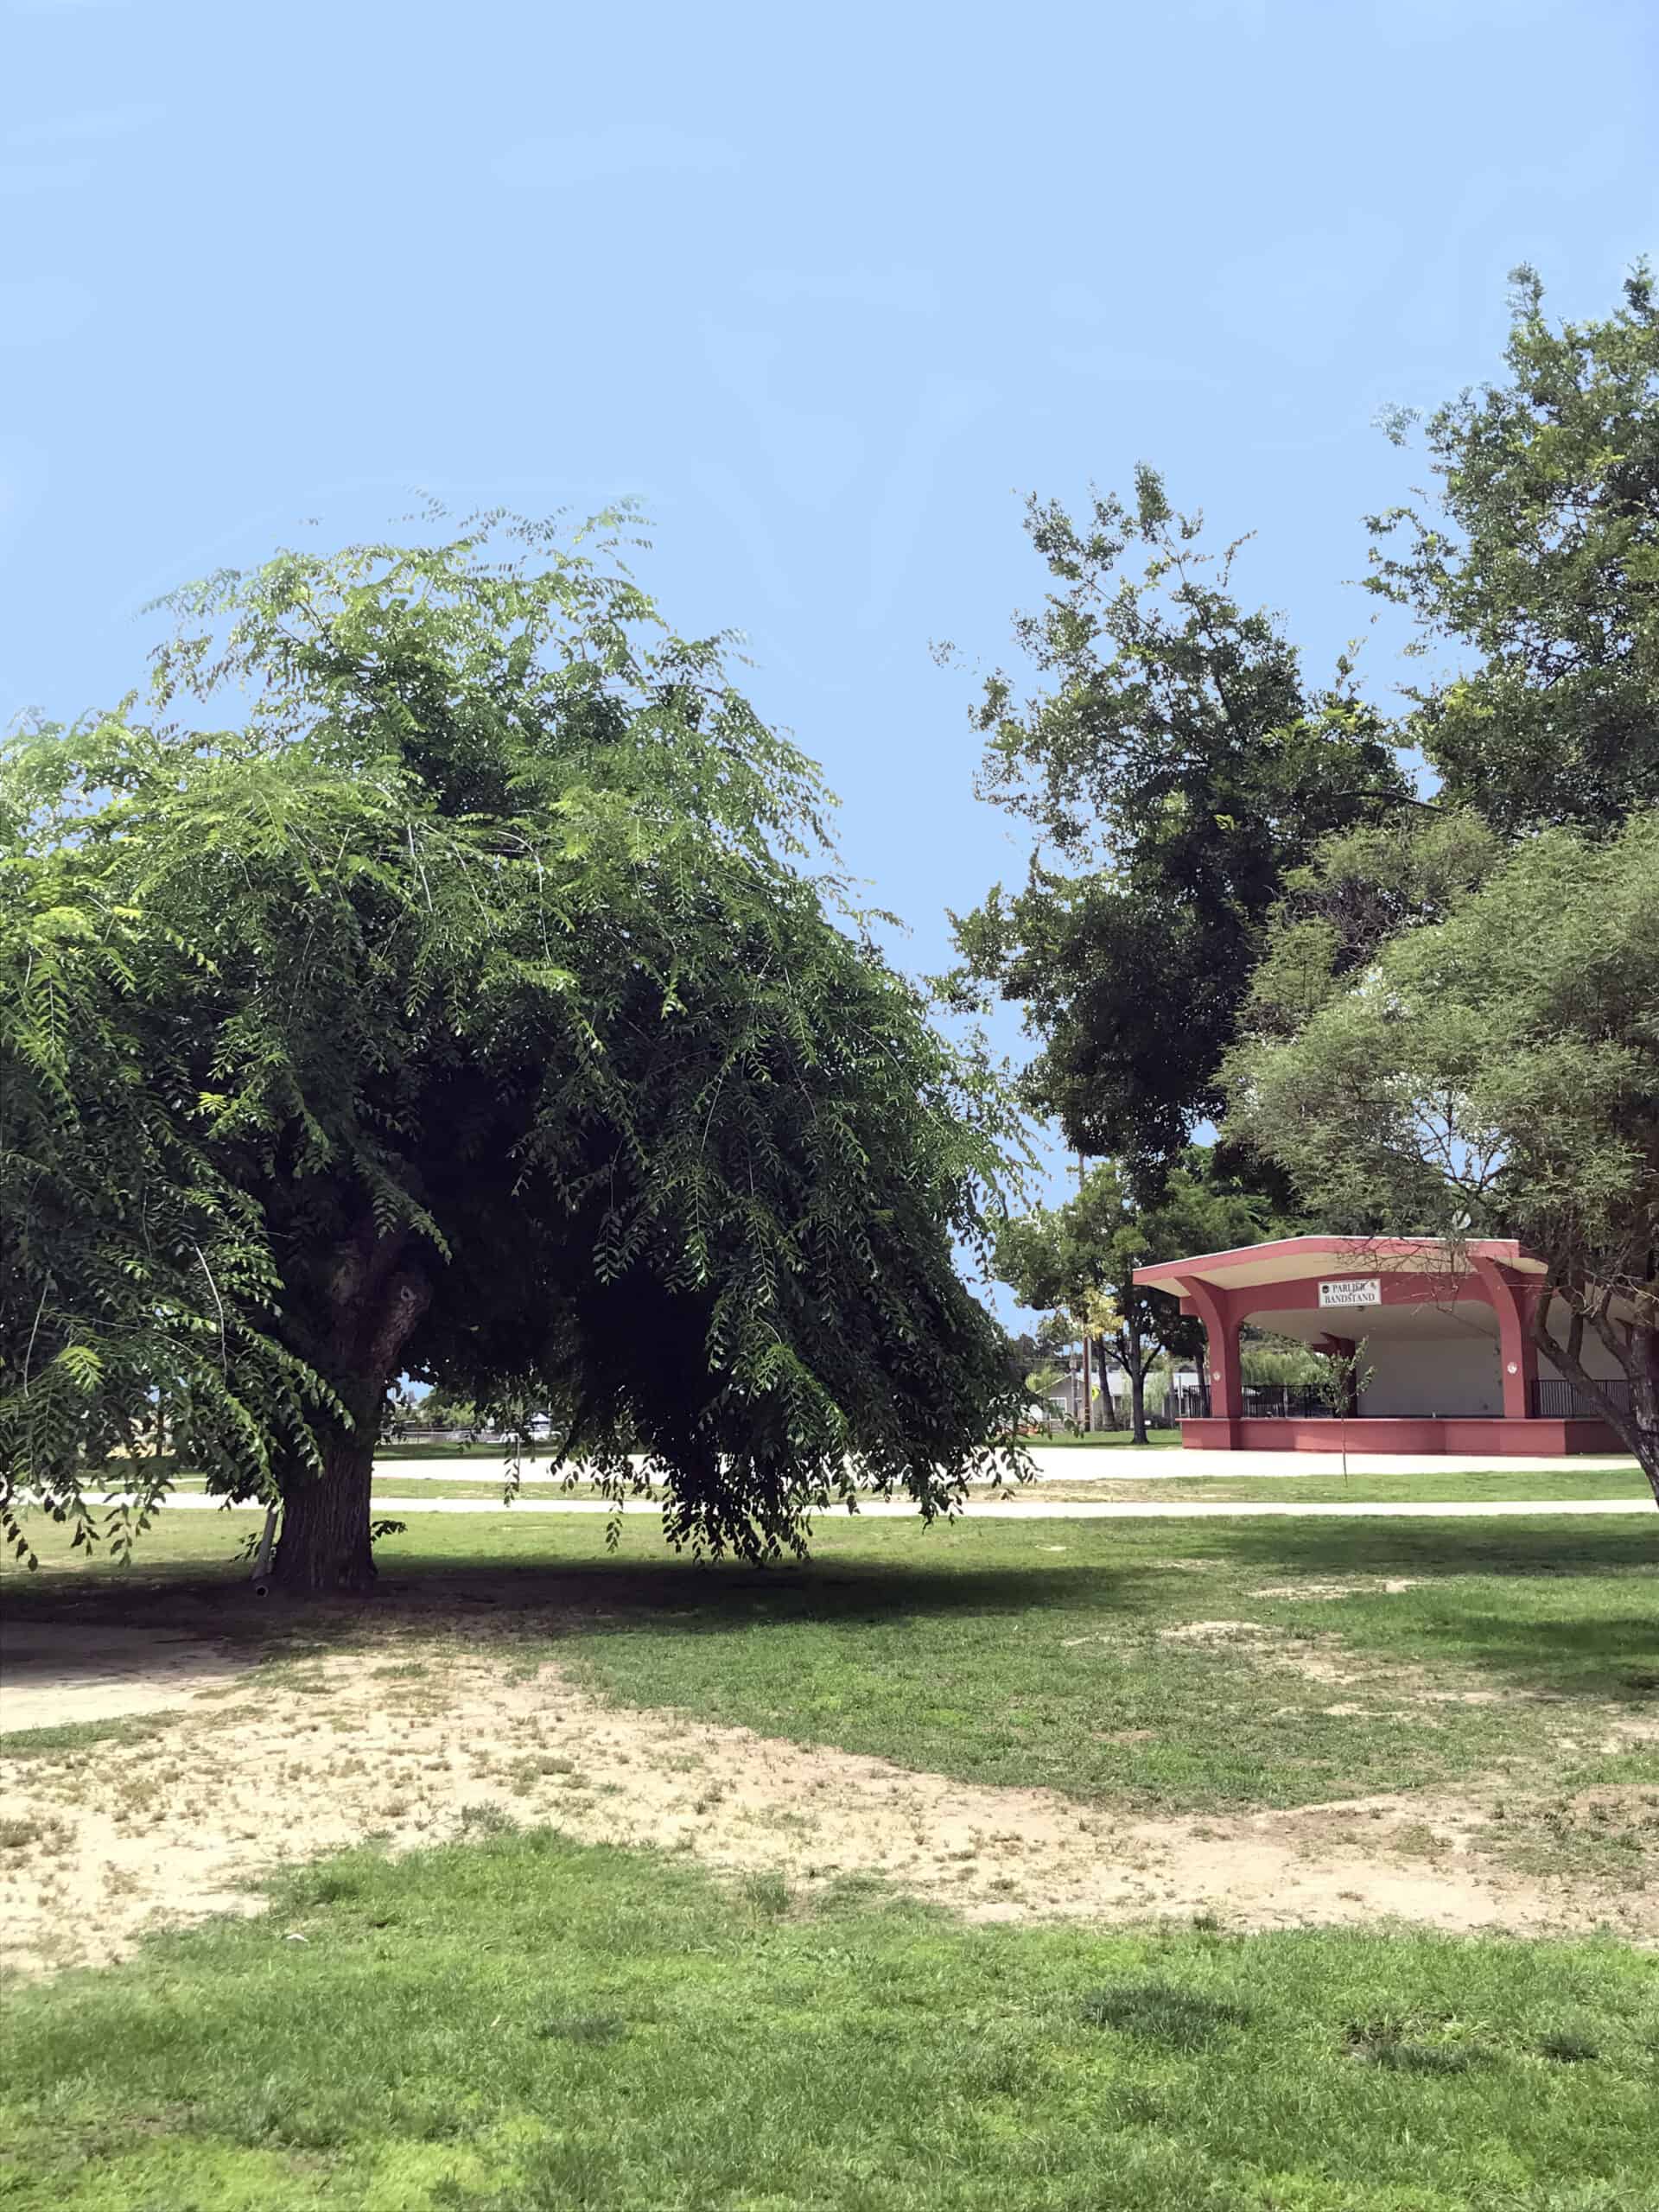
- Poverty rate: 27.4%
- Median household income: $50,026
- 5-yr. avg. unemployment rate: 6.9%
- Adults with a bachelor’s degree or higher: 4.9%
- Population: 14,625
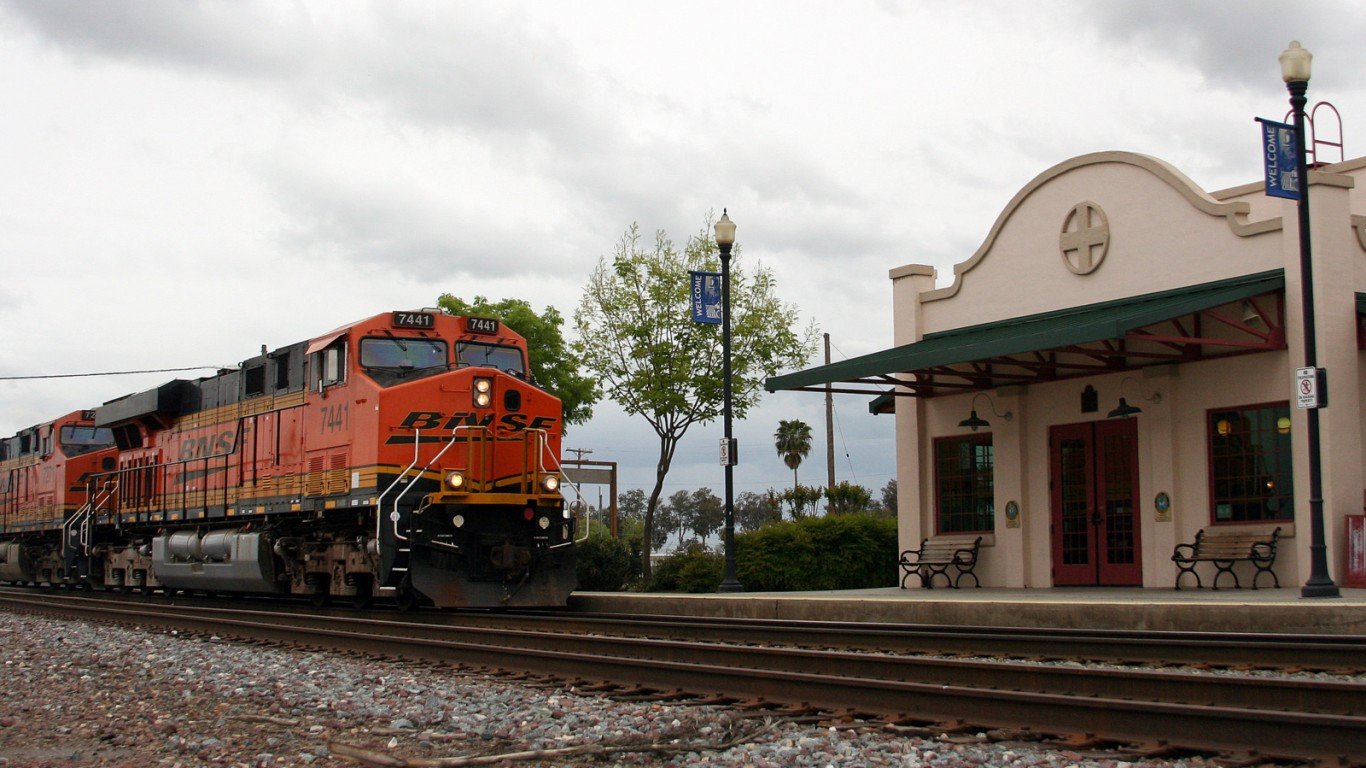
19. Guadalupe
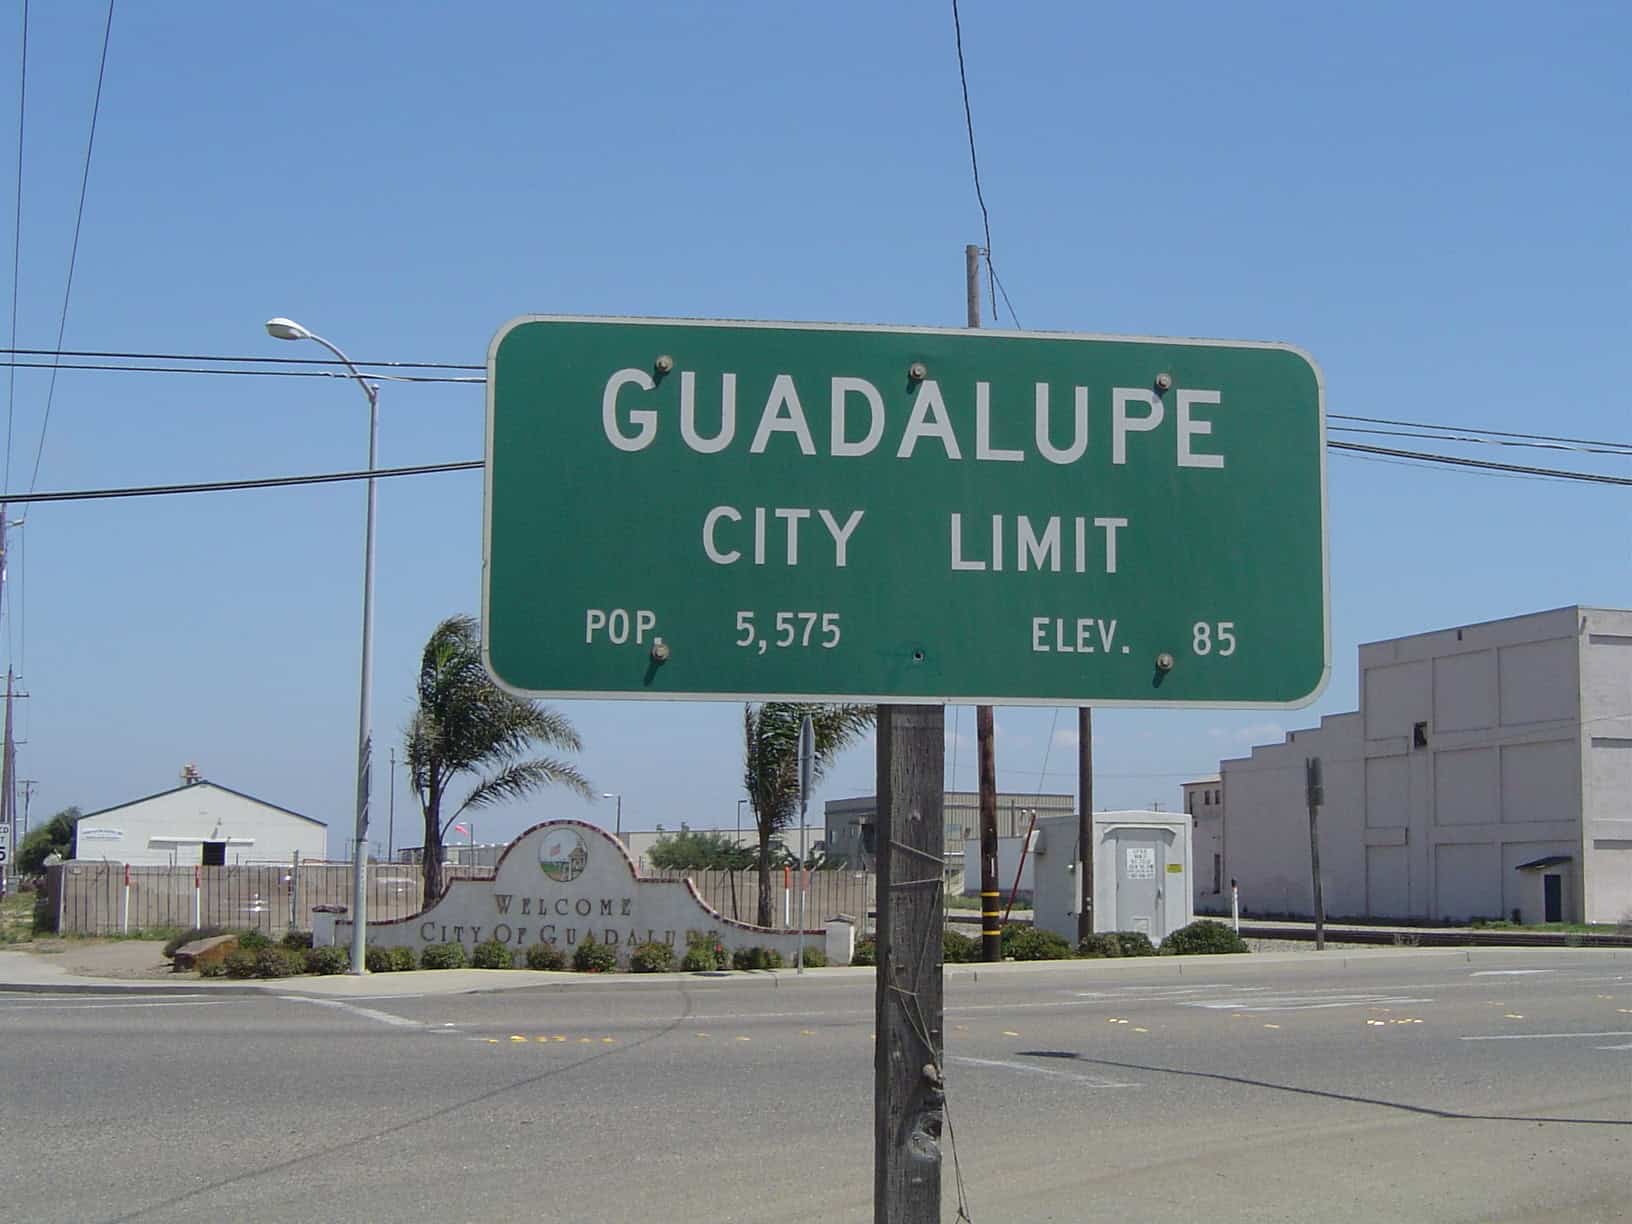
- Poverty rate: 27.6%
- Median household income: $66,026
- 5-yr. avg. unemployment rate: 9.5%
- Adults with a bachelor’s degree or higher: 8.8%
- Population: 8,272
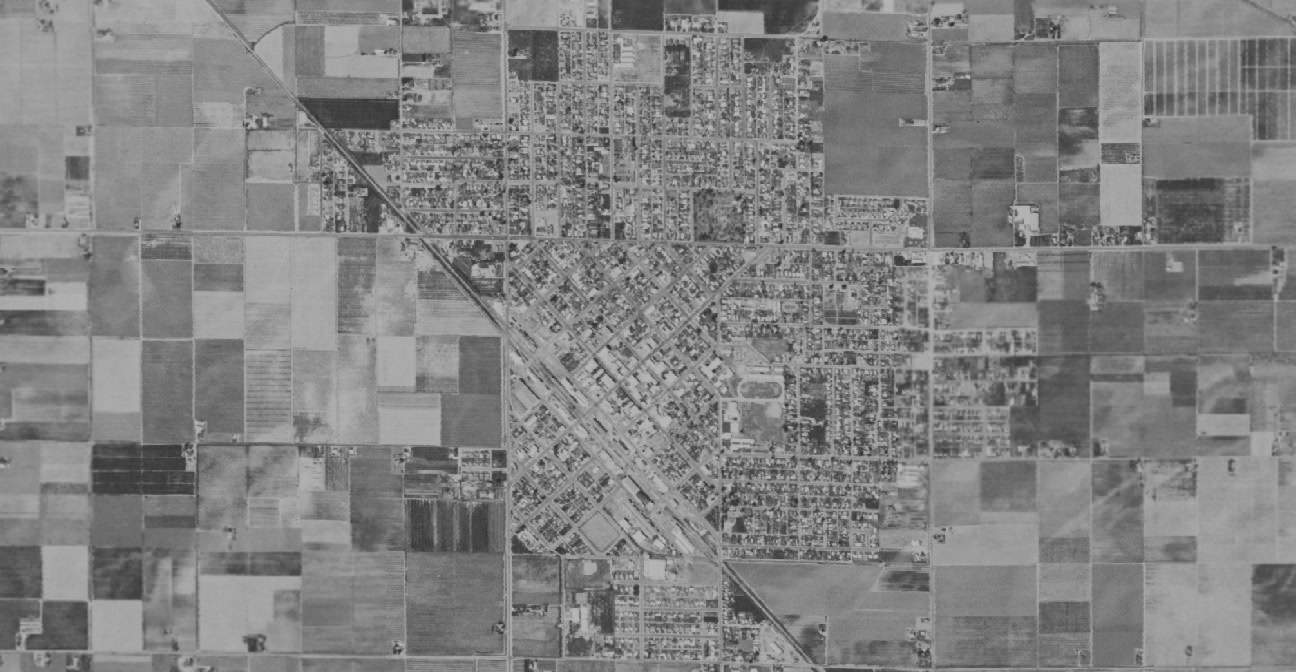
18. Corcoran
- Poverty rate: 27.6%
- Median household income: $53,103
- 5-yr. avg. unemployment rate: 11.2%
- Adults with a bachelor’s degree or higher: 3.9%
- Population: 22,808
17. Keyes

- Poverty rate: 27.7%
- Median household income: $57,710
- 5-yr. avg. unemployment rate: 8.9%
- Adults with a bachelor’s degree or higher: 6.0%
- Population: 5,827
16. Dinuba
- Poverty rate: 27.8%
- Median household income: $54,590
- 5-yr. avg. unemployment rate: 11.0%
- Adults with a bachelor’s degree or higher: 12.3%
- Population: 24,713
15. East Niles
- Poverty rate: 28.3%
- Median household income: $50,668
- 5-yr. avg. unemployment rate: 8.6%
- Adults with a bachelor’s degree or higher: 7.6%
- Population: 29,981
14. Calipatria
- Poverty rate: 28.6%
- Median household income: $43,095
- 5-yr. avg. unemployment rate: 14.5%
- Adults with a bachelor’s degree or higher: 1.4%
- Population: 6,579
13. Arvin

- Poverty rate: 28.7%
- Median household income: $47,997
- 5-yr. avg. unemployment rate: 11.1%
- Adults with a bachelor’s degree or higher: 3.9%
- Population: 19,613
12. Oildale
- Poverty rate: 29.1%
- Median household income: $45,976
- 5-yr. avg. unemployment rate: 11.4%
- Adults with a bachelor’s degree or higher: 11.4%
- Population: 34,796
11. Lemon Hill
- Poverty rate: 29.3%
- Median household income: $47,080
- 5-yr. avg. unemployment rate: 9.0%
- Adults with a bachelor’s degree or higher: 8.5%
- Population: 14,824
10. Huron
- Poverty rate: 32.1%
- Median household income: $43,664
- 5-yr. avg. unemployment rate: 12.4%
- Adults with a bachelor’s degree or higher: 2.9%
- Population: 6,260
9. Lamont
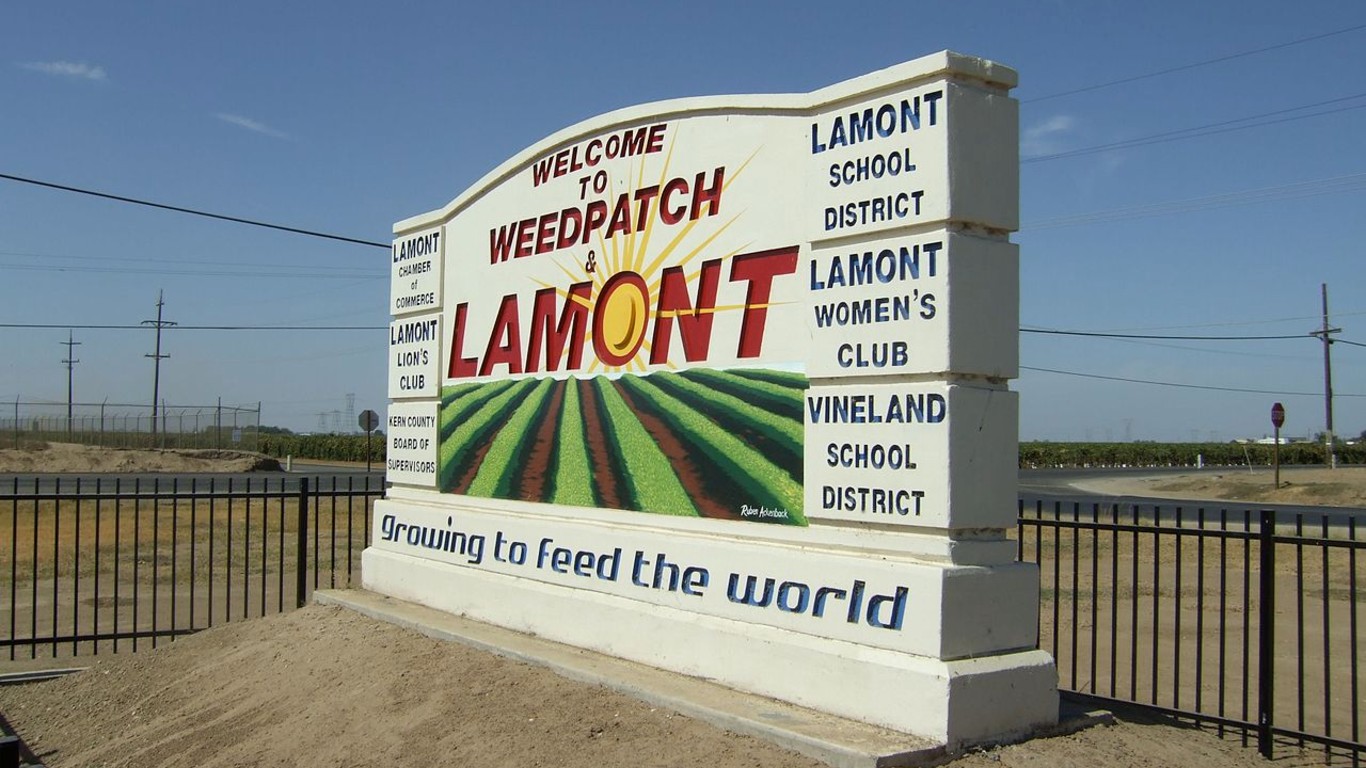
- Poverty rate: 32.4%
- Median household income: $37,164
- 5-yr. avg. unemployment rate: 9.5%
- Adults with a bachelor’s degree or higher: 2.7%
- Population: 13,715
8. Lucerne Valley

- Poverty rate: 32.4%
- Median household income: $45,444
- 5-yr. avg. unemployment rate: 21.7%
- Adults with a bachelor’s degree or higher: 16.3%
- Population: 6,212
7. Mendota
- Poverty rate: 32.7%
- Median household income: $43,315
- 5-yr. avg. unemployment rate: 11.4%
- Adults with a bachelor’s degree or higher: 3.6%
- Population: 12,603
6. Fruitridge Pocket
- Poverty rate: 33.1%
- Median household income: $47,604
- 5-yr. avg. unemployment rate: 6.4%
- Adults with a bachelor’s degree or higher: 18.6%
- Population: 5,596
5. Lindsay
- Poverty rate: 33.9%
- Median household income: $44,816
- 5-yr. avg. unemployment rate: 17.1%
- Adults with a bachelor’s degree or higher: 4.7%
- Population: 12,581
4. East Porterville
- Poverty rate: 41.8%
- Median household income: $31,816
- 5-yr. avg. unemployment rate: 25.4%
- Adults with a bachelor’s degree or higher: 2.1%
- Population: 5,424
3. Firebaugh

- Poverty rate: 43.3%
- Median household income: $36,078
- 5-yr. avg. unemployment rate: 18.3%
- Adults with a bachelor’s degree or higher: 3.9%
- Population: 8,139
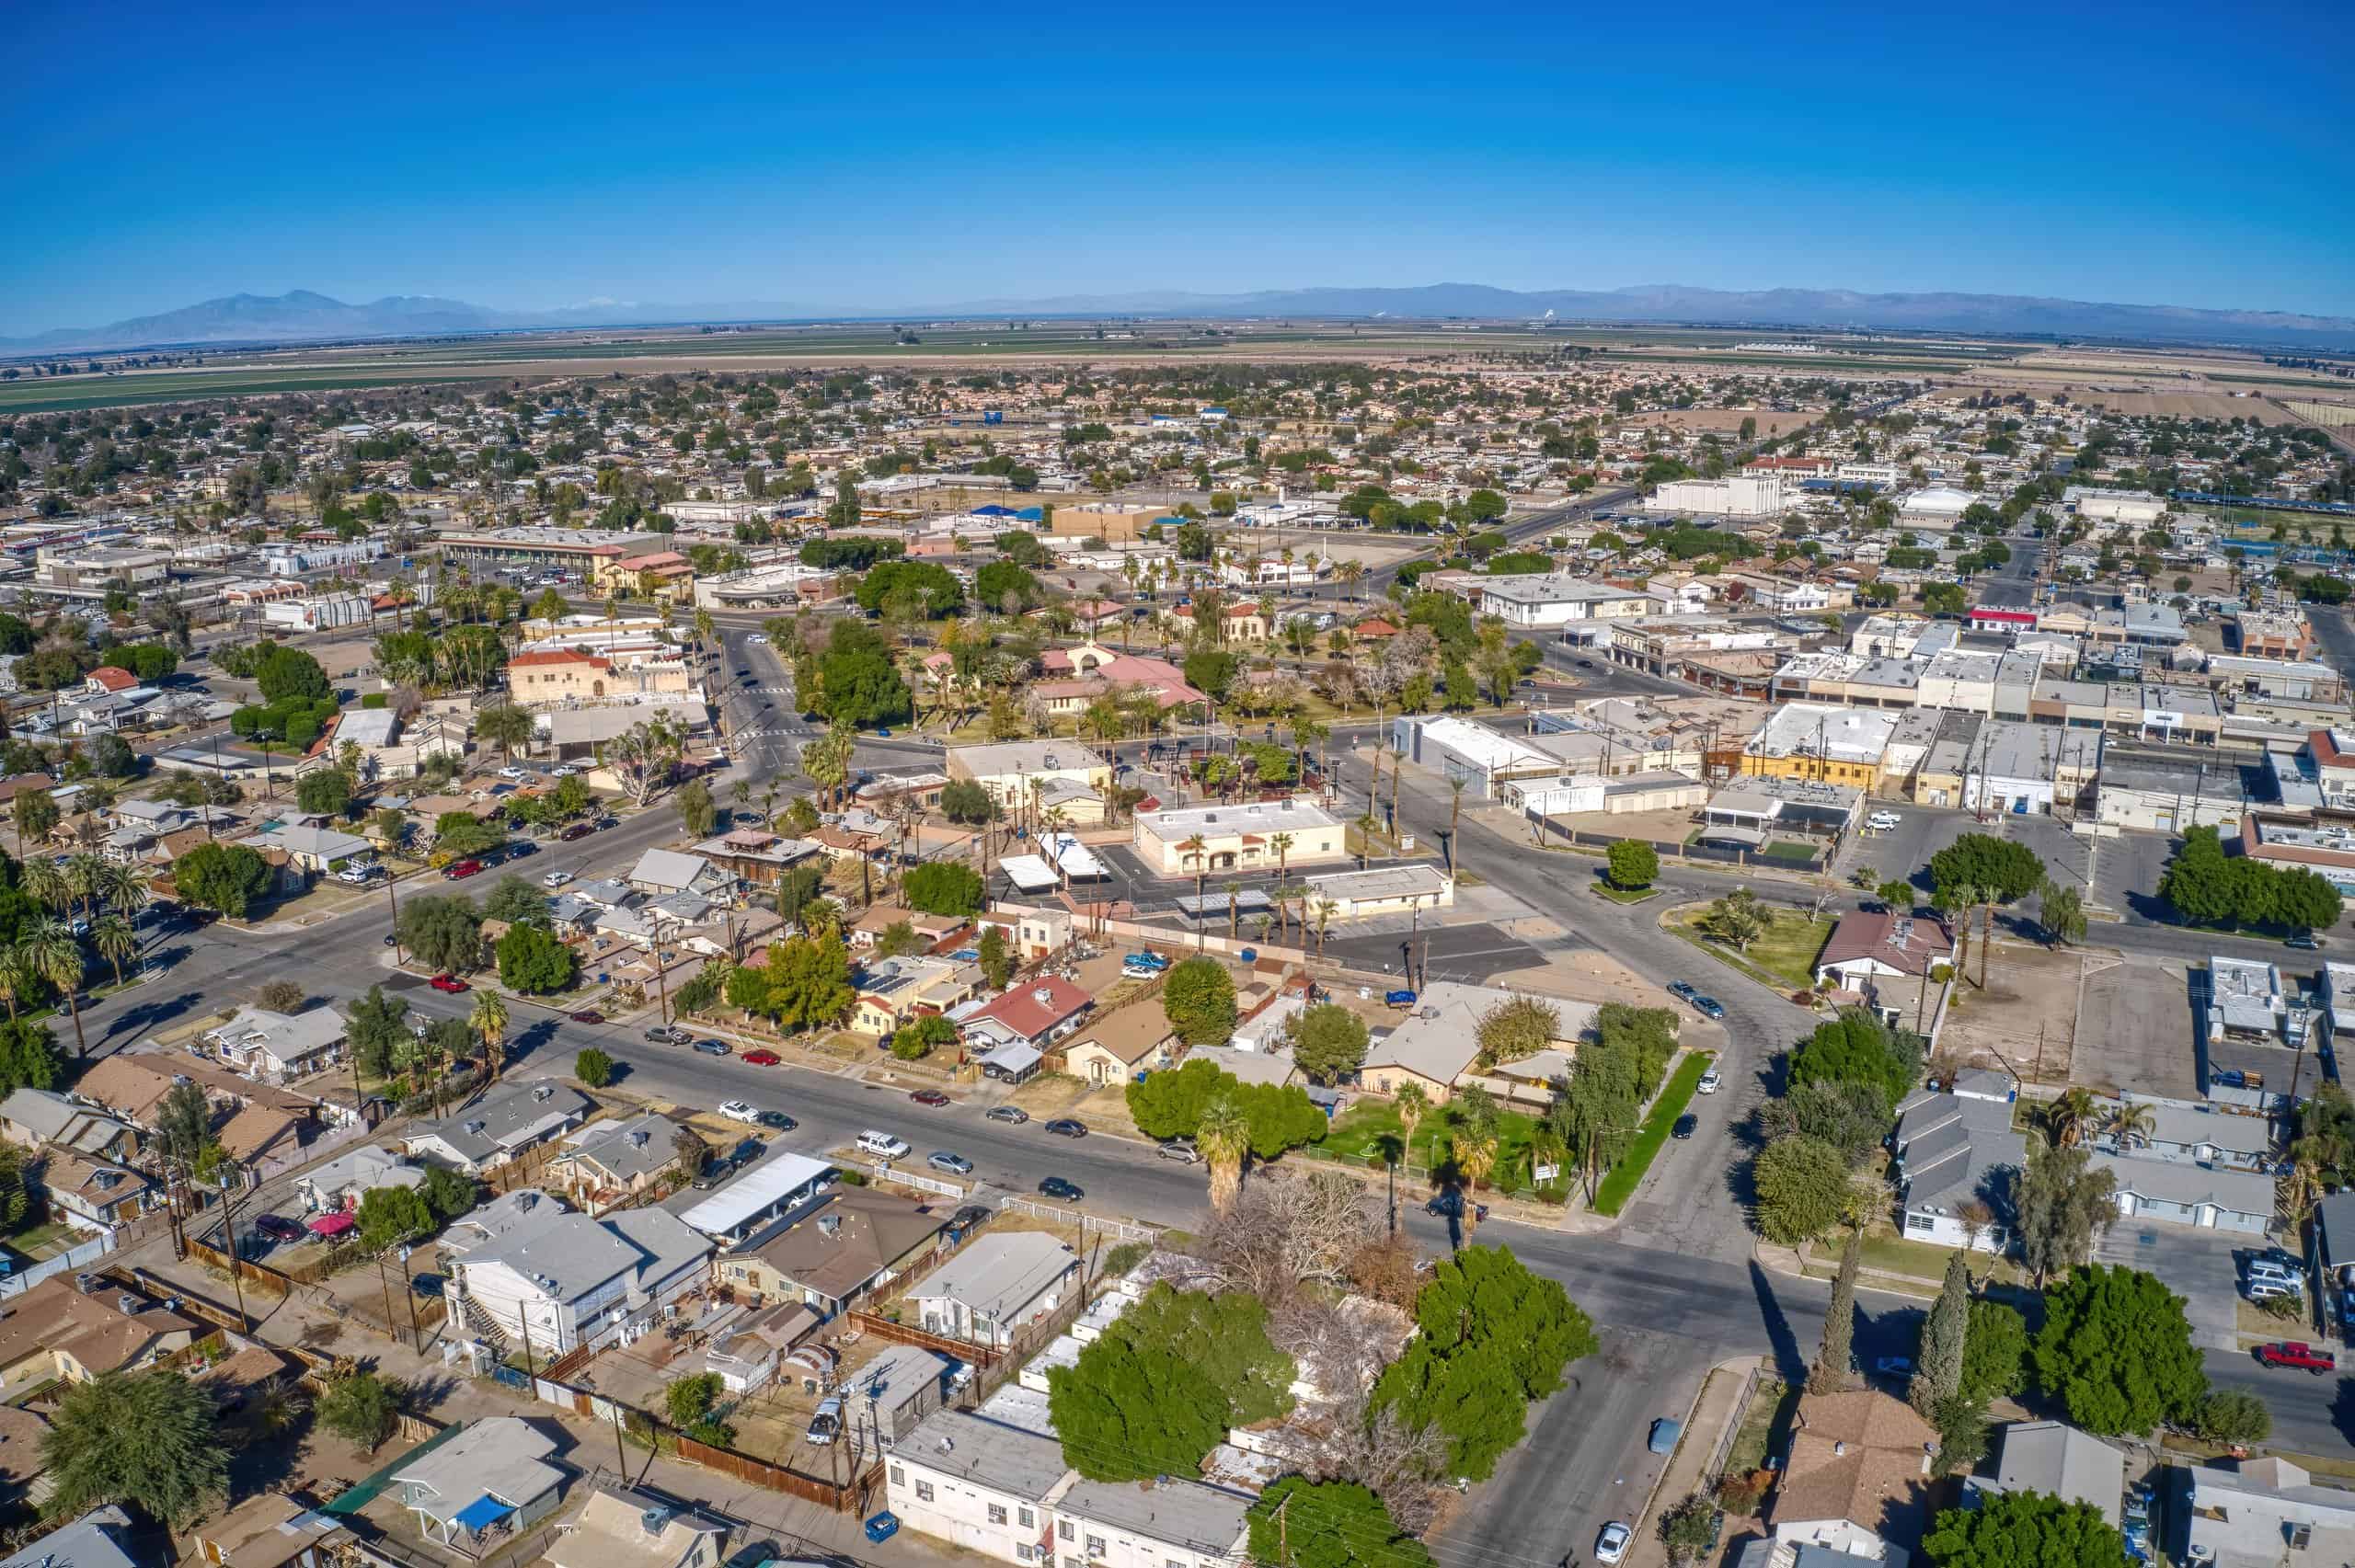
2. East Bakersfield
- Poverty rate: 45.6%
- Median household income: $31,323
- 5-yr. avg. unemployment rate: 13.8%
- Adults with a bachelor’s degree or higher: 2.4%
- Population: 10,754
1. Orange Cove
- Poverty rate: 46.5%
- Median household income: $33,671
- 5-yr. avg. unemployment rate: 13.7%
- Adults with a bachelor’s degree or higher: 6.7%
- Population: 9,635
| Rank | Place | Poverty rate (%) | Median household income ($) | Unemployment rate (%) | Adults with a bachelor’s degree or higher (%) | Total population |
|---|---|---|---|---|---|---|
| 1 | Orange Cove, California | 46.5 | 33,671 | 13.7 | 6.7 | 9,635 |
| 2 | East Bakersfield, California | 45.6 | 31,323 | 13.8 | 2.4 | 10,754 |
| 3 | Firebaugh, California | 43.3 | 36,078 | 18.3 | 3.9 | 8,139 |
| 4 | East Porterville, California | 41.8 | 31,816 | 25.4 | 2.1 | 5,424 |
| 5 | Lindsay, California | 33.9 | 44,816 | 17.1 | 4.7 | 12,581 |
| 6 | Fruitridge Pocket, California | 33.1 | 47,604 | 6.4 | 18.6 | 5,596 |
| 7 | Mendota, California | 32.7 | 43,315 | 11.4 | 3.6 | 12,603 |
| 8 | Lucerne Valley, California | 32.4 | 45,444 | 21.7 | 16.3 | 6,212 |
| 9 | Lamont, California | 32.4 | 37,164 | 9.5 | 2.7 | 13,715 |
| 10 | Huron, California | 32.1 | 43,664 | 12.4 | 2.9 | 6,260 |
| 11 | Lemon Hill, California | 29.3 | 47,080 | 9.0 | 8.5 | 14,824 |
| 12 | Oildale, California | 29.1 | 45,976 | 11.4 | 11.4 | 34,796 |
| 13 | Arvin, California | 28.7 | 47,997 | 11.1 | 3.9 | 19,613 |
| 14 | Calipatria, California | 28.6 | 43,095 | 14.5 | 1.4 | 6,579 |
| 15 | East Niles, California | 28.3 | 50,668 | 8.6 | 7.6 | 29,981 |
| 16 | Dinuba, California | 27.8 | 54,590 | 11.0 | 12.3 | 24,713 |
| 17 | Keyes, California | 27.7 | 57,710 | 8.9 | 6.0 | 5,827 |
| 18 | Corcoran, California | 27.6 | 53,103 | 11.2 | 3.9 | 22,808 |
| 19 | Guadalupe, California | 27.6 | 66,026 | 9.5 | 8.8 | 8,272 |
| 20 | Parlier, California | 27.4 | 50,026 | 6.9 | 4.9 | 14,625 |
| 21 | McFarland, California | 26.8 | 42,641 | 6.4 | 4.0 | 13,971 |
| 22 | Cudahy, California | 26.7 | 49,596 | 9.2 | 5.3 | 22,657 |
| 23 | Orosi, California | 25.9 | 52,692 | 10.6 | 5.7 | 9,100 |
| 24 | Willows, California | 25.3 | 61,806 | 9.2 | 16.8 | 6,201 |
| 25 | Clearlake, California | 24.7 | 41,047 | 16.7 | 7.8 | 16,612 |
| 26 | Farmersville, California | 24.6 | 52,714 | 9.8 | 4.5 | 10,393 |
| 27 | Woodlake, California | 24.5 | 44,719 | 9.1 | 11.4 | 7,495 |
| 28 | Potomac Park, California | 24.5 | 51,739 | 13.7 | 4.2 | 10,697 |
| 29 | Marysville, California | 24.2 | 52,012 | 7.5 | 14.7 | 12,681 |
| 30 | Holtville, California | 23.7 | 44,939 | 11.2 | 11.6 | 5,620 |
| 31 | Bell Gardens, California | 23.6 | 53,935 | 5.7 | 6.1 | 39,263 |
| 32 | Brawley, California | 23.6 | 56,229 | 18.1 | 15.2 | 26,509 |
| 33 | West Modesto, California | 23.4 | 55,500 | 9.7 | 7.1 | 5,438 |
| 34 | Bell, California | 23.4 | 56,685 | 6.5 | 8.8 | 33,377 |
| 35 | Oroville, California | 23.3 | 46,362 | 7.5 | 14.1 | 20,283 |
Take This Retirement Quiz To Get Matched With An Advisor Now (Sponsored)
Are you ready for retirement? Planning for retirement can be overwhelming, that’s why it could be a good idea to speak to a fiduciary financial advisor about your goals today.
Start by taking this retirement quiz right here from SmartAsset that will match you with up to 3 financial advisors that serve your area and beyond in 5 minutes. Smart Asset is now matching over 50,000 people a month.
Click here now to get started.
The post Prime Examples of California Policies Destroying Towns appeared first on 24/7 Wall St..