24/7 Wall St. Insights
- 24/7 Wall St. identified the 50 best school districts in America by reviewing data from Niche.
- In each of the top 50 school districts, graduation rates exceed 90%, and over half have graduation rates above 95%.
- With only one exception, each of these school districts spends more annually on a per-pupil basis than the national average of $12,239.
- Also: 2 Dividend Legends to Hold Forever
American public schools are funded through a combination of federal, state, and local taxes. One hundred years ago, school funding mainly came from local government, while today state and local government are both responsible for funding schools with the federal government bringing in about 10%. Because funding is a mainly state and local affair for schools, there is quite a disparity in resources among public schools across the nation. States can divide school districts in a manner that helps secure funding for all students, including those in lower socioeconomic families. However, in some states, disadvantaged neighborhoods struggle to obtain adequate school resources. On the other hand, wealthy areas may have excellent school districts with abundant resources for students.
Using data compiled by Niche, an education and community research platform, 24/7 Wall St. identified the 50 best school districts in America. Niche ranked schools based on a weighted index of multiple measures, including standardized test results, graduation rates, student-teacher ratios, extracurricular clubs and sports teams, and parent and student surveys. A full description of each measure and its weighting is available here.
Teachers are critical in providing students with a quality education, however, many teacher positions are left unfilled. Unfortunately, 79% of public schools with open positions reported hiring difficulties in August of 2023 (per the Department of Education.) Most recently, test scores have fallen in students. For example, the share of eighth graders who are proficient in core subjects has fallen is only 26% in math and 31% in reading, according to government data.
In response to this, Americans have less confidence in the education system than ever before in history. A 2023 Gallup poll revealed less than a quarter of Americans (23%) expressed a high level of confidence in public schools. In 1975, confidence was at a record high of 62%, and just a few years ago in 2020, it was at 41%.
Despite the many challenges, some school districts have managed to avoid serious issues plaguing America’s public education system. Funding plays a big part — these districts tend to be well-funded and well-regarded by parents and students. Graduation rates are typically higher in these schools and students tend to be proficient in core subjects with above-average standardized test scores. In each district on the following list with available data, graduation rates exceed 90%, and over half have graduation rates above 95%. (Here is a look at America’s 50 best public high schools.)
The majority of school districts that made the list are in the Midwest and Northeast. These include 13 districts in Illinois and nine in New York state. Most are also located near major cities, like Boston, Chicago, New York, and Philadelphia. With only one exception, each of these school districts spends more annually on a per-pupil basis than the national average of $12,239, as reported by Niche. (Here is a look at the best places to teach in America.)
Why We’re Covering This

Public education prepares children for entering college or going into the workforce. A high-quality education for residents improves a country’s business and economic growth. By looking at the top school districts in America, 24/7 Wall St. has identified exactly where in the country children are receiving the best education.
Here are the 50 best school districts in America:
50. West Windsor-Plainsboro Regional School District

- Location: West Windsor, NJ
- Student-teacher ratio: 13:1
- Avg. graduation rate: 98%
- Students proficient in core subjects: 71% in reading; 57% in math
- Avg. standardized test scores: 32 out of 36 in ACTs; 1390 out of 1600 in SATs
- Annual district spending: $23,136 per pupil
- Total enrollment: 9,109
49. Millburn Township School District

- Location: Millburn, NJ
- Student-teacher ratio: 13:1
- Avg. graduation rate: 98%
- Students proficient in core subjects: 79% in reading; 68% in math
- Avg. standardized test scores: 31 out of 36 in ACTs; 1400 out of 1600 in SATs
- Annual district spending: $23,337 per pupil
- Total enrollment: 4,796
48. New Canaan Public Schools

- Location: New Canaan, CT
- Student-teacher ratio: 13:1
- Avg. graduation rate: 97%
- Students proficient in core subjects: 86% in reading; 81% in math
- Avg. standardized test scores: 31 out of 36 in ACTs; 1330 out of 1600 in SATs
- Annual district spending: $26,238 per pupil
- Total enrollment: 4,175
47. South Central School District

- Location: Bonesteel, SD
- Student-teacher ratio: 11:1
- Avg. graduation rate: 0%
- Students proficient in core subjects: 44.5% in reading; 34.5% in math
- Avg. standardized test scores: out of 36 in ACTs; out of 1600 in SATs
- Annual district spending: $21,747 per pupil
- Total enrollment: 75
46. Wayzata Public Schools

- Location: Plymouth, MN
- Student-teacher ratio: 18:1
- Avg. graduation rate: 97%
- Students proficient in core subjects: 78% in reading; 75% in math
- Avg. standardized test scores: 30 out of 36 in ACTs; 1400 out of 1600 in SATs
- Annual district spending: $20,282 per pupil
- Total enrollment: 12,018
45. Mariemont City Schools

- Location: Cincinnati, OH
- Student-teacher ratio: 16:1
- Avg. graduation rate: 95%
- Students proficient in core subjects: 92% in reading; 89% in math
- Avg. standardized test scores: 29 out of 36 in ACTs; 1280 out of 1600 in SATs
- Annual district spending: $33,003 per pupil
- Total enrollment: 1,566
44. Lower Merion School District
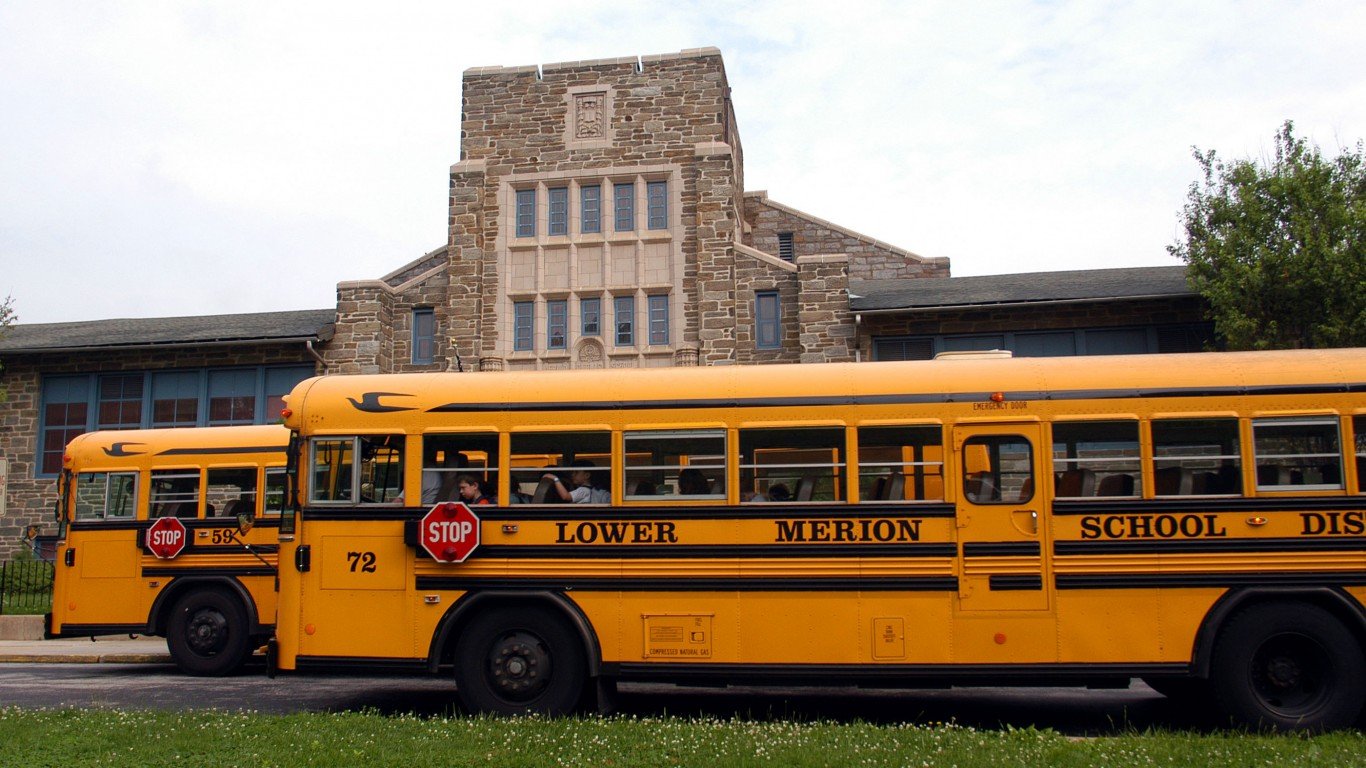
- Location: Ardmore, PA
- Student-teacher ratio: 12:1
- Avg. graduation rate: 96%
- Students proficient in core subjects: 84% in reading; 74% in math
- Avg. standardized test scores: 30 out of 36 in ACTs; 1330 out of 1600 in SATs
- Annual district spending: $33,650 per pupil
- Total enrollment: 8,531
43. Princeton Public Schools

- Location: Princeton, NJ
- Student-teacher ratio: 11:1
- Avg. graduation rate: 94%
- Students proficient in core subjects: 72% in reading; 49% in math
- Avg. standardized test scores: 31 out of 36 in ACTs; 1360 out of 1600 in SATs
- Annual district spending: $30,734 per pupil
- Total enrollment: 3,759
42. Elmbrook School District

- Location: Brookfield, WI
- Student-teacher ratio: 15:1
- Avg. graduation rate: 98%
- Students proficient in core subjects: 60% in reading; 61% in math
- Avg. standardized test scores: 29 out of 36 in ACTs; 1380 out of 1600 in SATs
- Annual district spending: $14,303 per pupil
- Total enrollment: 7,727
41. Indian Prairie Community Unit School District No. 204

- Location: Aurora, IL
- Student-teacher ratio: 14:1
- Avg. graduation rate: 96%
- Students proficient in core subjects: 47% in reading; 47% in math
- Avg. standardized test scores: 29 out of 36 in ACTs; 1310 out of 1600 in SATs
- Annual district spending: $17,104 per pupil
- Total enrollment: 25,815
40. East Williston Union Free School District

- Location: Old Westbury, NY
- Student-teacher ratio: 9:1
- Avg. graduation rate: 95%
- Students proficient in core subjects: 82% in reading; 90% in math
- Avg. standardized test scores: 30 out of 36 in ACTs; 1340 out of 1600 in SATs
- Annual district spending: $36,190 per pupil
- Total enrollment: 1,644
39. Northern Utah Academy for Math Engineering & Science (Nuames)

- Location: Layton, UT
- Student-teacher ratio: 23:1
- Avg. graduation rate: 99%
- Students proficient in core subjects: 74% in reading; 58% in math
- Avg. standardized test scores: 27 out of 36 in ACTs; 1300 out of 1600 in SATs
- Annual district spending: $8,130 per pupil
- Total enrollment: 1,134
38. Arcadia Unified School District

- Location: Arcadia, CA
- Student-teacher ratio: 23:1
- Avg. graduation rate: 97%
- Students proficient in core subjects: 69% in reading; 67% in math
- Avg. standardized test scores: 31 out of 36 in ACTs; 1370 out of 1600 in SATs
- Annual district spending: $15,070 per pupil
- Total enrollment: 8,669
37. Township High School District No. 214

- Location: Arlington Heights, IL
- Student-teacher ratio: 16:1
- Avg. graduation rate: 93%
- Students proficient in core subjects: 45% in reading; 42% in math
- Avg. standardized test scores: 28 out of 36 in ACTs; 1230 out of 1600 in SATs
- Annual district spending: $25,173 per pupil
- Total enrollment: 12,073
36. Barrington Community Unit School District No. 220

- Location: Barrington, IL
- Student-teacher ratio: 13:1
- Avg. graduation rate: 97%
- Students proficient in core subjects: 49% in reading; 46% in math
- Avg. standardized test scores: 30 out of 36 in ACTs; 1310 out of 1600 in SATs
- Annual district spending: $24,438 per pupil
- Total enrollment: 8,161
35. Novi Community School District

- Location: Novi, MI
- Student-teacher ratio: 17:1
- Avg. graduation rate: 93%
- Students proficient in core subjects: 72% in reading; 73% in math
- Avg. standardized test scores: 31 out of 36 in ACTs; 1350 out of 1600 in SATs
- Annual district spending: $13,953 per pupil
- Total enrollment: 6,612
34. Northern Valley Regional High School District

- Location: Demarest, NJ
- Student-teacher ratio: 10:1
- Avg. graduation rate: 98%
- Students proficient in core subjects: 71% in reading; 58% in math
- Avg. standardized test scores: 30 out of 36 in ACTs; 1330 out of 1600 in SATs
- Annual district spending: $47,184 per pupil
- Total enrollment: 2,076
33. Indian Hill Exempted Village School District

- Location: Cincinnati, OH
- Student-teacher ratio: 14:1
- Avg. graduation rate: 95%
- Students proficient in core subjects: 88% in reading; 84% in math
- Avg. standardized test scores: 31 out of 36 in ACTs; 1360 out of 1600 in SATs
- Annual district spending: $20,790 per pupil
- Total enrollment: 2,131
32. Naperville Community Unit School District No. 203

- Location: Naperville, IL
- Student-teacher ratio: 14:1
- Avg. graduation rate: 98%
- Students proficient in core subjects: 58% in reading; 51% in math
- Avg. standardized test scores: 29 out of 36 in ACTs; 1310 out of 1600 in SATs
- Annual district spending: $20,473 per pupil
- Total enrollment: 16,245
31. Weston Public Schools

- Location: Weston, MA
- Student-teacher ratio: 12:1
- Avg. graduation rate: 95%
- Students proficient in core subjects: 77% in reading; 71% in math
- Avg. standardized test scores: 31 out of 36 in ACTs; 1340 out of 1600 in SATs
- Annual district spending: $34,908 per pupil
- Total enrollment: 1,948
30. Hopkinton Public Schools

- Location: Hopkinton, MA
- Student-teacher ratio: 14:1
- Avg. graduation rate: 99%
- Students proficient in core subjects: 78% in reading; 71% in math
- Avg. standardized test scores: 30 out of 36 in ACTs; 1340 out of 1600 in SATs
- Annual district spending: $17,386 per pupil
- Total enrollment: 4,006
29. Los Gatos-Saratoga Joint Union High School District

- Location: Los Gatos, CA
- Student-teacher ratio: 21:1
- Avg. graduation rate: 97%
- Students proficient in core subjects: 90% in reading; 83% in math
- Avg. standardized test scores: 32 out of 36 in ACTs; 1390 out of 1600 in SATs
- Annual district spending: $19,426 per pupil
- Total enrollment: 3,382
28. Bellmore-Merrick Central High School District

- Location: North Merrick, NY
- Student-teacher ratio: 11:1
- Avg. graduation rate: 95%
- Students proficient in core subjects: 88% in reading; 84% in math
- Avg. standardized test scores: 29 out of 36 in ACTs; 1260 out of 1600 in SATs
- Annual district spending: $29,753 per pupil
- Total enrollment: 5,186
27. North Allegheny School District
- Location: Pittsburgh, PA
- Student-teacher ratio: 16:1
- Avg. graduation rate: 91%
- Students proficient in core subjects: 82% in reading; 64% in math
- Avg. standardized test scores: 30 out of 36 in ACTs; 1310 out of 1600 in SATs
- Annual district spending: $23,965 per pupil
- Total enrollment: 8,467
26. School District of Clayton

- Location: Clayton, MO
- Student-teacher ratio: 10:1
- Avg. graduation rate: 98%
- Students proficient in core subjects: 72% in reading; 68% in math
- Avg. standardized test scores: 30 out of 36 in ACTs; 1320 out of 1600 in SATs
- Annual district spending: $24,820 per pupil
- Total enrollment: 2,385
25. Tredyffrin-Easttown School District

- Location: Wayne, PA
- Student-teacher ratio: 17:1
- Avg. graduation rate: 98%
- Students proficient in core subjects: 88% in reading; 77% in math
- Avg. standardized test scores: 30 out of 36 in ACTs; 1360 out of 1600 in SATs
- Annual district spending: $22,265 per pupil
- Total enrollment: 6,928
24. Hewlett-Woodmere Union Free School District

- Location: Woodmere, NY
- Student-teacher ratio: 10:1
- Avg. graduation rate: 97%
- Students proficient in core subjects: 79% in reading; 72% in math
- Avg. standardized test scores: 29 out of 36 in ACTs; 1290 out of 1600 in SATs
- Annual district spending: $41,507 per pupil
- Total enrollment: 2,825
23. Community High School District 128

- Location: Vernon Hills, IL
- Student-teacher ratio: 14:1
- Avg. graduation rate: 98%
- Students proficient in core subjects: 63% in reading; 60% in math
- Avg. standardized test scores: 30 out of 36 in ACTs; 1310 out of 1600 in SATs
- Annual district spending: $36,909 per pupil
- Total enrollment: 3,359
22. New Trier Township High School District No. 203

- Location: Northfield, IL
- Student-teacher ratio: 10:1
- Avg. graduation rate: 98%
- Students proficient in core subjects: 80% in reading; 76% in math
- Avg. standardized test scores: 30 out of 36 in ACTs; 1350 out of 1600 in SATs
- Annual district spending: $38,376 per pupil
- Total enrollment: 3,889
21. Syosset Central School District

- Location: Syosset, NY
- Student-teacher ratio: 11:1
- Avg. graduation rate: 96%
- Students proficient in core subjects: 82% in reading; 88% in math
- Avg. standardized test scores: 30 out of 36 in ACTs; 1380 out of 1600 in SATs
- Annual district spending: $36,191 per pupil
- Total enrollment: 6,797
20. Westport School District

- Location: Westport, CT
- Student-teacher ratio: 11:1
- Avg. graduation rate: 98%
- Students proficient in core subjects: 82% in reading; 74% in math
- Avg. standardized test scores: 31 out of 36 in ACTs; 1320 out of 1600 in SATs
- Annual district spending: $26,565 per pupil
- Total enrollment: 5,303
19. Niles Township Community High School District No. 219

- Location: Skokie, IL
- Student-teacher ratio: 13:1
- Avg. graduation rate: 93%
- Students proficient in core subjects: 42% in reading; 37% in math
- Avg. standardized test scores: 28 out of 36 in ACTs; 1230 out of 1600 in SATs
- Annual district spending: $43,140 per pupil
- Total enrollment: 4,619
18. San Dieguito Union High School District

- Location: Encinitas, CA
- Student-teacher ratio: 25:1
- Avg. graduation rate: 96%
- Students proficient in core subjects: 79% in reading; 72% in math
- Avg. standardized test scores: 30 out of 36 in ACTs; 1350 out of 1600 in SATs
- Annual district spending: $17,579 per pupil
- Total enrollment: 12,704
17. Township High School District No. 211

- Location: Palatine, IL
- Student-teacher ratio: 15:1
- Avg. graduation rate: 95%
- Students proficient in core subjects: 43% in reading; 45% in math
- Avg. standardized test scores: 29 out of 36 in ACTs; 1260 out of 1600 in SATs
- Annual district spending: $26,178 per pupil
- Total enrollment: 12,121
16. Palo Alto Unified School District

- Location: Palo Alto, CA
- Student-teacher ratio: 18:1
- Avg. graduation rate: 94%
- Students proficient in core subjects: 80% in reading; 79% in math
- Avg. standardized test scores: 32 out of 36 in ACTs; 1410 out of 1600 in SATs
- Annual district spending: $26,678 per pupil
- Total enrollment: 11,395
15. Hinsdale Township High School District No. 86
- Location: Hinsdale, IL
- Student-teacher ratio: 13:1
- Avg. graduation rate: 92%
- Students proficient in core subjects: 64% in reading; 62% in math
- Avg. standardized test scores: 30 out of 36 in ACTs; 1330 out of 1600 in SATs
- Annual district spending: $36,133 per pupil
- Total enrollment: 3,894
14. Half Hollow Hills Central School District

- Location: Dix Hills, NY
- Student-teacher ratio: 11:1
- Avg. graduation rate: 95%
- Students proficient in core subjects: 75% in reading; 79% in math
- Avg. standardized test scores: 30 out of 36 in ACTs; 1300 out of 1600 in SATs
- Annual district spending: $32,846 per pupil
- Total enrollment: 7,408
13. Scarsdale Union Free School District

- Location: Scarsdale, NY
- Student-teacher ratio: 12:1
- Avg. graduation rate: 98%
- Students proficient in core subjects: 92% in reading; 87% in math
- Avg. standardized test scores: 32 out of 36 in ACTs; 1420 out of 1600 in SATs
- Annual district spending: $38,850 per pupil
- Total enrollment: 4,642
12. West Lafayette Community School Corporation
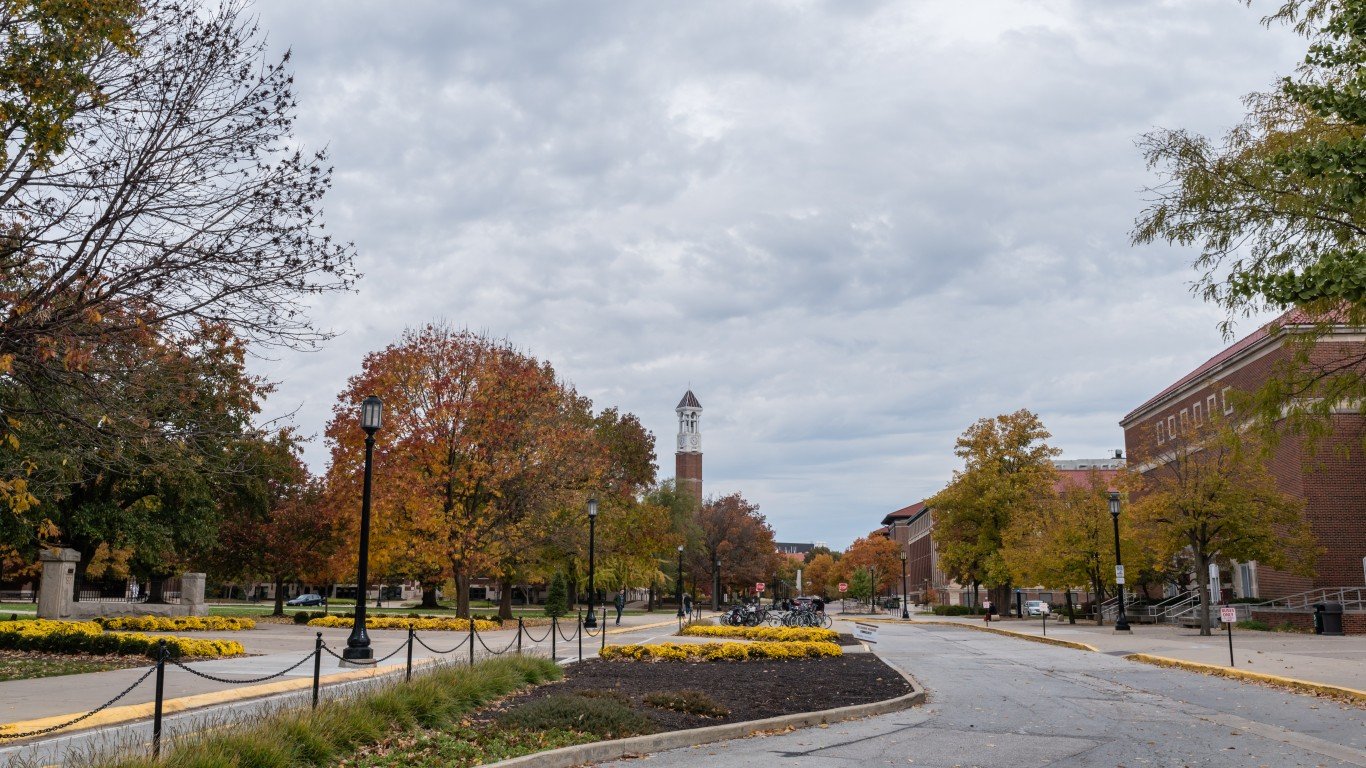
- Location: West Lafayette, IN
- Student-teacher ratio: 14:1
- Avg. graduation rate: 95%
- Students proficient in core subjects: 70% in reading; 66% in math
- Avg. standardized test scores: 32 out of 36 in ACTs; 1340 out of 1600 in SATs
- Annual district spending: $14,580 per pupil
- Total enrollment: 2,369
11. Great Neck Public Schools

- Location: Great Neck, NY
- Student-teacher ratio: 11:1
- Avg. graduation rate: 94%
- Students proficient in core subjects: 83% in reading; 86% in math
- Avg. standardized test scores: 31 out of 36 in ACTs; 1390 out of 1600 in SATs
- Annual district spending: $36,078 per pupil
- Total enrollment: 6,776
10. Radnor Township School District
- Location: Wayne, PA
- Student-teacher ratio: 14:1
- Avg. graduation rate: 97%
- Students proficient in core subjects: 86% in reading; 72% in math
- Avg. standardized test scores: 31 out of 36 in ACTs; 1350 out of 1600 in SATs
- Annual district spending: $26,584 per pupil
- Total enrollment: 3,601
9. Roslyn Union Free School District

- Location: Roslyn, NY
- Student-teacher ratio: 13:1
- Avg. graduation rate: 97%
- Students proficient in core subjects: 82% in reading; 83% in math
- Avg. standardized test scores: 31 out of 36 in ACTs; 1390 out of 1600 in SATs
- Annual district spending: $32,874 per pupil
- Total enrollment: 3,318
8. Ladue School District

- Location: St Louis, MO
- Student-teacher ratio: 13:1
- Avg. graduation rate: 97%
- Students proficient in core subjects: 70% in reading; 64% in math
- Avg. standardized test scores: 29 out of 36 in ACTs; 1450 out of 1600 in SATs
- Annual district spending: $17,320 per pupil
- Total enrollment: 4,382
7. South Texas Independent School District

- Location: Mercedes, TX
- Student-teacher ratio: 17:1
- Avg. graduation rate: 99%
- Students proficient in core subjects: 74% in reading; 54% in math
- Avg. standardized test scores: 26 out of 36 in ACTs; 1200 out of 1600 in SATs
- Annual district spending: $15,039 per pupil
- Total enrollment: 4,251
6. Jericho Union Free School District

- Location: Jericho, NY
- Student-teacher ratio: 12:1
- Avg. graduation rate: 99%
- Students proficient in core subjects: 86% in reading; 91% in math
- Avg. standardized test scores: 32 out of 36 in ACTs; 1420 out of 1600 in SATs
- Annual district spending: $39,926 per pupil
- Total enrollment: 3,182
5. Township High School District No. 113

- Location: Highland Park, IL
- Student-teacher ratio: 12:1
- Avg. graduation rate: 95%
- Students proficient in core subjects: 63% in reading; 60% in math
- Avg. standardized test scores: 29 out of 36 in ACTs; 1310 out of 1600 in SATs
- Annual district spending: $38,613 per pupil
- Total enrollment: 3,298
4. Eanes Independent School District

- Location: Austin, TX
- Student-teacher ratio: 15:1
- Avg. graduation rate: 99%
- Students proficient in core subjects: 74% in reading; 70% in math
- Avg. standardized test scores: 31 out of 36 in ACTs; 1360 out of 1600 in SATs
- Annual district spending: $26,715 per pupil
- Total enrollment: 7,834
3. Evanston Township High School District No. 202

- Location: Evanston, IL
- Student-teacher ratio: 14:1
- Avg. graduation rate: 92%
- Students proficient in core subjects: 52% in reading; 47% in math
- Avg. standardized test scores: 28 out of 36 in ACTs; 1230 out of 1600 in SATs
- Annual district spending: $27,679 per pupil
- Total enrollment: 3,727
2. Glenbrook High School District 225

- Location: Glenview, IL
- Student-teacher ratio: 13:1
- Avg. graduation rate: 97%
- Students proficient in core subjects: 64% in reading; 62% in math
- Avg. standardized test scores: 30 out of 36 in ACTs; 1320 out of 1600 in SATs
- Annual district spending: $53,682 per pupil
- Total enrollment: 5,132
1. Adlai E. Stevenson High School District No. 125

- Location: Lincolnshire, IL
- Student-teacher ratio: 16:1
- Avg. graduation rate: 96%
- Students proficient in core subjects: 73% in reading; 72% in math
- Avg. standardized test scores: 31 out of 36 in ACTs; 1360 out of 1600 in SATs
- Annual district spending: $37,088 per pupil
- Total enrollment: 4,392
“The Next NVIDIA” Could Change Your Life
If you missed out on NVIDIA’s historic run, your chance to see life-changing profits from AI isn’t over.
The 24/7 Wall Street Analyst who first called NVIDIA’s AI-fueled rise in 2009 just published a brand-new research report named “The Next NVIDIA.”
Click here to download your FREE copy.
The post These US Public School Districts Put the Rest of the Country to Shame appeared first on 24/7 Wall St..