While the typical American household is earning more than ever before, incomes have not been rising fast enough to offset inflation.
According to estimates from the U.S. Census Bureau, the national median household income was nearly $75,000 in 2022, up from about $69,700 in 2021. The 7.2% increase was the largest recorded year-over-year since at least the mid-1990s. Yet, US citizens are still struggling. While no one has been spared from surging prices, Americans on the low end of the income spectrum have bore the brunt. During inflationary periods, higher-income Americans can cut back on spending and reduce the impact of rising costs. Meanwhile, lower-earning Americans, who spend a larger share of their income on necessities such as food, housing, and gas, cannot.
Pennsylvania’s median household income is $73,170. However, in many parts of the state, the typical household earns far less than the statewide median.
Using five-year estimates from the U.S. Census Bureau’s 2022 American Community Survey, 24/7 Wall St. identified the 35 poorest counties in Pennsylvania. Counties in the state are ranked on median household income. Population, poverty, and unemployment data are also five-year estimates from the 2022 ACS.
Why Is This Important?

Among the counties on this list, median household incomes are anywhere from about $9,700 to nearly $27,000 below the statewide median. In many of these countries, levels of financial hardship are underscored by widespread poverty. In all but nine counties on this list, the share of residents living below the poverty line exceeds the 11.8% statewide poverty rate.
These are the poorest counties in Pennsylvania.
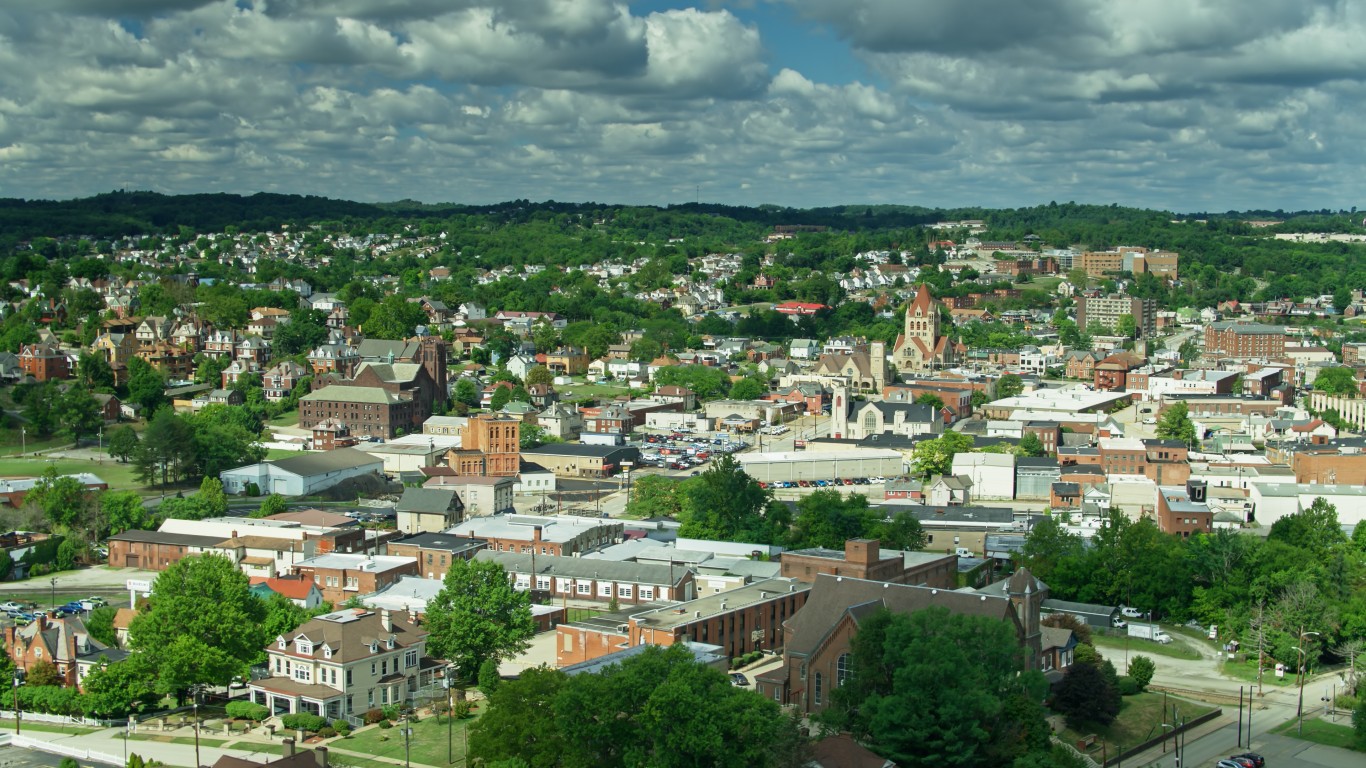
35. Lycoming County
- Median household income: $63,437
- Poverty rate: 12.5%
- 5-yr. avg. unemployment rate: 5.3%
- Population: 114,022
34. Fulton County

- Median household income: $63,153
- Poverty rate: 10.7%
- 5-yr. avg. unemployment rate: 3.7%
- Population: 14,545
33. Sullivan County

- Median household income: $62,910
- Poverty rate: 12.2%
- 5-yr. avg. unemployment rate: 5.5%
- Population: 5,880
32. Juniata County
- Median household income: $61,915
- Poverty rate: 9.0%
- 5-yr. avg. unemployment rate: 3.1%
- Population: 23,535
31. Elk County

- Median household income: $61,672
- Poverty rate: 9.0%
- 5-yr. avg. unemployment rate: 6.5%
- Population: 30,886
30. Huntingdon County

- Median household income: $61,300
- Poverty rate: 11.3%
- 5-yr. avg. unemployment rate: 5.1%
- Population: 44,123
29. Armstrong County

- Median household income: $61,011
- Poverty rate: 10.4%
- 5-yr. avg. unemployment rate: 5.1%
- Population: 65,538
28. Luzerne County

- Median household income: $60,836
- Poverty rate: 14.9%
- 5-yr. avg. unemployment rate: 5.9%
- Population: 325,396
27. Bradford County

- Median household income: $60,650
- Poverty rate: 13.1%
- 5-yr. avg. unemployment rate: 4.8%
- Population: 60,159
26. Tioga County

- Median household income: $59,707
- Poverty rate: 12.2%
- 5-yr. avg. unemployment rate: 4.5%
- Population: 41,186
25. Columbia County
- Median household income: $59,457
- Poverty rate: 15.3%
- 5-yr. avg. unemployment rate: 4.7%
- Population: 64,924
24. Erie County

- Median household income: $59,396
- Poverty rate: 15.4%
- 5-yr. avg. unemployment rate: 5.5%
- Population: 270,495
23. Blair County

- Median household income: $59,386
- Poverty rate: 13.2%
- 5-yr. avg. unemployment rate: 4.2%
- Population: 122,640
22. Venango County

- Median household income: $59,278
- Poverty rate: 13.4%
- 5-yr. avg. unemployment rate: 6.7%
- Population: 50,475
21. Wayne County

- Median household income: $59,240
- Poverty rate: 11.0%
- 5-yr. avg. unemployment rate: 5.9%
- Population: 51,227
20. Clinton County

- Median household income: $59,011
- Poverty rate: 13.1%
- 5-yr. avg. unemployment rate: 5.3%
- Population: 37,860
19. Crawford County

- Median household income: $58,734
- Poverty rate: 12.7%
- 5-yr. avg. unemployment rate: 5.6%
- Population: 83,876
18. Clarion County

- Median household income: $58,690
- Poverty rate: 13.7%
- 5-yr. avg. unemployment rate: 5.5%
- Population: 37,489
17. Bedford County

- Median household income: $58,337
- Poverty rate: 10.8%
- 5-yr. avg. unemployment rate: 4.3%
- Population: 47,613
16. Mifflin County

- Median household income: $58,012
- Poverty rate: 16.7%
- 5-yr. avg. unemployment rate: 3.9%
- Population: 46,146
15. Warren County

- Median household income: $57,925
- Poverty rate: 11.6%
- 5-yr. avg. unemployment rate: 4.3%
- Population: 38,492
14. McKean County

- Median household income: $57,861
- Poverty rate: 14.1%
- 5-yr. avg. unemployment rate: 5.3%
- Population: 40,459
13. Lawrence County

- Median household income: $57,585
- Poverty rate: 12.3%
- 5-yr. avg. unemployment rate: 6.8%
- Population: 85,907
12. Philadelphia County

- Median household income: $57,537
- Poverty rate: 22.7%
- 5-yr. avg. unemployment rate: 8.6%
- Population: 1,593,208
11. Somerset County

- Median household income: $57,357
- Poverty rate: 10.8%
- 5-yr. avg. unemployment rate: 5.2%
- Population: 73,802
10. Mercer County

- Median household income: $57,353
- Poverty rate: 13.5%
- 5-yr. avg. unemployment rate: 5.5%
- Population: 110,600
9. Indiana County

- Median household income: $57,170
- Poverty rate: 13.0%
- 5-yr. avg. unemployment rate: 6.5%
- Population: 83,394
8. Clearfield County
- Median household income: $56,982
- Poverty rate: 13.7%
- 5-yr. avg. unemployment rate: 6.0%
- Population: 79,707
7. Jefferson County

- Median household income: $56,607
- Poverty rate: 14.1%
- 5-yr. avg. unemployment rate: 5.4%
- Population: 44,326
6. Potter County

- Median household income: $56,491
- Poverty rate: 12.2%
- 5-yr. avg. unemployment rate: 4.8%
- Population: 16,390
5. Northumberland County
- Median household income: $55,952
- Poverty rate: 12.4%
- 5-yr. avg. unemployment rate: 4.7%
- Population: 91,340
4. Fayette County
- Median household income: $55,579
- Poverty rate: 16.2%
- 5-yr. avg. unemployment rate: 7.2%
- Population: 128,417
3. Cambria County

- Median household income: $54,221
- Poverty rate: 14.4%
- 5-yr. avg. unemployment rate: 4.9%
- Population: 133,263
2. Forest County

- Median household income: $46,188
- Poverty rate: 19.2%
- 5-yr. avg. unemployment rate: 4.3%
- Population: 6,959
1. Cameron County
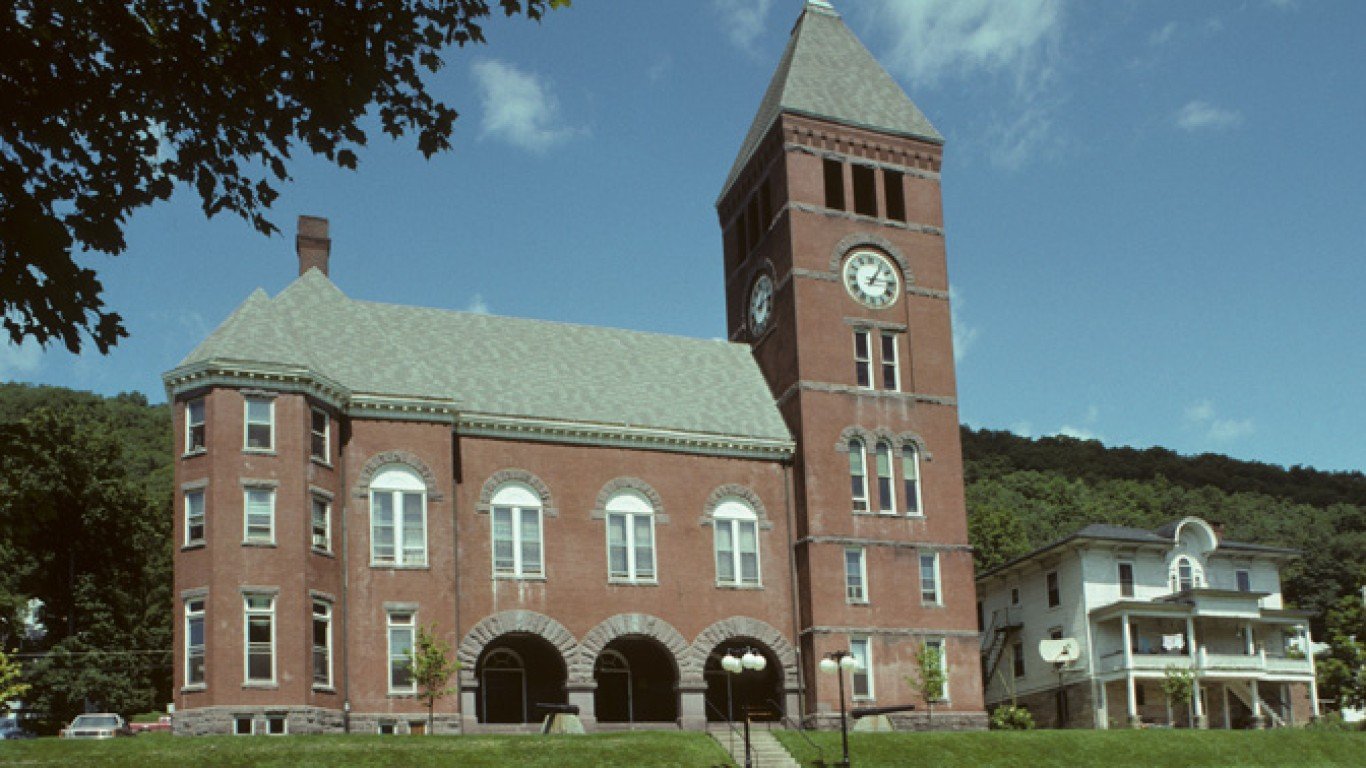
- Median household income: $46,186
- Poverty rate: 15.0%
- 5-yr. avg. unemployment rate: 7.1%
- Population: 4,536
| Rank | County | Median household income ($) | Poverty rate (%) | 5-yr. avg. unemployment rate (%) |
|---|---|---|---|---|
| 1 | Cameron, Pennsylvania | 46,186 | 15.0 | 7.1 |
| 2 | Forest, Pennsylvania | 46,188 | 19.2 | 4.3 |
| 3 | Cambria, Pennsylvania | 54,221 | 14.4 | 4.9 |
| 4 | Fayette, Pennsylvania | 55,579 | 16.2 | 7.2 |
| 5 | Northumberland, Pennsylvania | 55,952 | 12.4 | 4.7 |
| 6 | Potter, Pennsylvania | 56,491 | 12.2 | 4.8 |
| 7 | Jefferson, Pennsylvania | 56,607 | 14.1 | 5.4 |
| 8 | Clearfield, Pennsylvania | 56,982 | 13.7 | 6.0 |
| 9 | Indiana, Pennsylvania | 57,170 | 13.0 | 6.5 |
| 10 | Mercer, Pennsylvania | 57,353 | 13.5 | 5.5 |
| 11 | Somerset, Pennsylvania | 57,357 | 10.8 | 5.2 |
| 12 | Philadelphia, Pennsylvania | 57,537 | 22.7 | 8.6 |
| 13 | Lawrence, Pennsylvania | 57,585 | 12.3 | 6.8 |
| 14 | McKean, Pennsylvania | 57,861 | 14.1 | 5.3 |
| 15 | Warren, Pennsylvania | 57,925 | 11.6 | 4.3 |
| 16 | Mifflin, Pennsylvania | 58,012 | 16.7 | 3.9 |
| 17 | Bedford, Pennsylvania | 58,337 | 10.8 | 4.3 |
| 18 | Clarion, Pennsylvania | 58,690 | 13.7 | 5.5 |
| 19 | Crawford, Pennsylvania | 58,734 | 12.7 | 5.6 |
| 20 | Clinton, Pennsylvania | 59,011 | 13.1 | 5.3 |
| 21 | Wayne, Pennsylvania | 59,240 | 11.0 | 5.9 |
| 22 | Venango, Pennsylvania | 59,278 | 13.4 | 6.7 |
| 23 | Blair, Pennsylvania | 59,386 | 13.2 | 4.2 |
| 24 | Erie, Pennsylvania | 59,396 | 15.4 | 5.5 |
| 25 | Columbia, Pennsylvania | 59,457 | 15.3 | 4.7 |
| 26 | Tioga, Pennsylvania | 59,707 | 12.2 | 4.5 |
| 27 | Bradford, Pennsylvania | 60,650 | 13.1 | 4.8 |
| 28 | Luzerne, Pennsylvania | 60,836 | 14.9 | 5.9 |
| 29 | Armstrong, Pennsylvania | 61,011 | 10.4 | 5.1 |
| 30 | Huntingdon, Pennsylvania | 61,300 | 11.3 | 5.1 |
| 31 | Elk, Pennsylvania | 61,672 | 9.0 | 6.5 |
| 32 | Juniata, Pennsylvania | 61,915 | 9.0 | 3.1 |
| 33 | Sullivan, Pennsylvania | 62,910 | 12.2 | 5.5 |
| 34 | Fulton, Pennsylvania | 63,153 | 10.7 | 3.7 |
| 35 | Lycoming, Pennsylvania | 63,437 | 12.5 | 5.3 |
“The Next NVIDIA” Could Change Your Life
If you missed out on NVIDIA’s historic run, your chance to see life-changing profits from AI isn’t over.
The 24/7 Wall Street Analyst who first called NVIDIA’s AI-fueled rise in 2009 just published a brand-new research report named “The Next NVIDIA.”
Click here to download your FREE copy.
The post Once Thriving, This Poor County Reflects the Struggle of Rural America appeared first on 24/7 Wall St..