It seems that Hurricane Debby barely finished making headlines before tropical storm Ernesto began making its own. Ernesto is expected to become a hurricane by early Wednesday, according to the National Hurricane Center, though its path would most likely not reach the continental U.S., veering north after reaching Puerto Rico and the U.S. and British Virgin Islands towards Bermuda.
Still, many hurricanes during the Atlantic hurricane season reach the U.S., and some areas of the country are at far higher risk of being in a hurricane’s path than others.
To determine the counties with the highest hurricane risk, 24/7 Wall St. reviewed data on natural hazard risk for U.S. counties from the March 2023 FEMA National Risk Index dataset. Counties were ranked based on total hurricane risk as measured by FEMA, calculated as a product of total expected economic loss, social vulnerability, and community resilience.. Supplemental data on the total value of all owner-occupied homes and population change due to net migration are from the U.S. Census Bureau.
Not surprising, all of the counties on the list with the highest hurricane risk are in eastern states, including 23 counties in Florida, seven in Texas, and five each in North and South Carolina. Louisiana, too, is represented with four counties. (Also see: Every $5 billion (plus) weather event since 2020.)
Why are we covering this
 Scientists project that hurricanes will increase, if not in number, then in intensity due to global warming. This list provides a good idea of where the hurricane risk is greatest.
50. Kings County, NY

- FEMA hurricane risk index score: 97.80/100
- Total value of owner-occupied homes: $333.6 billion
- Population change due to net migration, 2017 to 2022: -7.7%
- County seat: Brooklyn
49. St. Tammany Parish, LA

- FEMA hurricane risk index score: 97.85/100
- Total value of owner-occupied homes: $24.3 billion
- Population change due to net migration, 2017 to 2022: +3.9%
- County seat: Covington
48. Terrebonne Parish, LA

- FEMA hurricane risk index score: 97.89/100
- Total value of owner-occupied homes: $7.2 billion
- Population change due to net migration, 2017 to 2022: -5.9%
- County seat: Houma
47. Monroe County, FL

- FEMA hurricane risk index score: 97.94/100
- Total value of owner-occupied homes: $19.0 billion
- Population change due to net migration, 2017 to 2022: -2.2%
- County seat: Key West
46. Dorchester County, SC
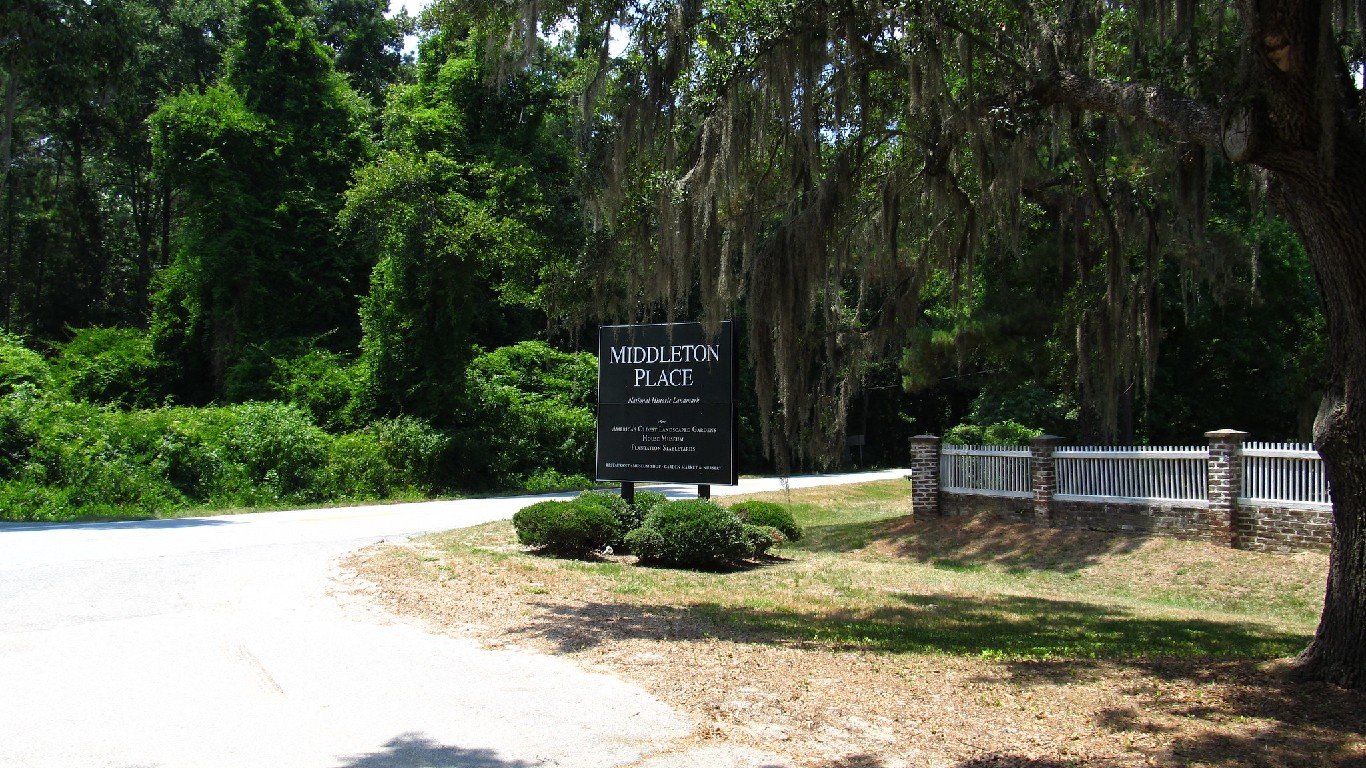
- FEMA hurricane risk index score: 97.98/100
- Total value of owner-occupied homes: $13.3 billion
- Population change due to net migration, 2017 to 2022: +4.4%
- County seat: St. George
45. Suffolk County, NY

- FEMA hurricane risk index score: 98.03/100
- Total value of owner-occupied homes: $256.7 billion
- Population change due to net migration, 2017 to 2022: -0.6%
- County seat: Riverhead
44. Craven County, NC

- FEMA hurricane risk index score: 98.07/100
- Total value of owner-occupied homes: $6.4 billion
- Population change due to net migration, 2017 to 2022: +2.0%
- County seat: New Bern
43. Charlotte County, FL

- FEMA hurricane risk index score: 98.12/100
- Total value of owner-occupied homes: $22.7 billion
- Population change due to net migration, 2017 to 2022: +14.3%
- County seat: Punta Gorda
42. Martin County, FL

- FEMA hurricane risk index score: 98.16/100
- Total value of owner-occupied homes: $26.2 billion
- Population change due to net migration, 2017 to 2022: +5.4%
- County seat: Stuart
41. Volusia County, FL

- FEMA hurricane risk index score: 98.21/100
- Total value of owner-occupied homes: $48.5 billion
- Population change due to net migration, 2017 to 2022: +8.8%
- County seat: DeLand
40. Harrison County, MS

- FEMA hurricane risk index score: 98.25/100
- Total value of owner-occupied homes: $11.0 billion
- Population change due to net migration, 2017 to 2022: +1.1%
- County seat: Biloxi
39. Nueces County, TX

- FEMA hurricane risk index score: 98.30/100
- Total value of owner-occupied homes: $17.3 billion
- Population change due to net migration, 2017 to 2022: -0.9%
- County seat: Corpus Christi
38. Galveston County, TX

- FEMA hurricane risk index score: 98.34/100
- Total value of owner-occupied homes: $27.9 billion
- Population change due to net migration, 2017 to 2022: +2.7%
- County seat: Galveston
37. Brunswick County, NC

- FEMA hurricane risk index score: 98.38/100
- Total value of owner-occupied homes: $17.5 billion
- Population change due to net migration, 2017 to 2022: +19.1%
- County seat: Bolivia
36. Orleans Parish, LA

- FEMA hurricane risk index score: 98.43/100
- Total value of owner-occupied homes: $30.7 billion
- Population change due to net migration, 2017 to 2022: -5.5%
- County seat: New Orleans
35. Indian River County, FL
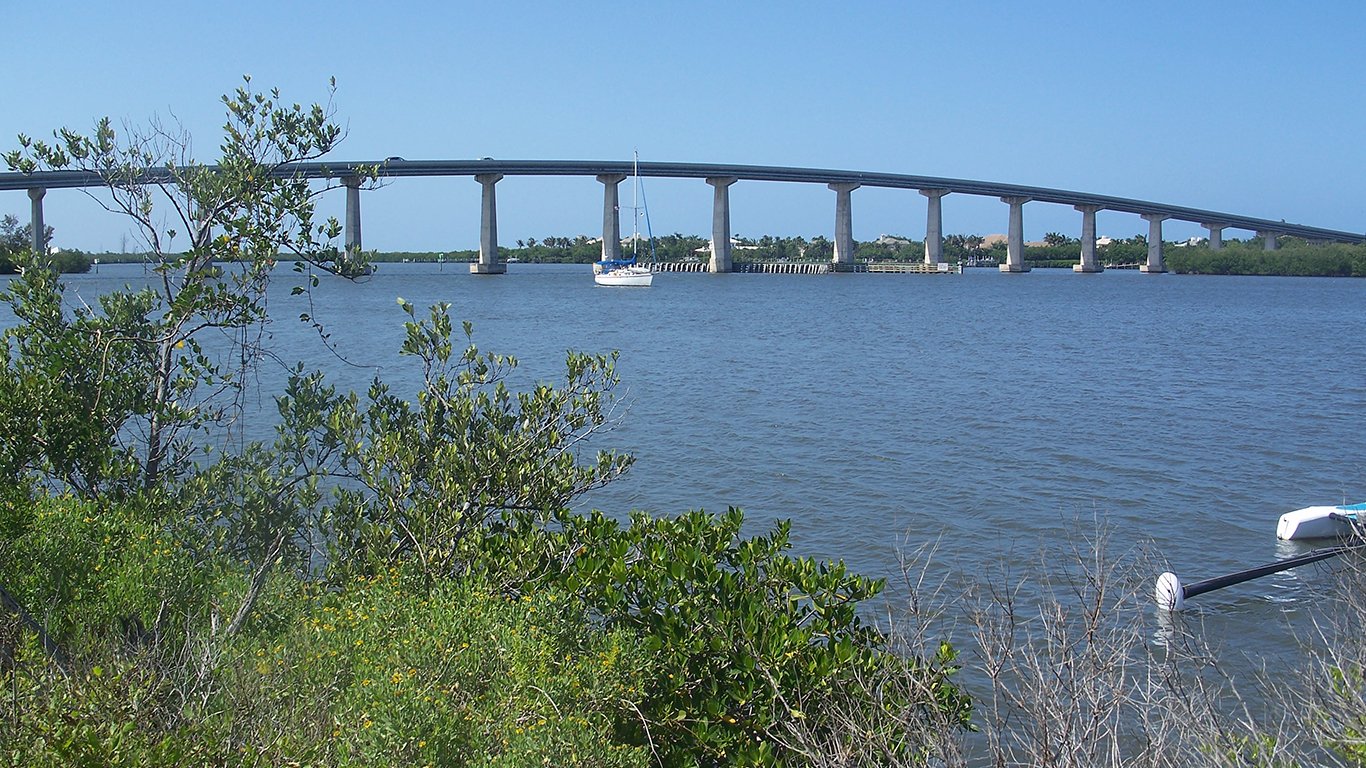
- FEMA hurricane risk index score: 98.47/100
- Total value of owner-occupied homes: $22.2 billion
- Population change due to net migration, 2017 to 2022: +9.1%
- County seat: Vero Beach
34. Brazoria County, TX

- FEMA hurricane risk index score: 98.52/100
- Total value of owner-occupied homes: $25.9 billion
- Population change due to net migration, 2017 to 2022: +5.8%
- County seat: Angleton
33. Carteret County, NC

- FEMA hurricane risk index score: 98.56/100
- Total value of owner-occupied homes: $8.0 billion
- Population change due to net migration, 2017 to 2022: +5.4%
- County seat: Beaufort
32. Berkeley County, SC

- FEMA hurricane risk index score: 98.61/100
- Total value of owner-occupied homes: $20.4 billion
- Population change due to net migration, 2017 to 2022: +9.9%
- County seat: Moncks Corner
31. Polk County, FL

- FEMA hurricane risk index score: 98.65/100
- Total value of owner-occupied homes: $44.6 billion
- Population change due to net migration, 2017 to 2022: +13.0%
- County seat: Bartow
30. Okaloosa County, FL

- FEMA hurricane risk index score: 98.70/100
- Total value of owner-occupied homes: $21.9 billion
- Population change due to net migration, 2017 to 2022: +2.5%
- County seat: Crestview
29. Bay County, FL

- FEMA hurricane risk index score: 98.74/100
- Total value of owner-occupied homes: $15.0 billion
- Population change due to net migration, 2017 to 2022: +9.3%
- County seat: Panama City
28. Duval County, FL

- FEMA hurricane risk index score: 98.79/100
- Total value of owner-occupied homes: $73.3 billion
- Population change due to net migration, 2017 to 2022: +2.7%
- County seat: Jacksonville
27. Cameron County, TX

- FEMA hurricane risk index score: 98.83/100
- Total value of owner-occupied homes: $12.4 billion
- Population change due to net migration, 2017 to 2022: -0.3%
- County seat: Brownsville
26. Baldwin County, AL

- FEMA hurricane risk index score: 98.88/100
- Total value of owner-occupied homes: $23.8 billion
- Population change due to net migration, 2017 to 2022: +10.0%
- County seat: Bay Minette
25. Escambia County, FL
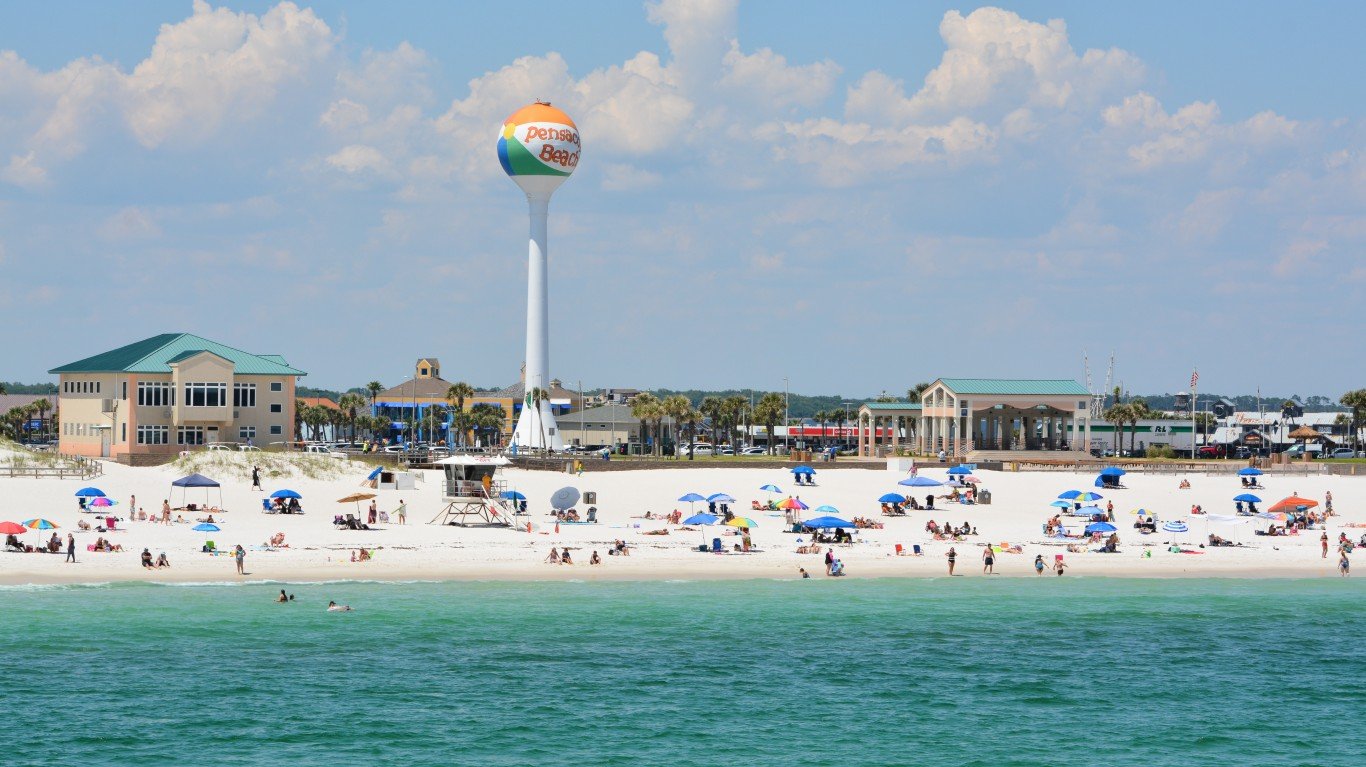
- FEMA hurricane risk index score: 98.92/100
- Total value of owner-occupied homes: $20.8 billion
- Population change due to net migration, 2017 to 2022: +2.1%
- County seat: Pensacola
24. Jefferson Parish, LA

- FEMA hurricane risk index score: 98.97/100
- Total value of owner-occupied homes: $30.1 billion
- Population change due to net migration, 2017 to 2022: -4.6%
- County seat: Gretna
23. Onslow County, NC

- FEMA hurricane risk index score: 99.01/100
- Total value of owner-occupied homes: $9.2 billion
- Population change due to net migration, 2017 to 2022: +1.2%
- County seat: Jacksonville
22. Orange County, FL

- FEMA hurricane risk index score: 99.06/100
- Total value of owner-occupied homes: $114.5 billion
- Population change due to net migration, 2017 to 2022: +1.5%
- County seat: Orlando
21. Beaufort County, SC

- FEMA hurricane risk index score: 99.10/100
- Total value of owner-occupied homes: $30.6 billion
- Population change due to net migration, 2017 to 2022: +6.6%
- County seat: Beaufort
20. St. Lucie County, FL

- FEMA hurricane risk index score: 99.15/100
- Total value of owner-occupied homes: $29.9 billion
- Population change due to net migration, 2017 to 2022: +14.4%
- County seat: Fort Pierce
19. Manatee County, FL

- FEMA hurricane risk index score: 99.19/100
- Total value of owner-occupied homes: $47.5 billion
- Population change due to net migration, 2017 to 2022: +11.5%
- County seat: Bradenton
18. Fort Bend County, TX

- FEMA hurricane risk index score: 99.24/100
- Total value of owner-occupied homes: $80.3 billion
- Population change due to net migration, 2017 to 2022: +9.7%
- County seat: Richmond
17. Hidalgo County, TX

- FEMA hurricane risk index score: 99.28/100
- Total value of owner-occupied homes: $25.1 billion
- Population change due to net migration, 2017 to 2022: +0.5%
- County seat: Edinburg
16. Sarasota County, FL

- FEMA hurricane risk index score: 99.33/100
- Total value of owner-occupied homes: $72.8 billion
- Population change due to net migration, 2017 to 2022: +11.2%
- County seat: Sarasota
15. New Hanover County, NC

- FEMA hurricane risk index score: 99.37/100
- Total value of owner-occupied homes: $24.1 billion
- Population change due to net migration, 2017 to 2022: +6.0%
- County seat: Wilmington
14. Mobile County, AL

- FEMA hurricane risk index score: 99.42/100
- Total value of owner-occupied homes: $20.9 billion
- Population change due to net migration, 2017 to 2022: -0.7%
- County seat: Mobile
13. Chatham County, GA

- FEMA hurricane risk index score: 99.46/100
- Total value of owner-occupied homes: $22.9 billion
- Population change due to net migration, 2017 to 2022: +2.1%
- County seat: Savannah
12. Collier County, FL

- FEMA hurricane risk index score: 99.51/100
- Total value of owner-occupied homes: $85.3 billion
- Population change due to net migration, 2017 to 2022: +8.6%
- County seat: East Naples
11. Horry County, SC

- FEMA hurricane risk index score: 99.55/100
- Total value of owner-occupied homes: $29.6 billion
- Population change due to net migration, 2017 to 2022: +14.9%
- County seat: Conway
10. Pasco County, FL

- FEMA hurricane risk index score: 99.60/100
- Total value of owner-occupied homes: $45.2 billion
- Population change due to net migration, 2017 to 2022: +14.0%
- County seat: Dade City
9. Charleston County, SC

- FEMA hurricane risk index score: 99.64/100
- Total value of owner-occupied homes: $61.5 billion
- Population change due to net migration, 2017 to 2022: +2.9%
- County seat: Charleston
8. Pinellas County, FL

- FEMA hurricane risk index score: 99.69/100
- Total value of owner-occupied homes: $106.9 billion
- Population change due to net migration, 2017 to 2022: +2.3%
- County seat: Clearwater
7. Brevard County, FL

- FEMA hurricane risk index score: 99.73/100
- Total value of owner-occupied homes: $63.1 billion
- Population change due to net migration, 2017 to 2022: +8.1%
- County seat: Titusville
6. Lee County, FL

- FEMA hurricane risk index score: 99.78/100
- Total value of owner-occupied homes: $86.2 billion
- Population change due to net migration, 2017 to 2022: +10.5%
- County seat: Fort Myers
5. Hillsborough County, FL

- FEMA hurricane risk index score: 99.82/100
- Total value of owner-occupied homes: $125.5 billion
- Population change due to net migration, 2017 to 2022: +4.3%
- County seat: Tampa
4. Palm Beach County, FL

- FEMA hurricane risk index score: 99.87/100
- Total value of owner-occupied homes: $220.5 billion
- Population change due to net migration, 2017 to 2022: +3.3%
- County seat: West Palm Beach
3. Broward County, FL

- FEMA hurricane risk index score: 99.91/100
- Total value of owner-occupied homes: $199.6 billion
- Population change due to net migration, 2017 to 2022: +0.5%
- County seat: Fort Lauderdale
2. Miami-Dade County, FL

- FEMA hurricane risk index score: 99.96/100
- Total value of owner-occupied homes: $255.6 billion
- Population change due to net migration, 2017 to 2022: -1.0%
- County seat: Miami
1. Harris County, TX

- FEMA hurricane risk index score: 100.00/100
- Total value of owner-occupied homes: $306.2 billion
- Population change due to net migration, 2017 to 2022: +0.1%
- County seat: Houston
“The Next NVIDIA” Could Change Your Life
If you missed out on NVIDIA’s historic run, your chance to see life-changing profits from AI isn’t over.
The 24/7 Wall Street Analyst who first called NVIDIA’s AI-fueled rise in 2009 just published a brand-new research report named “The Next NVIDIA.”
Click here to download your FREE copy.
The post 5 Million Americans Live in This County With the Greatest Hurricane Risk appeared first on 24/7 Wall St..