In the US, the “poverty threshold” for a family of four is $25,700, and according to the last Census, the poverty rate was 11.8% in 2018. The three poorest cities in the United States are Detroit, MI, Cleveland, OH, and Dayton, OH. Detroit’s unemployment rate is 19.8%, the poverty rate is 37.9%, and the median income is $27,838.
America is a country that is known for its stark inequality in income. The richest part of the population (top 1%) owned 32.3% of the nation’s wealth, according to a report in 2022. This is in stark contrast to the bottom 90%, which holds only 30.2% of the nation’s wealth.
Since hitting a multi-decade high in June 2022, the paceof inflation in the United States has cooled. Still, consumer prices are rising at nearly double the 2% annual target set by the Federal Reserve – and Americans are feeling the pinch. According to a report from Moody’s Analytics, the same goods and services cost the typical American household $709 more in July 2023 than in July 2021.
Using the US Census Bureau’s 2022 American Community Survey metro area-level data on median household income, additional income, and population data, 24/7 Wall St. identified the poorest city in every state. Four states – Delaware, New Hampshire, Rhode Island, and Vermont – have only one metropolitan area. As a result, the cities listed in these states rank as the poorest by default only.
In most metropolitan areas on this list, the share of households earning less than $10,000 a year exceeds the comparable statewide share – and in all but six metro areas on this list, residents are more likely to live below the poverty line than the typical resident of the state as a whole.
Why Does This Matter?

Poverty is important to discuss because it is ever-present and not going away. The consequences yield health risks, social risks, and human rights violations for those living in it. The harm it inflicts on children follows them through life and can continue the cycle as they reach adulthood.
Here is the poorest city in every state. All information is for 2022.
Alabama: Anniston-Oxford
- Household income (median): $59,674 – the lowest of 12 metro areas in the state
- Statewide median household income: $59,674 – #44 highest of 50 states
- Poverty rate of the metro area: 20,450 (18.3% – #46 highest out of 384 U.S. metro areas)
- Households with an income of under $10,000: 4,151 (9.1% – #20 highest out of 384 U.S. metro areas)
- Population: 115,788
Alaska: Fairbanks

- Household income (median): $88,121 – the lowest of 2 metro areas in the state
- Statewide median household income: $88,121 – #11 highest of 50 states
- Poverty rate of the metro area: 6,528 (7.1% – #379 highest out of 384 U.S. metro areas)
- Households with an income of under $10,000: 1,462 (3.9% – #340 highest out of 384 U.S. metro areas)
- Population: 95,356
Arizona: Yuma
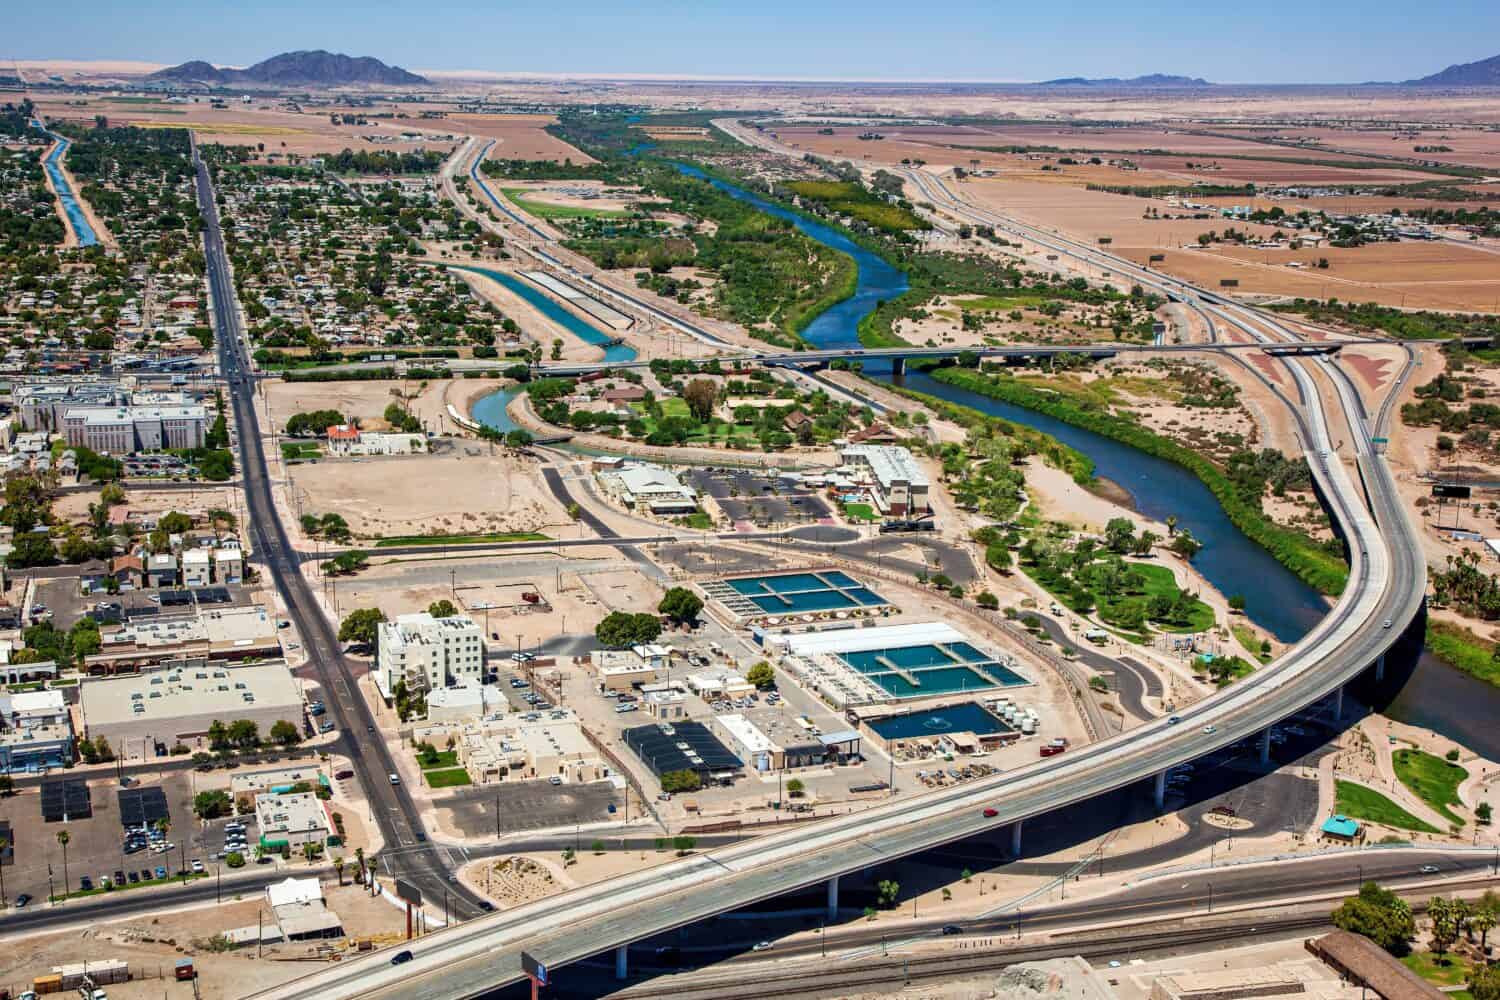
- Household income (median): $74,568 – the lowest of 7 metro areas in the state
- Statewide median household income: $74,568 – #19 highest of 50 states
- Poverty rate of the metro area: 26,544 (13.2% – #186 highest out of 384 U.S. metro areas)
- Households with an income of under $10,000: 4,044 (5.0% – #241 highest out of 384 U.S. metro areas)
- Population: 207,842
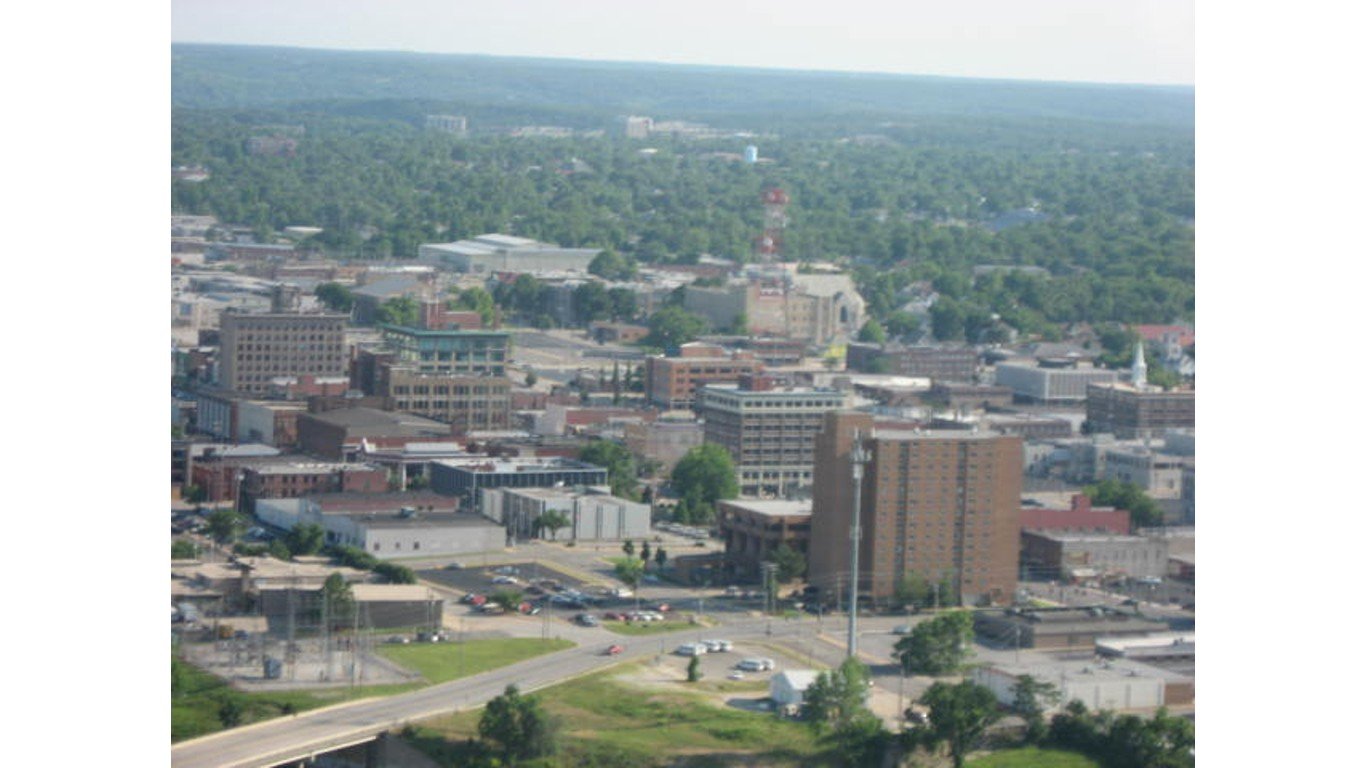
Arkansas: Pine Bluff

- Household income (median): $55,432 – the lowest of 6 metro areas in the state
- Statewide median household income: $55,432 – #47 highest of 50 states
- Poverty rate of the metro area: 14,580 (19.5% – #24 highest out of 384 U.S. metro areas)
- Households with an income of under $10,000: 2,595 (8.5% – #32 highest out of 384 U.S. metro areas)
- Population: 84,460
California: El Centro
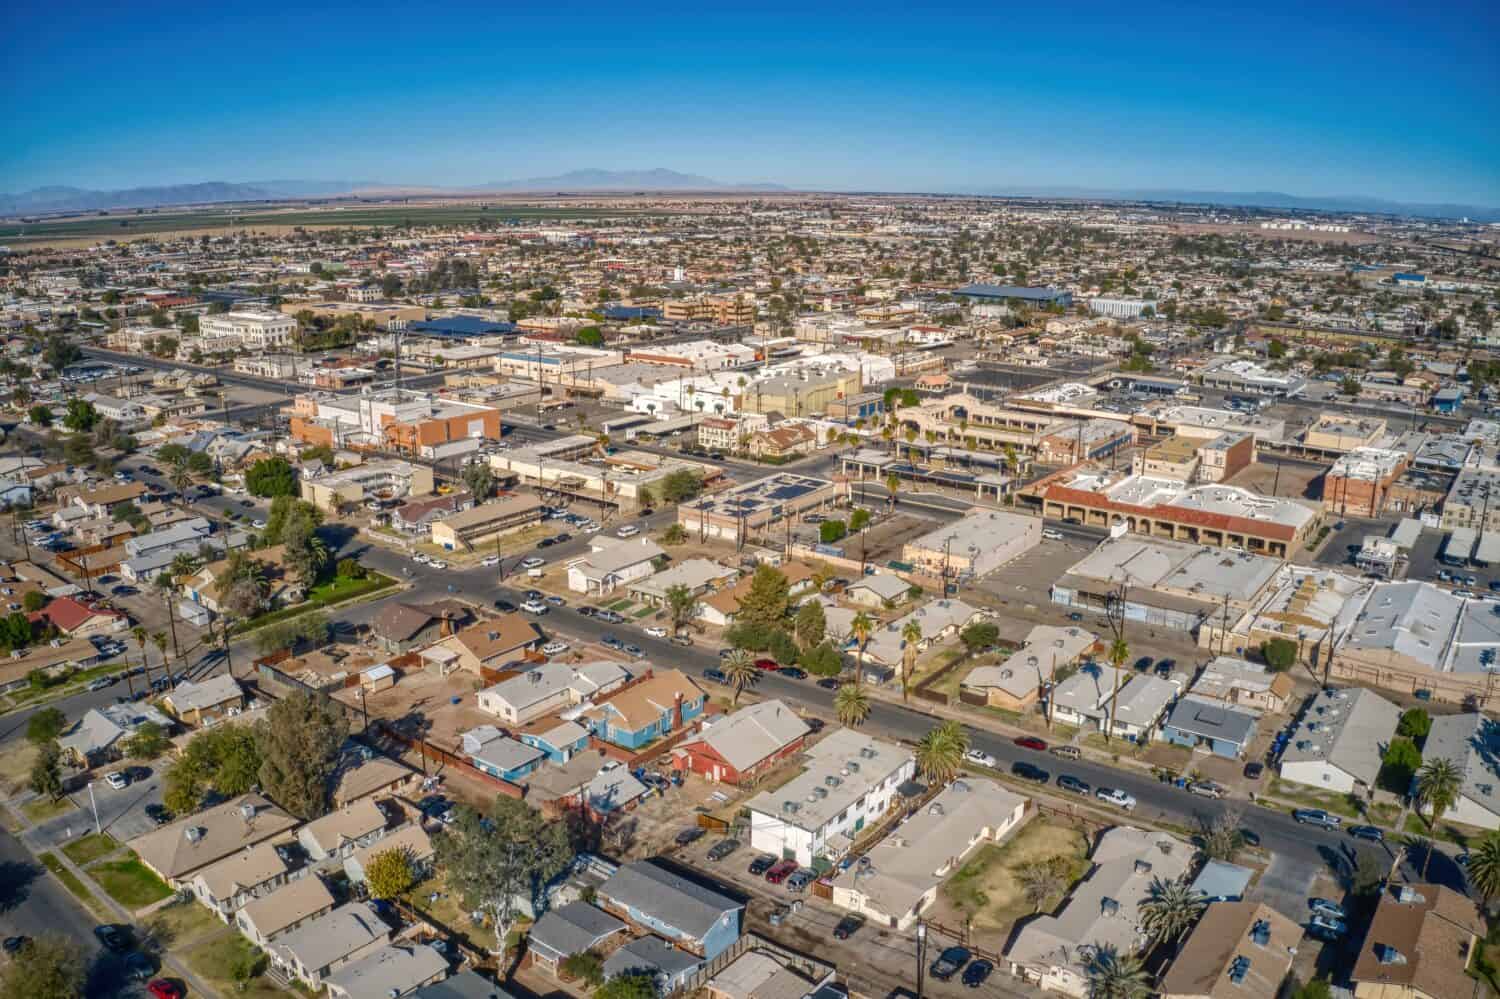
- Household income (median): $91,551 – the lowest of 26 metro areas in the state
- Statewide median household income: $91,551 – #5 highest of 50 states
- Poverty rate of the metro area: 38,933 (22.6% – #7 highest out of 384 U.S. metro areas)
- Households with an income of under $10,000: 4,944 (9.7% – #13 highest out of 384 U.S. metro areas)
- Population: 178,713
Colorado: Pueblo
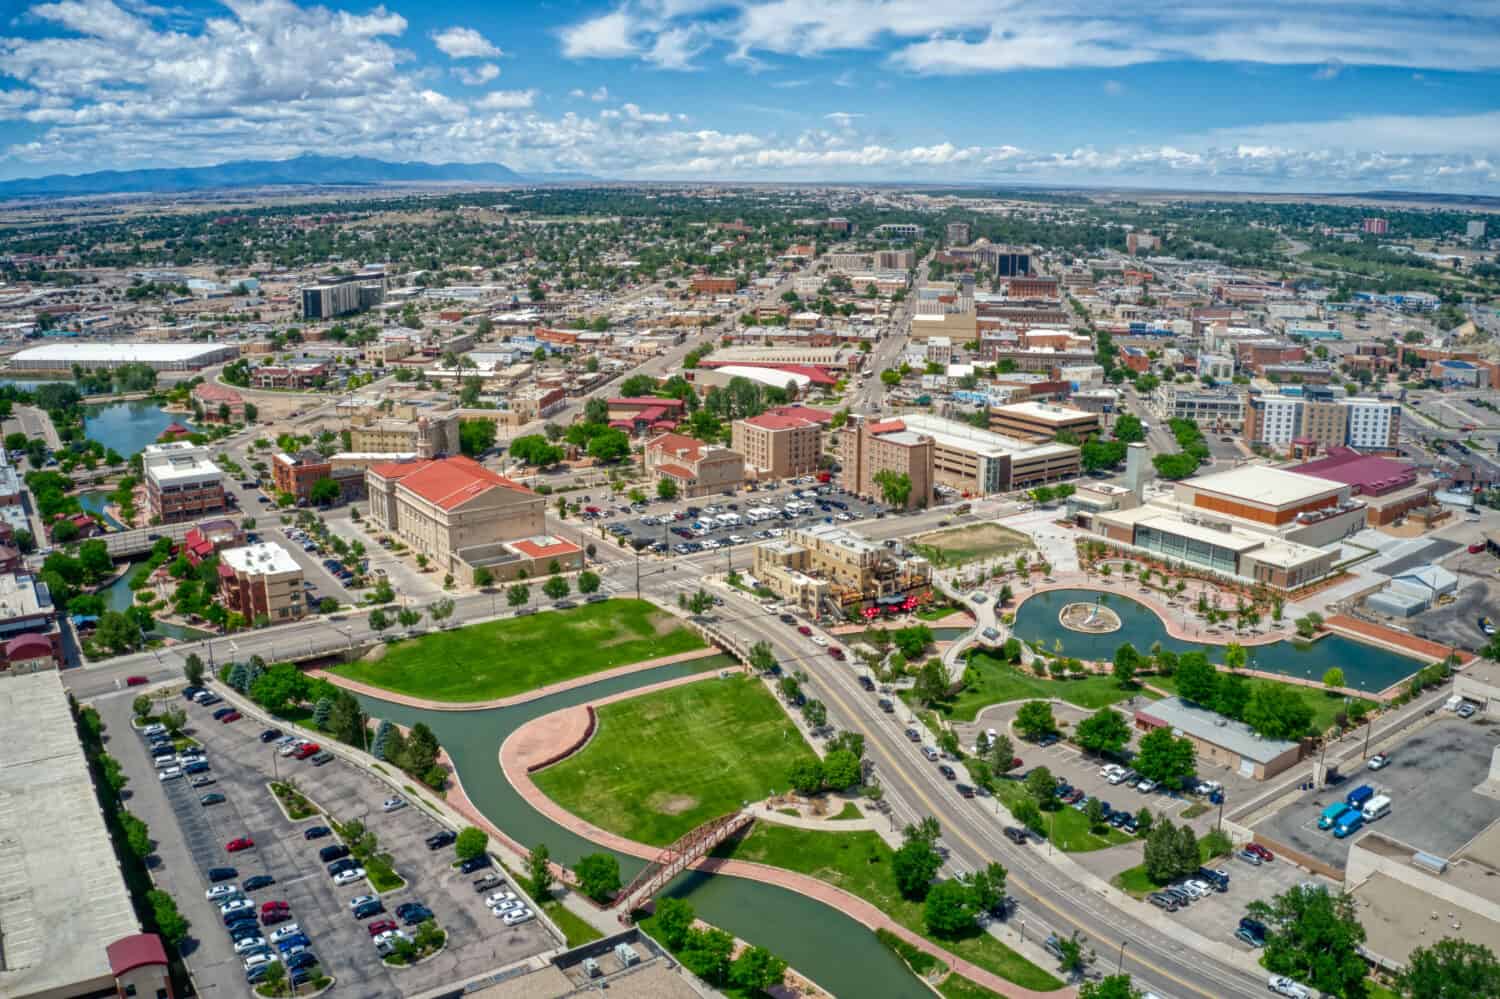
- Household income (median): $89,302 – the lowest of 7 metro areas in the state
- Statewide median household income: $89,302 – #8 highest of 50 states
- Poverty rate of the metro area: 24,389 (14.8% – #130 highest out of 384 U.S. metro areas)
- Households with an income of under $10,000: 4,485 (6.6% – #101 highest out of 384 U.S. metro areas)
- Population: 169,544
Connecticut: New Haven-Milford

- Household income (median): $88,429 – the lowest of 4 metro areas in the state
- Statewide median household income: $88,429 – #10 highest of 50 states
- Poverty rate of the metro area: 87,834 (10.5% – #303 highest out of 384 U.S. metro areas)
- Households with an income of under $10,000: 18,942 (5.5% – #187 highest out of 384 U.S. metro areas)
- Population: 870,163
Delaware: Dover

- Household income (median): $82,174 (only metro area in the state, lowest by default)
- Statewide median household income: $82,174 – #14 highest of 50 states
- Poverty rate of the metro area: 17,094 (9.4% – #336 highest out of 384 U.S. metro areas)
- Households with an income of under $10,000: 2,854 (3.9% – #342 highest out of 384 U.S. metro areas)
- Population: 186,946
Florida: Homosassa Springs

- Household income (median): $69,303 – the lowest of 22 metro areas in the state
- Statewide median household income: $69,303 – #33 highest of 50 states
- Poverty rate of the metro area: 29,597 (18.5% – #42 highest out of 384 U.S. metro areas)
- Households with an income of under $10,000: 4,327 (6.1% – #142 highest out of 384 U.S. metro areas)
- Population: 162,529
Georgia: Albany

- Household income (median): $72,837 – the lowest of 14 metro areas in the state
- Statewide median household income: $72,837 – #21 highest of 50 states
- Poverty rate of the metro area: 37,026 (26.2% – #2 highest out of 384 U.S. metro areas)
- Households with an income of under $10,000: 5,264 (9.1% – #18 highest out of 384 U.S. metro areas)
- Population: 146,387
Hawaii: Kahului-Wailuku-Lahaina

- Household income (median): $92,458 – the lowest of 2 metro areas in the state
- Statewide median household income: $92,458 – #4 highest of 50 states
- Poverty rate of the metro area: 13,326 (8.2% – #366 highest out of 384 U.S. metro areas)
- Households with an income of under $10,000: 1,812 (3.2% – #371 highest out of 384 U.S. metro areas)
- Population: 164,365
Idaho: Pocatello

- Household income (median): $72,785 – the lowest of 6 metro areas in the state
- Statewide median household income: $72,785 – #22 highest of 50 states
- Poverty rate of the metro area: 12,684 (13.2% – #181 highest out of 384 U.S. metro areas)
- Households with an income of under $10,000: 1,822 (4.9% – #254 highest out of 384 U.S. metro areas)
- Population: 98,560
Illinois: Danville

- Household income (median): $76,708 – the lowest of 10 metro areas in the state
- Statewide median household income: $76,708 – #17 highest of 50 states
- Poverty rate of the metro area: 11,640 (16.8% – #78 highest out of 384 U.S. metro areas)
- Households with an income of under $10,000: 1,999 (6.5% – #116 highest out of 384 U.S. metro areas)
- Population: 72,337
Indiana: Muncie

- Household income (median): $66,785 – the lowest of 12 metro areas in the state
- Statewide median household income: $66,785 – #38 highest of 50 states
- Poverty rate of the metro area: 19,540 (18.8% – #36 highest out of 384 U.S. metro areas)
- Households with an income of under $10,000: 3,774 (7.9% – #42 highest out of 384 U.S. metro areas)
- Population: 112,031
Iowa: Waterloo-Cedar Falls

- Household income (median): $69,588 – the lowest of 8 metro areas in the state
- Statewide median household income: $69,588 – #31 highest of 50 states
- Poverty rate of the metro area: 24,601 (15.3% – #114 highest out of 384 U.S. metro areas)
- Households with an income of under $10,000: 3,253 (4.7% – #276 highest out of 384 U.S. metro areas)
- Population: 167,889
Kansas: Manhattan

- Household income (median): $68,925 – the lowest of 4 metro areas in the state
- Statewide median household income: $68,925 – #34 highest of 50 states
- Poverty rate of the metro area: 21,286 (17.5% – #60 highest out of 384 U.S. metro areas)
- Households with an income of under $10,000: 3,726 (7.2% – #79 highest out of 384 U.S. metro areas)
- Population: 133,072
Kentucky: Bowling Green

- Household income (median): $59,341 – the lowest of 5 metro areas in the state
- Statewide median household income: $59,341 – #46 highest of 50 states
- Poverty rate of the metro area: 33,170 (18.5% – #41 highest out of 384 U.S. metro areas)
- Households with an income of under $10,000: 6,294 (8.7% – #29 highest out of 384 U.S. metro areas)
- Population: 184,636
Louisiana: Monroe

- Household income (median): $55,416 – the lowest of 9 metro areas in the state
- Statewide median household income: $55,416 – #48 highest of 50 states
- Poverty rate of the metro area: 48,925 (24.9% – #3 highest out of 384 U.S. metro areas)
- Households with an income of under $10,000: 9,265 (11.2% – #2 highest out of 384 U.S. metro areas)
- Population: 202,869
Maine: Bangor

- Household income (median): $69,543 – the lowest of the 3 metro areas in the state
- Statewide median household income: $69,543 – #32 highest of 50 states
- Poverty rate of the metro area: 22,358 (15.1% – #122 highest out of 384 U.S. metro areas)
- Households with an income of under $10,000: 3,865 (5.9% – #160 highest out of 384 U.S. metro areas)
- Population: 153,704
Maryland: Cumberland

- Household income (median): $94,991 – the lowest of 5 metro areas in the state
- Statewide median household income: $94,991 – #2 highest of 50 states
- Poverty rate of the metro area: 16,587 (18.9% – #33 highest out of 384 U.S. metro areas)
- Households with an income of under $10,000: 2,903 (7.9% – #45 highest out of 384 U.S. metro areas)
- Population: 94,122
Massachusetts: Springfield

- Household income (median): $94,488 – the lowest of 5 metro areas in the state
- Statewide median household income: $94,488 – #3 highest of 50 states
- Poverty rate of the metro area: 103,885 (15.7% – #101 highest out of 384 U.S. metro areas)
- Households with an income of under $10,000: 19,842 (7.1% – #80 highest out of 384 U.S. metro areas)
- Population: 694,523
Michigan: Saginaw
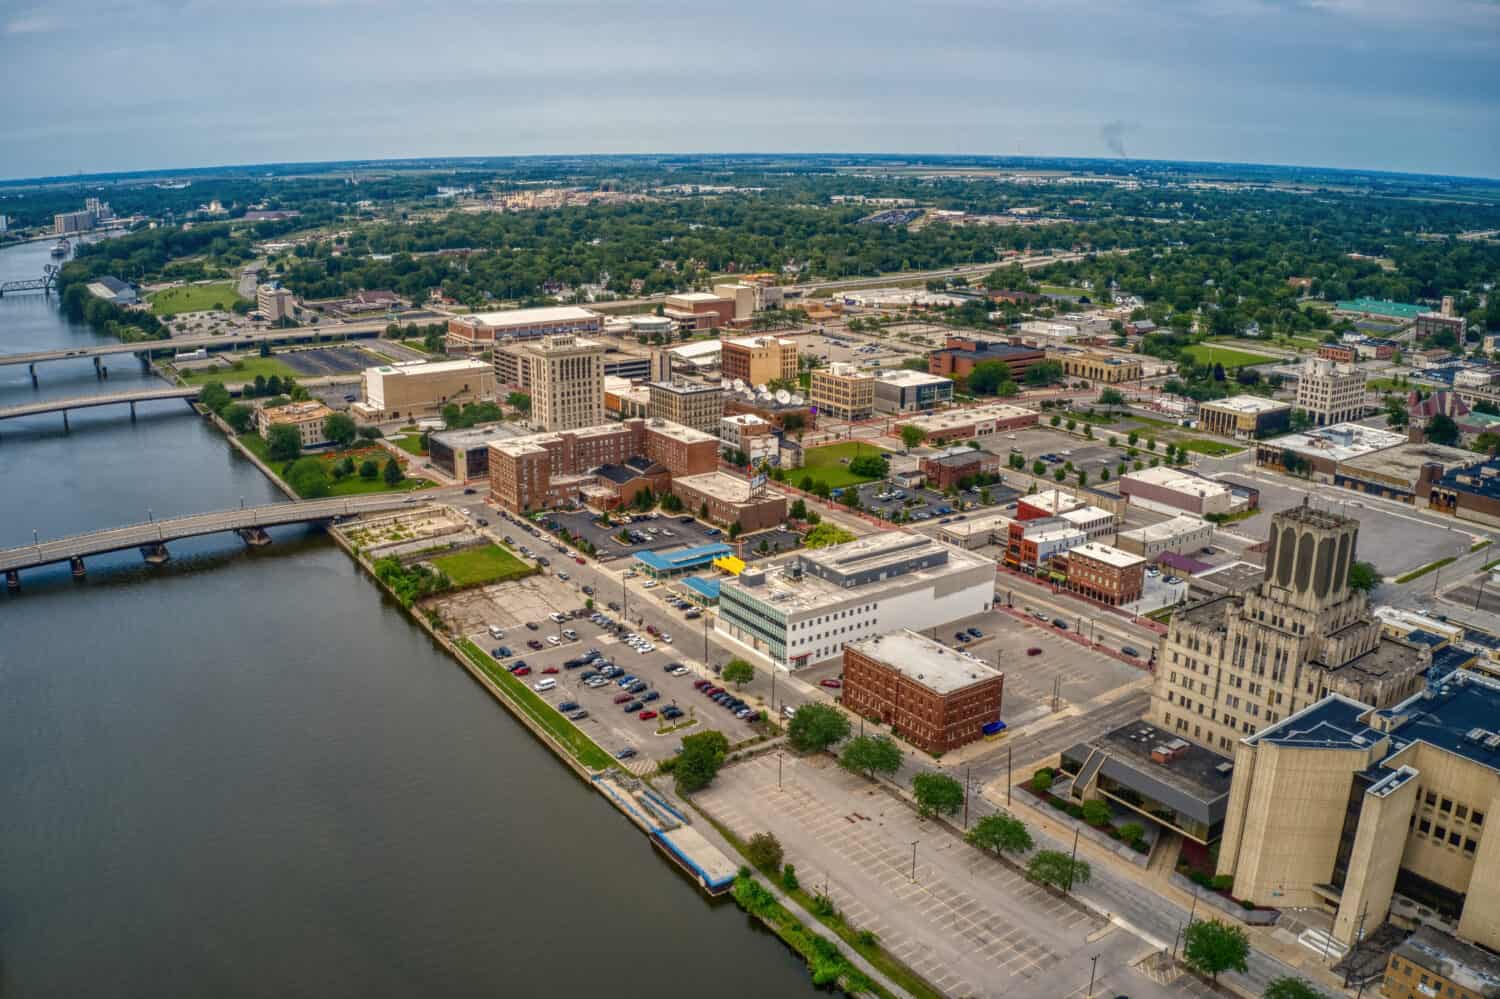
- Household income (median): $66,986 – the lowest of 14 metro areas in the state
- Statewide median household income: $66,986 – #37 highest of 50 states
- Poverty rate of the metro area: 33,598 (18.4% – #45 highest out of 384 U.S. metro areas)
- Households with an income of under $10,000: 6,108 (7.7% – #52 highest out of 384 U.S. metro areas)
- Population: 188,330
Minnesota: Duluth

- Household income (median): $82,338 – the lowest of 5 metro areas in the state
- Statewide median household income: $82,338 – #13 highest of 50 states
- Poverty rate of the metro area: 37,601 (13.2% – #179 highest out of 384 U.S. metro areas)
- Households with an income of under $10,000: 7,974 (6.3% – #121 highest out of 384 U.S. metro areas)
- Population: 291,931
Mississippi: Hattiesburg

- Household income (median): $52,719 – the lowest of the 3 metro areas in the state
- Statewide median household income: $52,719 – #50 highest of 50 states
- Poverty rate of the metro area: 33,197 (20.0% – #20 highest out of 384 U.S. metro areas)
- Households with an income of under $10,000: 4,915 (7.4% – #71 highest out of 384 U.S. metro areas)
- Population: 172,263
Missouri: Joplin
- Household income (median): $64,811 – the lowest of 8 metro areas in the state
- Statewide median household income: $64,811 – #41 highest of 50 states
- Poverty rate of the metro area: 32,842 (18.3% – #47 highest out of 384 U.S. metro areas)
- Households with an income of under $10,000: 3,702 (5.2% – #214 highest out of 384 U.S. metro areas)
- Population: 184,086
Montana: Great Falls

- Household income (median): $67,631 – the lowest of 3 metro areas in the state
- Statewide median household income: $67,631 – #35 highest of 50 states
- Poverty rate of the metro area: 12,275 (14.9% – #126 highest out of 384 U.S. metro areas)
- Households with an income of under $10,000: 1,674 (4.7% – #269 highest out of 384 U.S. metro areas)
- Population: 84,864
Nebraska: Lincoln

- Household income (median): $69,597 – the lowest of the 3 metro areas in the state
- Statewide median household income: $69,597 – #30 highest of 50 states
- Poverty rate of the metro area: 41,309 (12.7% – #207 highest out of 384 U.S. metro areas)
- Households with an income of under $10,000: 7,717 (5.6% – #175 highest out of 384 U.S. metro areas)
- Population: 341,229
Nevada: Carson City

- Household income (median): $72,333 – the lowest of the 3 metro areas in the state
- Statewide median household income: $72,333 – #23 highest of 50 states
- Poverty rate of the metro area: 8,438 (15.4% – #109 highest out of 384 U.S. metro areas)
- Households with an income of under $10,000: 1,506 (6.5% – #114 highest out of 384 U.S. metro areas)
- Population: 58,130
New Hampshire: Manchester-Nashua

- Household income (median): $89,992 (only metro area in the state, lowest by default)
- Statewide median household income: $89,992 – #7 highest of 50 states
- Poverty rate of the metro area: 25,980 (6.2% – #383 highest out of 384 U.S. metro areas)
- Households with an income of under $10,000: 3,996 (2.4% – #382 highest out of 384 U.S. metro areas)
- Population: 426,594
New Jersey: Vineland-Bridgeton

- Household income (median): $96,346 – the lowest of 4 metro areas in the state
- Statewide median household income: $96,346 – #1 highest of 50 states
- Poverty rate of the metro area: 22,154 (15.3% – #113 highest out of 384 U.S. metro areas)
- Households with an income of under $10,000: 2,512 (4.6% – #287 highest out of 384 U.S. metro areas)
- Population: 151,356
New Mexico: Farmington

- Household income (median): $59,726 – the lowest of 4 metro areas in the state
- Statewide median household income: $59,726 – #43 highest of 50 states
- Poverty rate of the metro area: 28,693 (24.1% – #6 highest out of 384 U.S. metro areas)
- Households with an income of under $10,000: 3,752 (9.0% – #23 highest out of 384 U.S. metro areas)
- Population: 120,418
New York: Elmira

- Household income (median): $79,557 – the lowest of 13 metro areas in the state
- Statewide median household income: $79,557 – #16 highest of 50 states
- Poverty rate of the metro area: 12,348 (15.8% – #99 highest out of 384 U.S. metro areas)
- Households with an income of under $10,000: 1,859 (5.4% – #192 highest out of 384 U.S. metro areas)
- Population: 81,426
North Carolina: Rocky Mount

- Household income (median): $67,481 – the lowest of 15 metro areas in the state
- Statewide median household income: $67,481 – #36 highest of 50 states
- Poverty rate of the metro area: 20,187 (14.2% – #151 highest out of 384 U.S. metro areas)
- Households with an income of under $10,000: 3,987 (6.8% – #94 highest out of 384 U.S. metro areas)
- Population: 144,090
North Dakota: Grand Forks
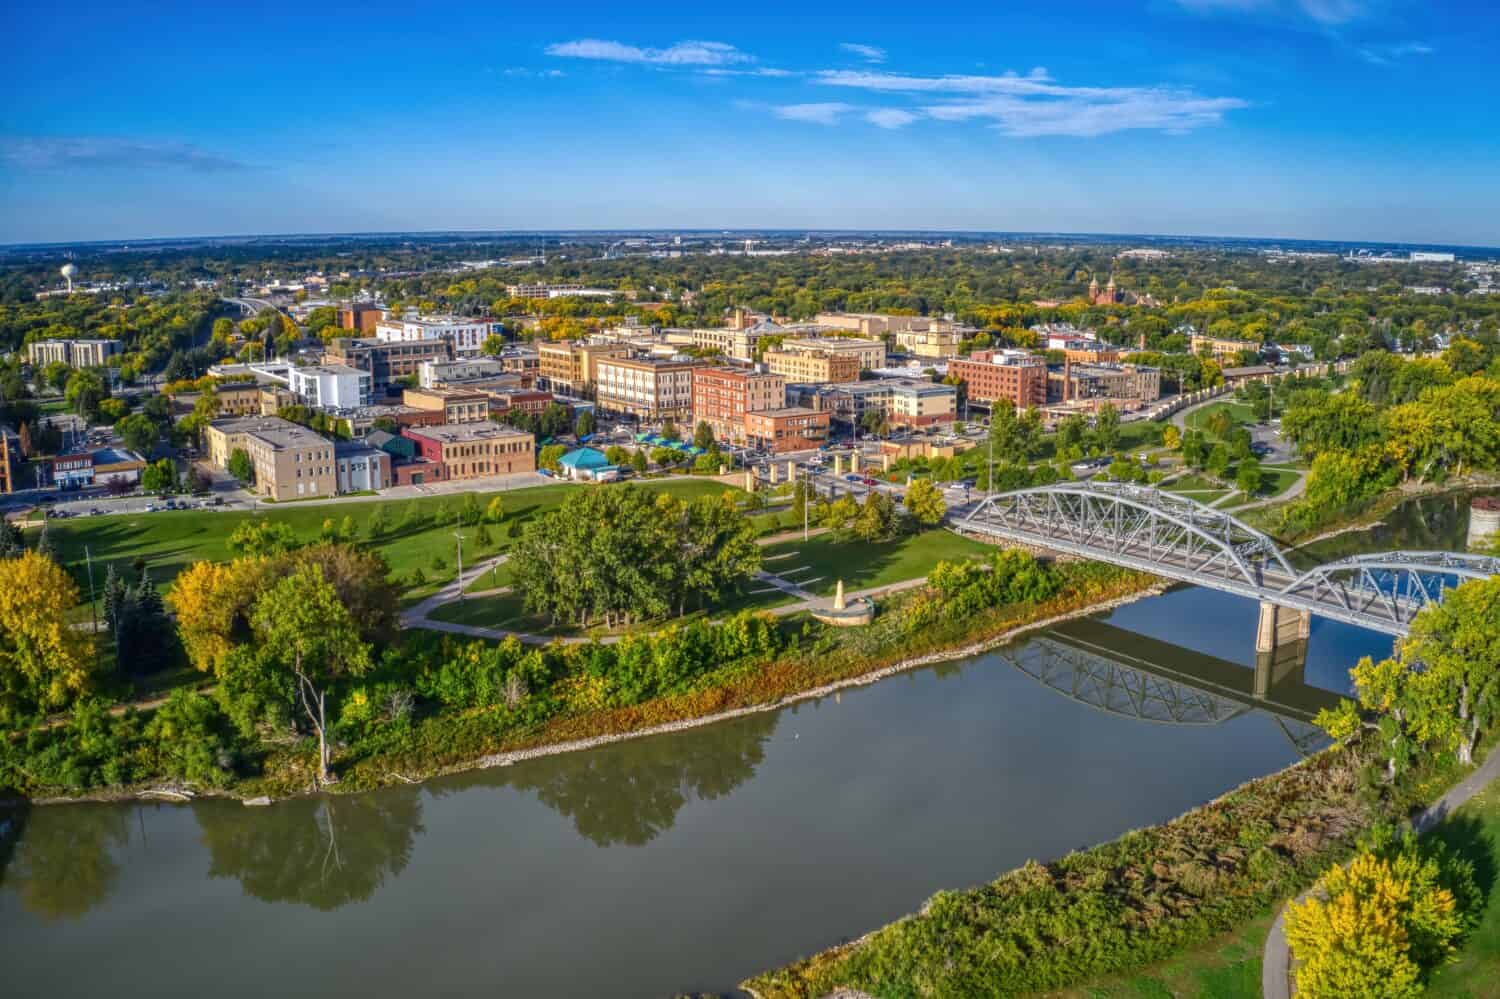
- Household income (median): $71,970 – the lowest of the 3 metro areas in the state
- Statewide median household income: $71,970 – #25 highest of 50 states
- Poverty rate of the metro area: 12,127 (12.5% – #217 highest out of 384 U.S. metro areas)
- Households with an income of under $10,000: 2,996 (7.0% – #86 highest out of 384 U.S. metro areas)
- Population: 103,144
Ohio: Mansfield

- Household income (median): $65,720 – the lowest of 11 metro areas in the state
- Statewide median household income: $65,720 – #39 highest of 50 states
- Poverty rate of the metro area: 17,898 (15.2% – #117 highest out of 384 U.S. metro areas)
- Households with an income of under $10,000: 2,326 (4.6% – #282 highest out of 384 U.S. metro areas)
- Population: 125,319
Oklahoma: Enid

- Household income (median): $59,673 – the lowest of 4 metro areas in the state
- Statewide median household income: $59,673 – #45 highest of 50 states
- Poverty rate of the metro area: 9,611 (16.1% – #91 highest out of 384 U.S. metro areas)
- Households with an income of under $10,000: 1,158 (5.0% – #236 highest out of 384 U.S. metro areas)
- Population: 61,920
Oregon: Grants Pass
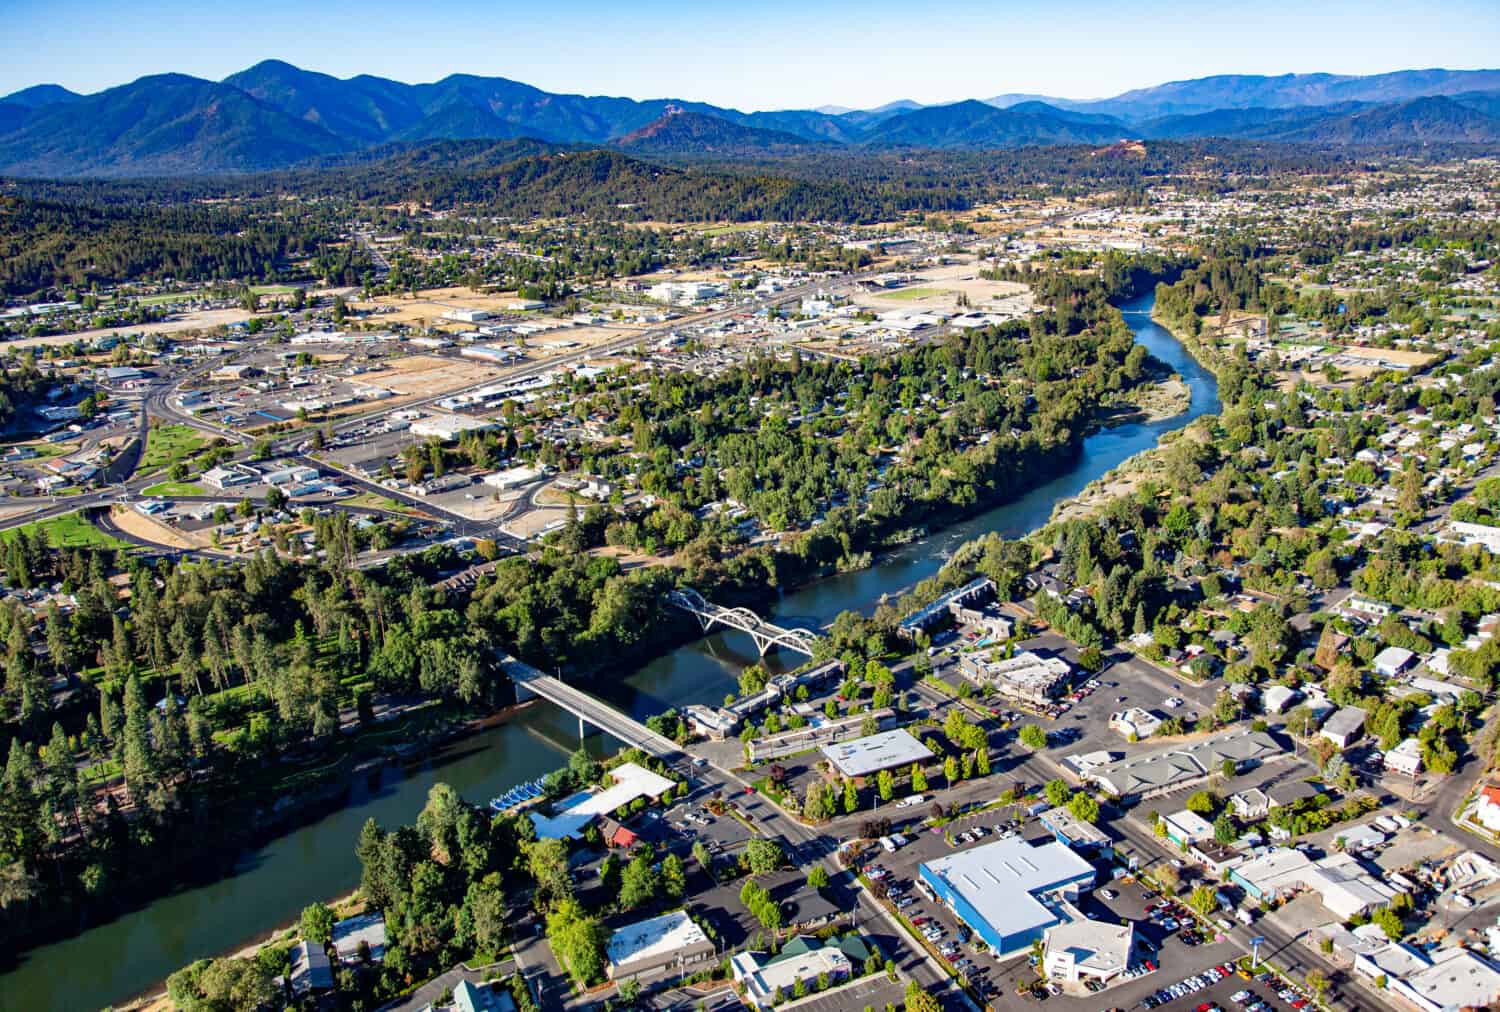
- Household income (median): $75,657 – the lowest of 8 metro areas in the state
- Statewide median household income: $75,657 – #18 highest of 50 states
- Poverty rate of the metro area: 16,458 (19.0% – #32 highest out of 384 U.S. metro areas)
- Households with an income of under $10,000: 3,304 (9.0% – #24 highest out of 384 U.S. metro areas)
- Population: 87,730
Pennsylvania: Johnstown

- Household income (median): $71,798 – the lowest of 18 metro areas in the state
- Statewide median household income: $71,798 – #26 highest of 50 states
- Poverty rate of the metro area: 21,104 (16.8% – #79 highest out of 384 U.S. metro areas)
- Households with an income of under $10,000: 4,061 (7.4% – #73 highest out of 384 U.S. metro areas)
- Population: 131,441
Rhode Island: Providence-Warwick

- Household income (median): $81,854 (only metro area in the state, lowest by default)
- Statewide median household income: $81,854 – #15 highest of 50 states
- Poverty rate of the metro area: 178,889 (11.0% – #272 highest out of 384 U.S. metro areas)
- Households with an income of under $10,000: 37,768 (5.6% – #177 highest out of 384 U.S. metro areas)
- Population: 1,673,802
South Carolina: Florence

- Household income (median): $64,115 – the lowest of 8 metro areas in the state
- Statewide median household income: $64,115 – #42 highest of 50 states
- Poverty rate of the metro area: 41,125 (21.1% – #12 highest out of 384 U.S. metro areas)
- Households with an income of under $10,000: 7,216 (9.1% – #21 highest out of 384 U.S. metro areas)
- Population: 199,119
South Dakota: Rapid City

- Household income (median): $69,728 – the lowest of 2 metro areas in the state
- Statewide median household income: $69,728 – #29 highest of 50 states
- Poverty rate of the metro area: 17,767 (12.7% – #206 highest out of 384 U.S. metro areas)
- Households with an income of under $10,000: 2,751 (4.6% – #285 highest out of 384 U.S. metro areas)
- Population: 144,890
Tennessee: Kingsport-Bristol

- Household income (median): $65,254 – the lowest of 10 metro areas in the state
- Statewide median household income: $65,254 – #40 highest of 50 states
- Poverty rate of the metro area: 44,438 (14.5% – #135 highest out of 384 U.S. metro areas)
- Households with an income of under $10,000: 7,265 (5.5% – #188 highest out of 384 U.S. metro areas)
- Population: 310,483
Texas: Texarkana
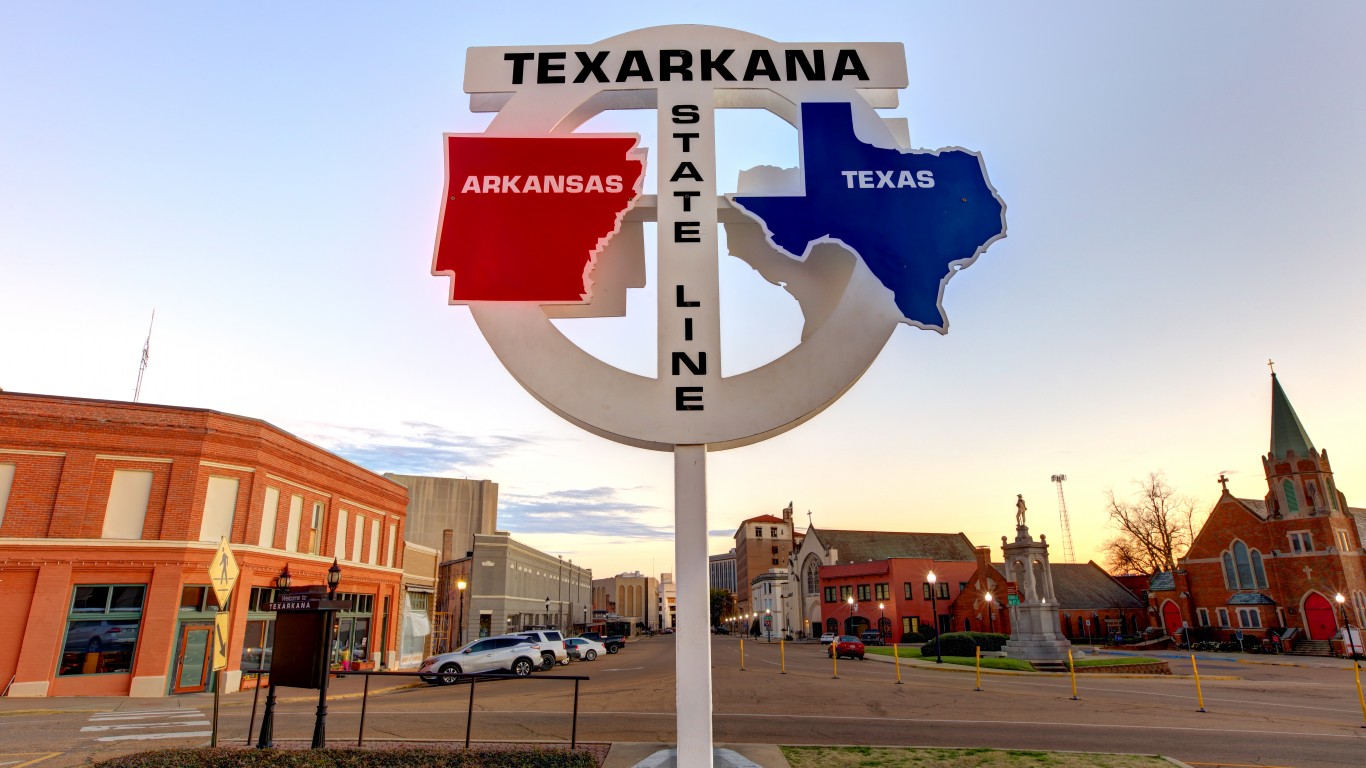
- Household income (median): $72,284 – the lowest of 25 metro areas in the state
- Statewide median household income: $72,284 – #24 highest of 50 states
- Poverty rate of the metro area: 29,830 (21.6% – #10 highest out of 384 U.S. metro areas)
- Households with an income of under $10,000: 6,031 (10.8% – #5 highest out of 384 U.S. metro areas)
- Population: 144,322
Utah: St. George

- Household income (median): $89,168 – the lowest of 5 metro areas in the state
- Statewide median household income: $89,168 – #9 highest of 50 states
- Poverty rate of the metro area: 20,179 (10.3% – #308 highest out of 384 U.S. metro areas)
- Households with an income of under $10,000: 1,969 (2.7% – #380 highest out of 384 U.S. metro areas)
- Population: 197,680
Vermont: Burlington-South Burlington

- Household income (median): $73,991 (only metro area in the state, lowest by default)
- Statewide median household income: $73,991 – #20 highest of 50 states
- Poverty rate of the metro area: 22,814 (10.5% – #301 highest out of 384 U.S. metro areas)
- Households with an income of under $10,000: 4,654 (4.8% – #262 highest out of 384 U.S. metro areas)
- Population: 228,270
Virginia: Lynchburg

- Household income (median): $85,873 – the lowest of 9 metro areas in the state
- Statewide median household income: $85,873 – #12 highest of 50 states
- Poverty rate of the metro area: 32,466 (13.0% – #191 highest out of 384 U.S. metro areas)
- Households with an income of under $10,000: 4,757 (4.6% – #280 highest out of 384 U.S. metro areas)
- Population: 262,458
Washington: Yakima

- Household income (median): $91,306 – the lowest of 11 metro areas in the state
- Statewide median household income: $91,306 – #6 highest of 50 states
- Poverty rate of the metro area: 42,108 (16.6% – #82 highest out of 384 U.S. metro areas)
- Households with an income of under $10,000: 4,661 (5.3% – #202 highest out of 384 U.S. metro areas)
- Population: 257,001
West Virginia: Beckley

- Household income (median): $54,329 – the lowest of 7 metro areas in the state
- Statewide median household income: $54,329 – #49 highest of 50 states
- Poverty rate of the metro area: 21,439 (19.8% – #21 highest out of 384 U.S. metro areas)
- Households with an income of under $10,000: 4,452 (10.1% – #9 highest out of 384 U.S. metro areas)
- Population: 112,369
Wisconsin: Sheboygan
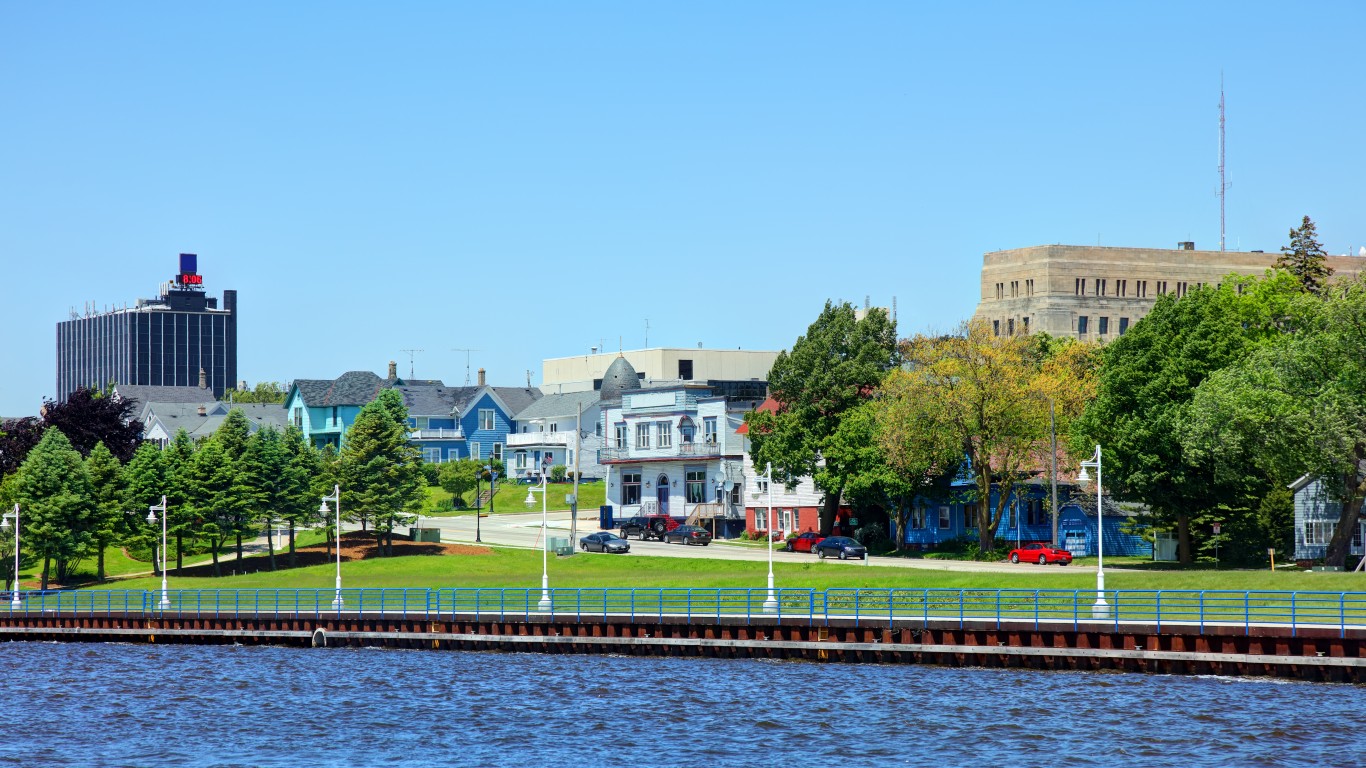
- Household income (median): $70,996 – the lowest of 12 metro areas in the state
- Statewide median household income: $70,996 – #27 highest of 50 states
- Poverty rate of the metro area: 11,395 (10.0% – #320 highest out of 384 U.S. metro areas)
- Households with an income of under $10,000: 2,999 (5.9% – #150 highest out of 384 U.S. metro areas)
- Population: 117,841
Wyoming: Casper
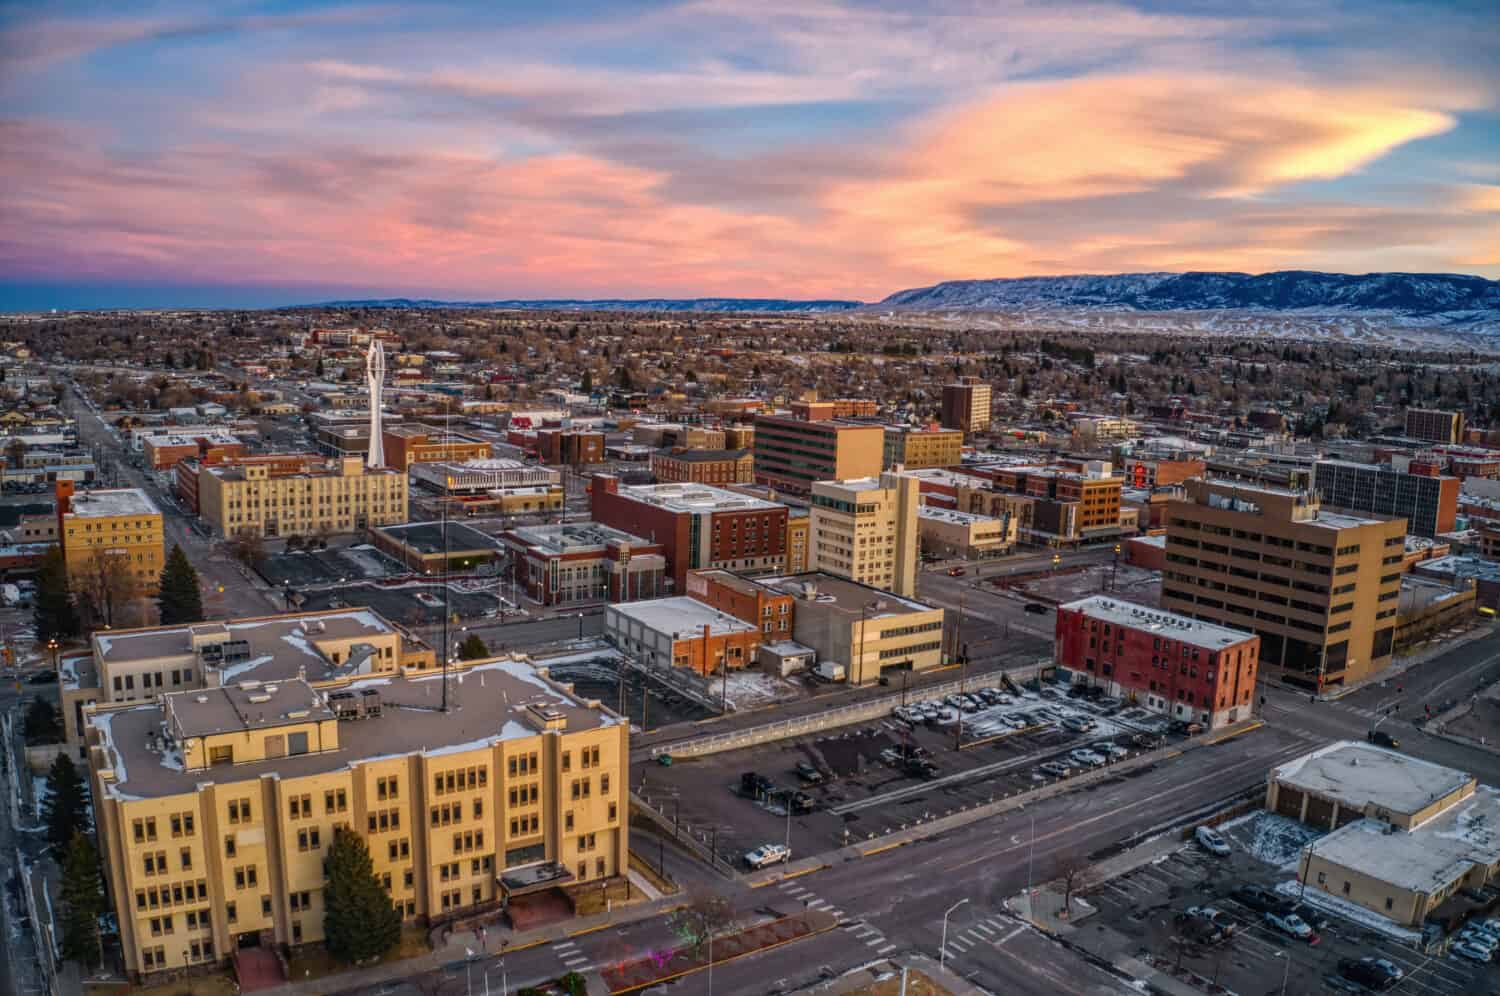
- Household income (median): $70,042 – the lowest of 2 metro areas in the state
- Statewide median household income: $70,042 – #28 highest of 50 states
- Poverty rate of the metro area: 7,047 (9.0% – #347 highest out of 384 U.S. metro areas)
- Households with an income of under $10,000: 1,031 (3.1% – #373 highest out of 384 U.S. metro areas)
- Population: 79,601
ALERT: Take This Retirement Quiz Now (Sponsored)
Take the quiz below to get matched with a financial advisor today.
Each advisor has been vetted by SmartAsset and is held to a fiduciary standard to act in your best interests.
Here’s how it works:
1. Answer SmartAsset advisor match quiz
2. Review your pre-screened matches at your leisure. Check out the advisors’ profiles.
3. Speak with advisors at no cost to you. Have an introductory call on the phone or introduction in person and choose whom to work with in the future
Take the retirement quiz right here.
The post Poorest City in Every US State appeared first on 24/7 Wall St..