Hate crimes, or illegal acts motivated by prejudice towards certain groups, have surged in the U.S. in recent years. The FBI reported 11,288 hate crimes in 2022, up 7% from 2021 and a more than 40% increase from 2020. As hate crimes have become more common, the ideologies that motivate them have also gained wider traction. According to the nonprofit legal advocacy group Southern Poverty Law Center, there were 1,430 active hate and anti-government extremist groups nationwide in 2023 — 205 more than in 2022, and 209 more than in 2021.
The extremist groups tracked by the SPLC range from well-known organizations like the Proud Boys and the Ku Klux Klan, to lesser known groups, like Patriot Front and VDARE. Simply belonging to any one of these, or other similar organizations, is not a crime — but many of the actions inspired by the ideologies they espouse are. These beliefs include, but are not limited to, anti-semitism, anti-LGBTQ, white nationalism, and neo-Nazism.
While each of the 50 states are home to multiple extremist organizations, in some parts of the country, hate and anti-government groups are especially common.
Using data from the SPLC report The Year in Hate & Extremism 2023, 24/7 Wall St. identified the 20 states with the most hate groups. States are ranked by the total number of hate and anti-government groups for every million residents. Only states home to at least 10 extremist groups were considered. Population figures used for our calculation are from the U.S. Census Bureau’s 2022 American Community Survey.
Nationwide, there are 4.3 hate groups for every 1 million Americans. Among the states on this list, the concentration of hate groups ranges from 4.8 to 15.1 for every 1 million people. Like the country as a whole, most of these states — 16 out of 20 — reported an increase in the number of known hate groups in the last year. In most cases, increases ranged between 10% and 50%. Of the four states on this list where the number of hate groups fell or remained unchanged in 2023, declines were relatively modest, falling between 3% and 6%.
In a majority of these states, the most common extremist group, as measured by total chapters, is an organization known as Moms for Liberty. Founded in 2021 out of opposition to COVID-19 restrictions, Moms for Liberty advocates book bans and opposes racial and LGBTQ+ inclusive school curriculums, according to SPLC. Other common groups in these states include the Oath Keepers, a far-right anti-government organization, the Nationalist Social Club, a neo-Nazi group, and the white nationalist organization, Patriot Front. (Here is a look at the largest hate groups in the United States.)
Notably, by several measures, most states on this list have less diverse populations than the U.S. as a whole. Nationwide, 57.7% of the population identify only as white, according to the 2022 ACS. In all but two states on this list, white residents account for a larger-than-average share of the population. Similarly, in most of these states, over 90% of residents were born in the United States, compared to 86% of the population nationwide. (Here is a look at the most diverse neighborhoods in the United States.)
Why It Matters

Rates of hate crime and domestic terrorism have been climbing for years in the United States. Many of these offenses are committed by individuals who have been radicalized by racist, homophobic, ethnocentric, or anti-government ideologies – ideologies that are widely propagated by extremist hate groups. While every American has the right to adhere to any belief system they choose, it is likely no coincidence that as hate crime rates have been rising in recent years, so too have the number of extremist groups.
20. Wisconsin
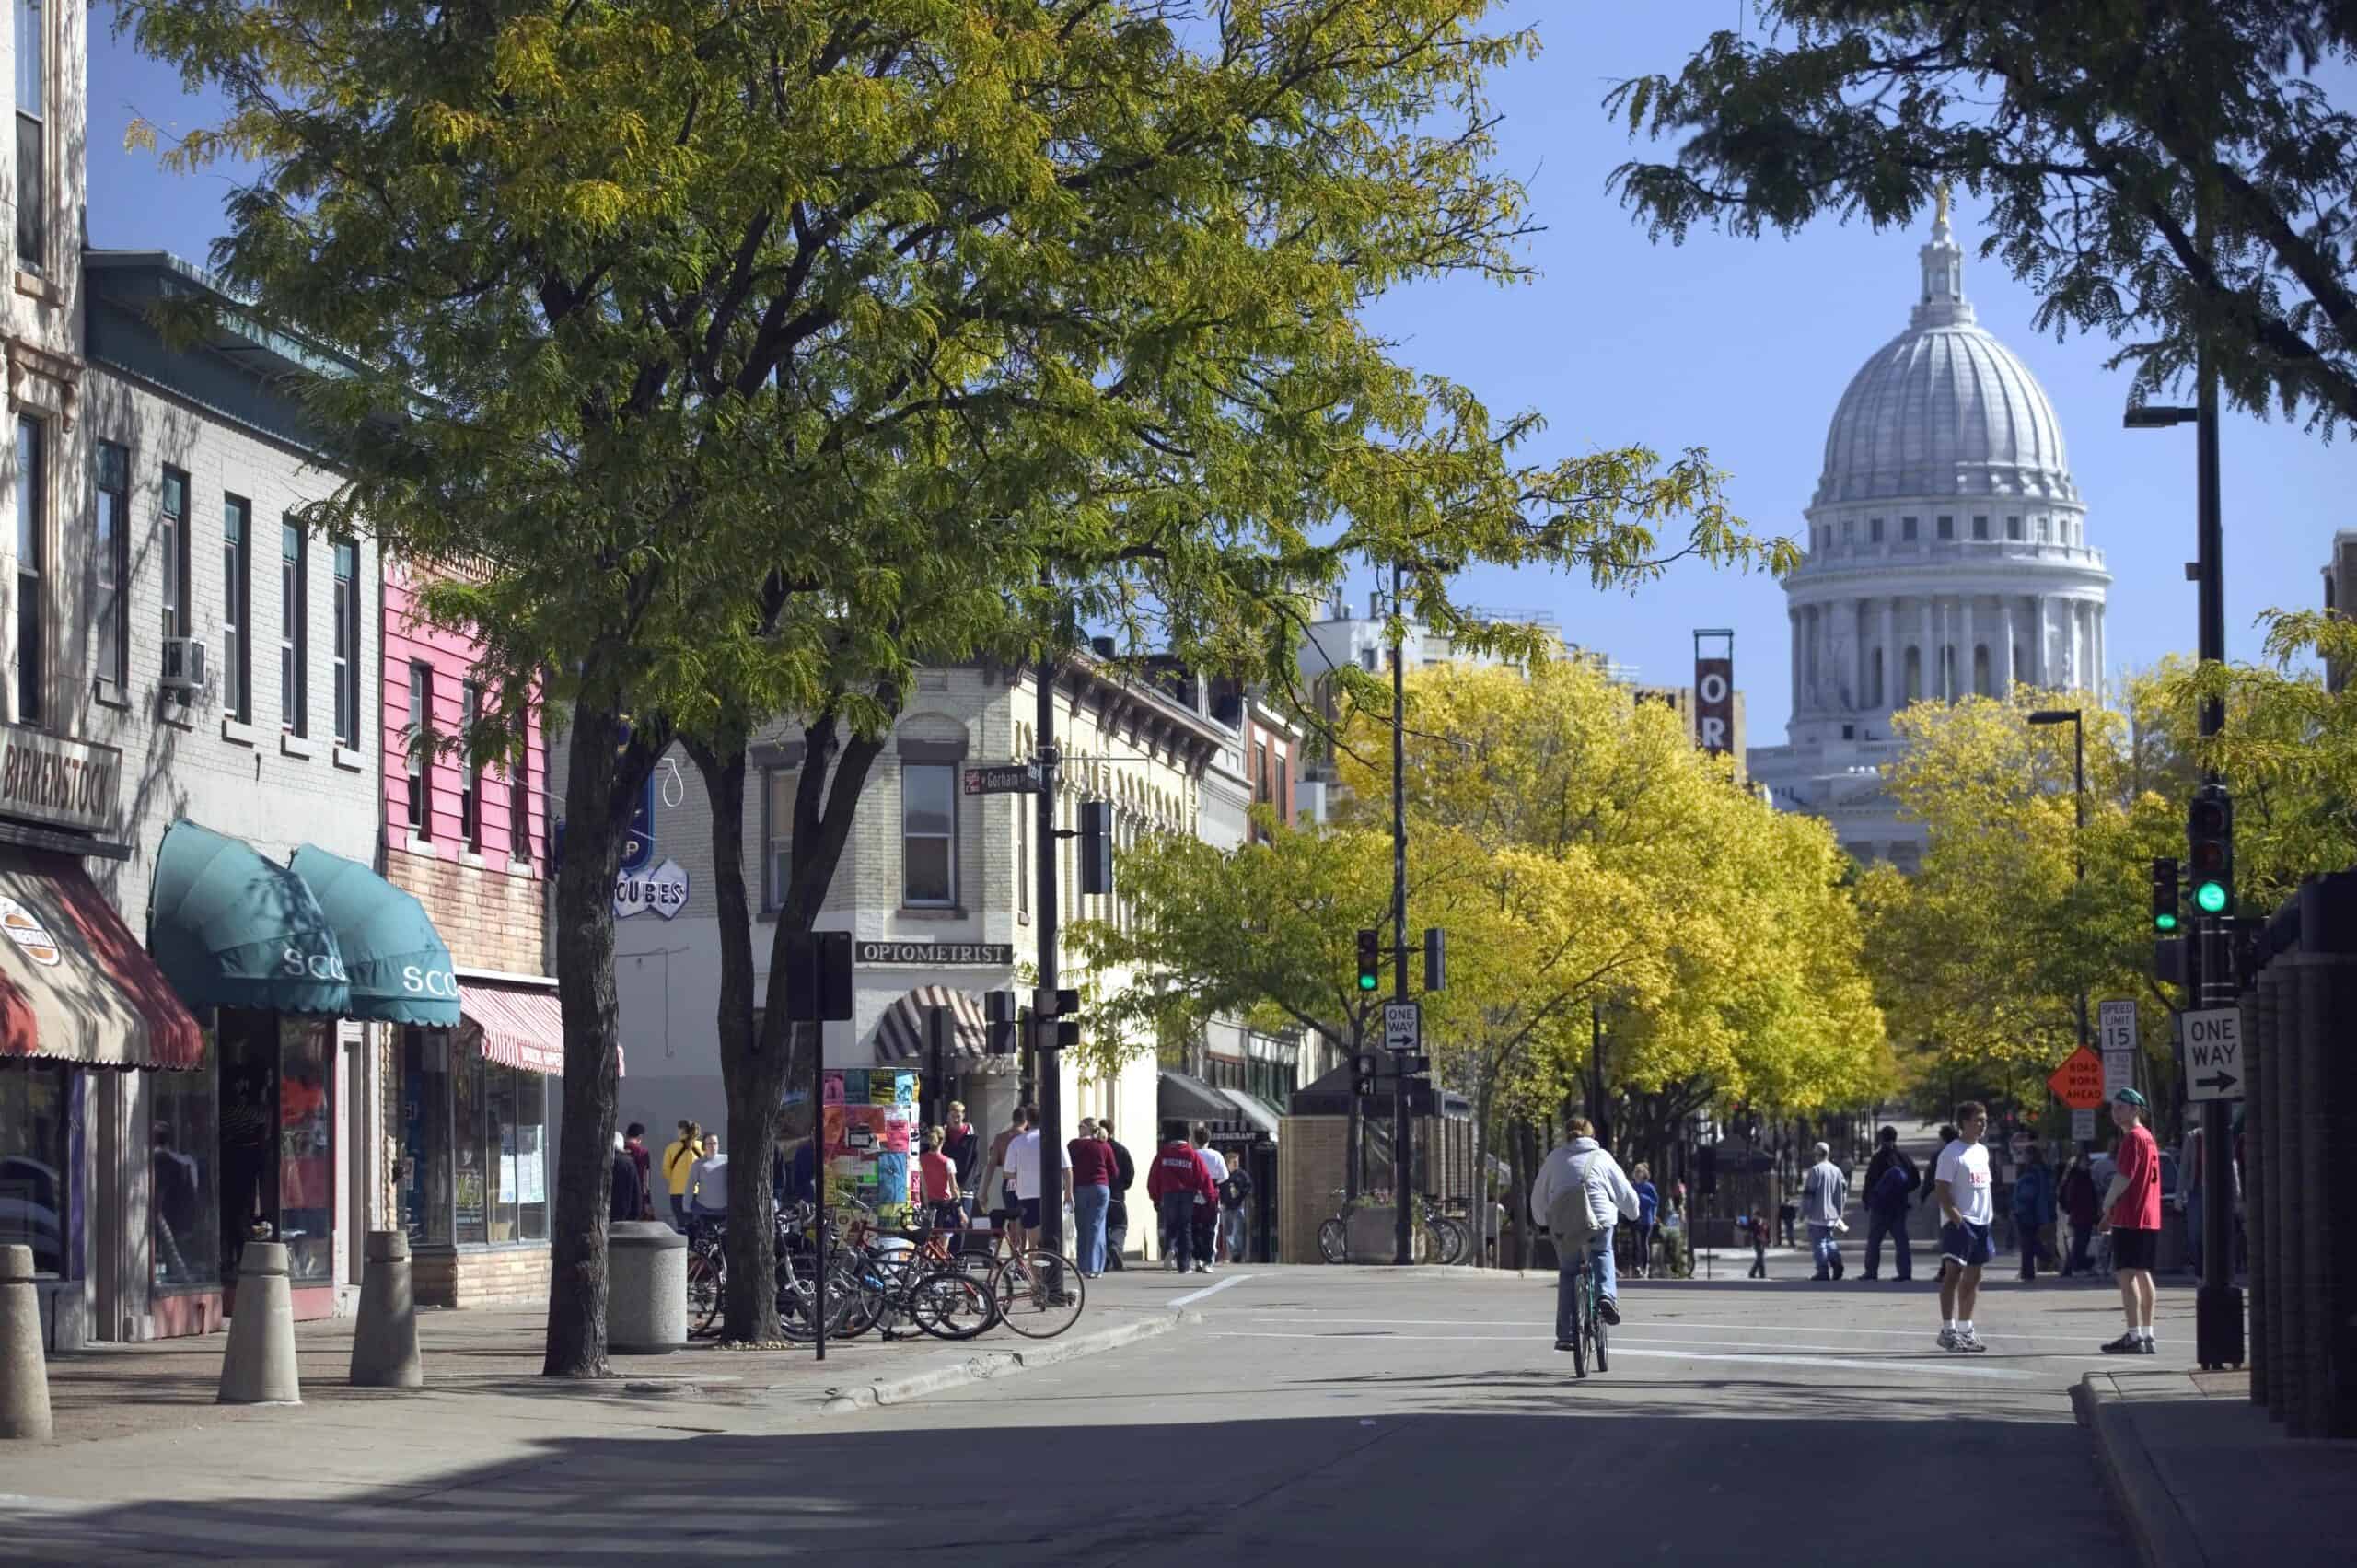
- Hate groups in 2023: 4.8 per million people (28 total)
- Most common group(s): Moms for Liberty (11 chapters)
- Most common ideologies: Anti-government (13 groups), Anti-LGBTQ, White Nationalist (3 groups each)
- Statewide racial and ethnic makeup: 79.0% White; 5.9% Black, 2.9% Asian; 7.6% Hispanic or Latino
- State nationality demographics: 95.0% native; 2.4% naturalized U.S. citizen; 2.6% foreign-born non-U.S. citizen
19. Arkansas

- Hate groups in 2023: 4.9 per million people (15 total)
- Most common group(s): Moms for Liberty (6 chapters)
- Most common ideologies: Anti-government (9 groups), White Nationalist (3 groups)
- Statewide racial and ethnic makeup: 67.5% White; 14.3% Black, 1.6% Asian; 8.4% Hispanic or Latino
- State nationality demographics: 94.9% native; 1.9% naturalized U.S. citizen; 3.3% foreign-born non-U.S. citizen
18. Florida

- Hate groups in 2023: 5.1 per million people (114 total)
- Most common group(s): Moms for Liberty (32 chapters)
- Most common ideologies: Anti-government (58 groups), General Hate (9 groups)
- Statewide racial and ethnic makeup: 50.8% White; 14.6% Black, 2.8% Asian; 27.1% Hispanic or Latino
- State nationality demographics: 78.3% native; 12.6% naturalized U.S. citizen; 9.1% foreign-born non-U.S. citizen
17. Colorado
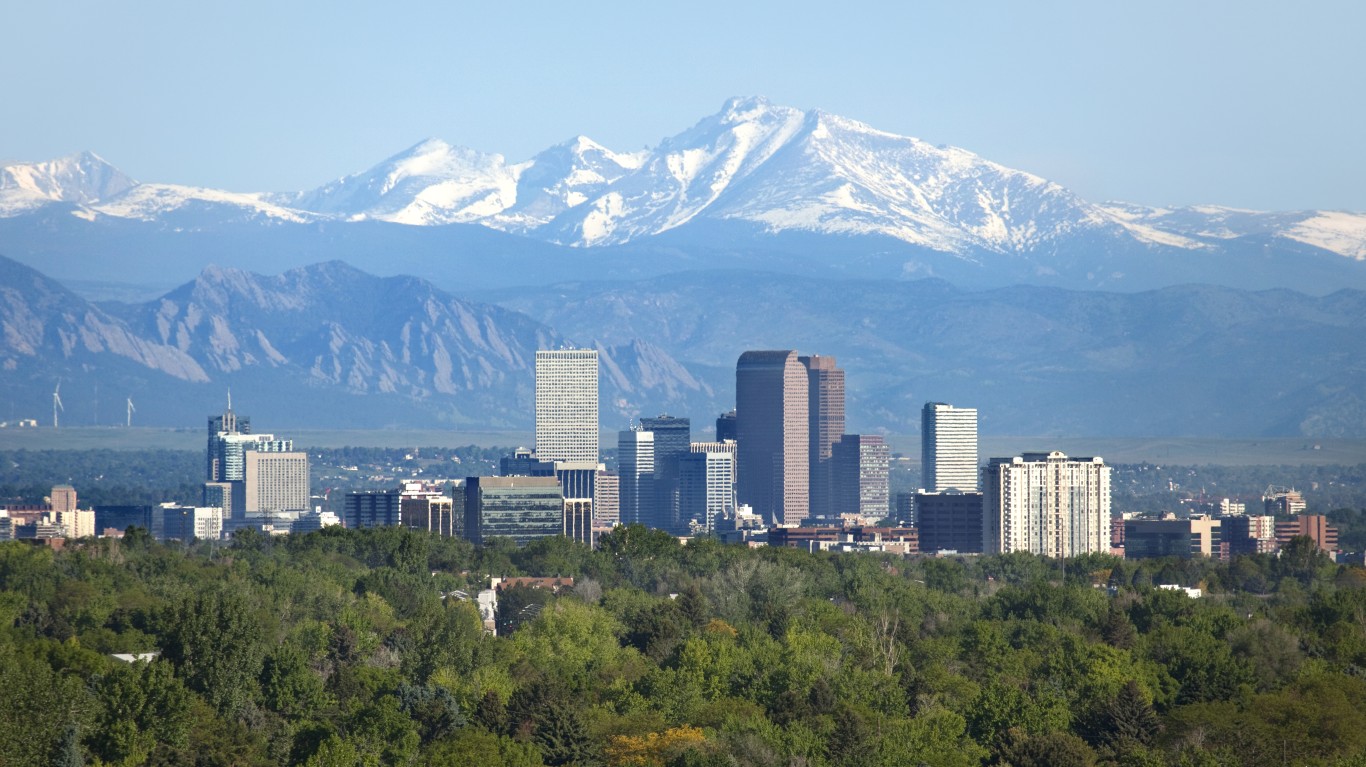
- Hate groups in 2023: 5.1 per million people (30 total)
- Most common group(s): Moms for Liberty (4 chapters)
- Most common ideologies: Anti-government (10 groups), Anti-LGBTQ, Sovereign Citizens Movement (4 groups each)
- Statewide racial and ethnic makeup: 65.0% White; 3.8% Black, 3.1% Asian; 22.5% Hispanic or Latino
- State nationality demographics: 90.5% native; 4.7% naturalized U.S. citizen; 4.9% foreign-born non-U.S. citizen
16. Virginia

- Hate groups in 2023: 5.2 per million people (45 total)
- Most common group(s): Moms for Liberty (9 chapters)
- Most common ideologies: Anti-government (20 groups), White Nationalist (6 groups)
- Statewide racial and ethnic makeup: 58.7% White; 18.4% Black, 6.9% Asian; 10.4% Hispanic or Latino
- State nationality demographics: 87.3% native; 7.5% naturalized U.S. citizen; 5.3% foreign-born non-U.S. citizen
15. Tennessee

- Hate groups in 2023: 5.3 per million people (37 total)
- Most common group(s): Moms for Liberty (6 chapters)
- Most common ideologies: Anti-government (14 groups), White Nationalist (6 groups)
- Statewide racial and ethnic makeup: 71.9% White; 15.5% Black, 1.9% Asian; 6.3% Hispanic or Latino
- State nationality demographics: 94.4% native; 2.3% naturalized U.S. citizen; 3.3% foreign-born non-U.S. citizen
14. Washington

- Hate groups in 2023: 5.3 per million people (41 total)
- Most common group(s): Moms for Liberty (10 chapters)
- Most common ideologies: Anti-government (16 groups), Anti-LGBTQ (5 groups)
- Statewide racial and ethnic makeup: 63.5% White; 3.8% Black, 9.7% Asian; 14.0% Hispanic or Latino
- State nationality demographics: 84.7% native; 7.5% naturalized U.S. citizen; 7.8% foreign-born non-U.S. citizen
13. Arizona

- Hate groups in 2023: 5.3 per million people (39 total)
- Most common group(s): Moms for Liberty (2 chapters)
- Most common ideologies: Anti-government (9 groups), Anti-LGBTQ, Militia Movement, White Nationalist (5 groups each)
- Statewide racial and ethnic makeup: 51.8% White; 4.4% Black, 3.5% Asian; 32.5% Hispanic or Latino
- State nationality demographics: 86.9% native; 6.5% naturalized U.S. citizen; 6.6% foreign-born non-U.S. citizen
12. Oregon

- Hate groups in 2023: 5.4 per million people (23 total)
- Most common group(s): Proud Boys (3 chapters)
- Most common ideologies: Anti-government (10 groups), General Hate (4 groups)
- Statewide racial and ethnic makeup: 71.6% White; 1.8% Black, 4.5% Asian; 14.4% Hispanic or Latino
- State nationality demographics: 90.1% native; 4.8% naturalized U.S. citizen; 5.2% foreign-born non-U.S. citizen
11. Utah

- Hate groups in 2023: 5.9 per million people (20 total)
- Most common group(s): Oath Keepers (2 chapters)
- Most common ideologies: Anti-government (14 groups), White Nationalist (3 groups)
- Statewide racial and ethnic makeup: 75.6% White; 1.0% Black, 2.4% Asian; 15.1% Hispanic or Latino
- State nationality demographics: 91.4% native; 3.6% naturalized U.S. citizen; 5.0% foreign-born non-U.S. citizen
10. Pennsylvania

- Hate groups in 2023: 6.0 per million people (78 total)
- Most common group(s): Moms for Liberty (26 chapters)
- Most common ideologies: Anti-government (48 groups), White Nationalist (9 groups)
- Statewide racial and ethnic makeup: 73.1% White; 10.1% Black, 3.8% Asian; 8.6% Hispanic or Latino
- State nationality demographics: 92.5% native; 4.3% naturalized U.S. citizen; 3.3% foreign-born non-U.S. citizen
9. South Carolina
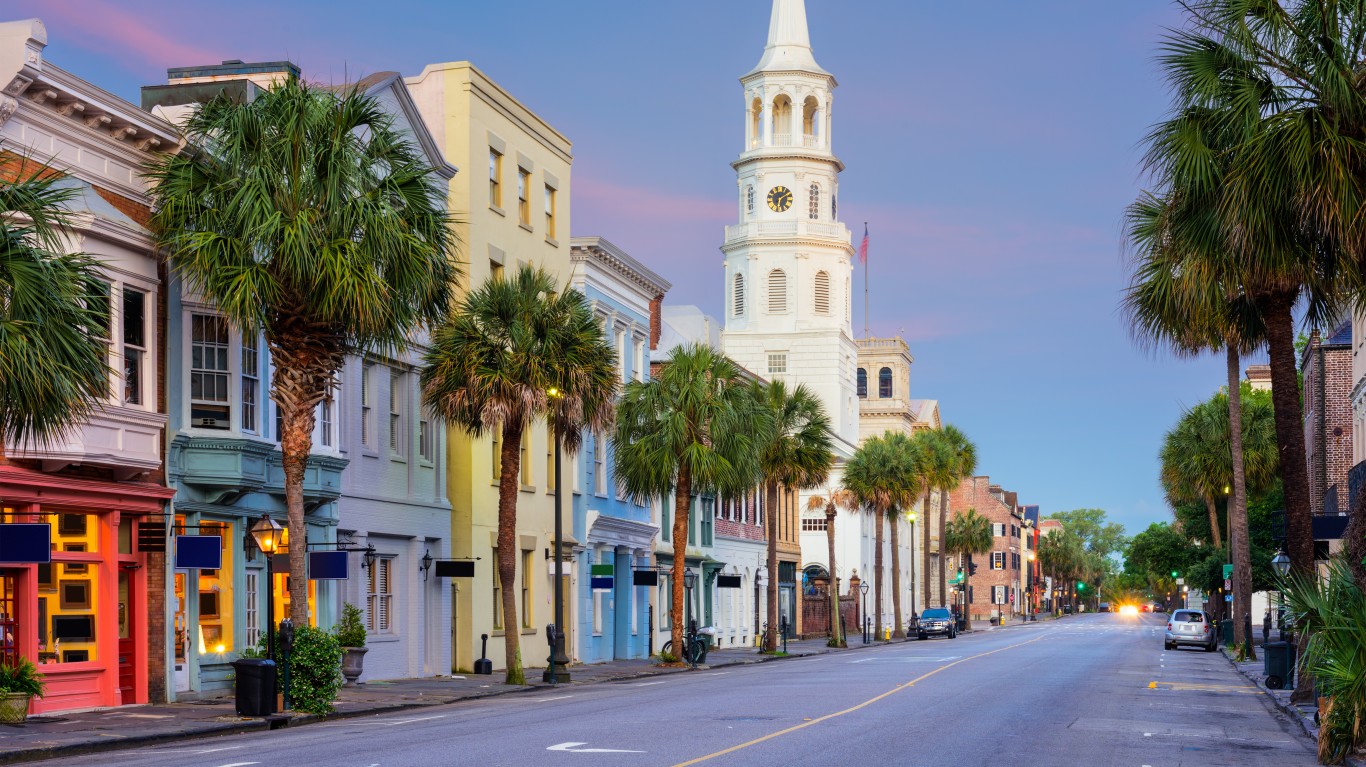
- Hate groups in 2023: 6.3 per million people (33 total)
- Most common group(s): Moms for Liberty (17 chapters)
- Most common ideologies: Anti-government (18 groups), White Nationalist (6 groups)
- Statewide racial and ethnic makeup: 62.5% White; 24.9% Black, 1.7% Asian; 6.5% Hispanic or Latino
- State nationality demographics: 94.8% native; 2.5% naturalized U.S. citizen; 2.7% foreign-born non-U.S. citizen
8. Nebraska

- Hate groups in 2023: 6.6 per million people (13 total)
- Most common group(s): Moms for Liberty (2 chapters)
- Most common ideologies: Anti-government (5 groups), Neo-Nazi, White Nationalist (2 groups)
- Statewide racial and ethnic makeup: 75.8% White; 4.5% Black, 2.5% Asian; 12.3% Hispanic or Latino
- State nationality demographics: 92.8% native; 3.2% naturalized U.S. citizen; 4.0% foreign-born non-U.S. citizen
7. West Virginia

- Hate groups in 2023: 6.8 per million people (12 total)
- Most common group(s): Asatru Folk Assembly, Moms for Liberty, Patriot Front, VDARE (1 chapter each)
- Most common ideologies: White Nationalist (5 groups), Anti-government General (3 groups)
- Statewide racial and ethnic makeup: 89.8% White; 3.3% Black, 0.7% Asian; 1.9% Hispanic or Latino
- State nationality demographics: 98.2% native; 1.1% naturalized U.S. citizen; 0.8% foreign-born non-U.S. citizen
6. Maine

- Hate groups in 2023: 8.7 per million people (12 total)
- Most common group(s): Asatru Folk Assembly, Moms for Liberty, Nationalist Social Club, Patriot Front (1 chapter each)
- Most common ideologies: Anti-government (6 groups), Neo-Nazi, White Nationalist (2 groups each)
- Statewide racial and ethnic makeup: 90.2% White; 1.6% Black, 1.2% Asian; 2.1% Hispanic or Latino
- State nationality demographics: 95.9% native; 2.3% naturalized U.S. citizen; 1.8% foreign-born non-U.S. citizen
5. Rhode Island

- Hate groups in 2023: 9.1 per million people (10 total)
- Most common group(s): Moms for Liberty, Nationalist Social Club, Patriot Front (1 chapter each)
- Most common ideologies: Anti-government (5 groups), White Nationalist (2 groups)
- Statewide racial and ethnic makeup: 68.2% White; 4.7% Black, 3.4% Asian; 17.6% Hispanic or Latino
- State nationality demographics: 85.6% native; 7.5% naturalized U.S. citizen; 6.9% foreign-born non-U.S. citizen
4. New Hampshire

- Hate groups in 2023: 11.5 per million people (16 total)
- Most common group(s): Moms for Liberty (2 chapters)
- Most common ideologies: Anti-government (6 groups), Neo-Nazi, White Nationalist (2 groups each)
- Statewide racial and ethnic makeup: 86.6% White; 1.3% Black, 2.6% Asian; 4.5% Hispanic or Latino
- State nationality demographics: 93.8% native; 3.8% naturalized U.S. citizen; 2.4% foreign-born non-U.S. citizen
3. Idaho
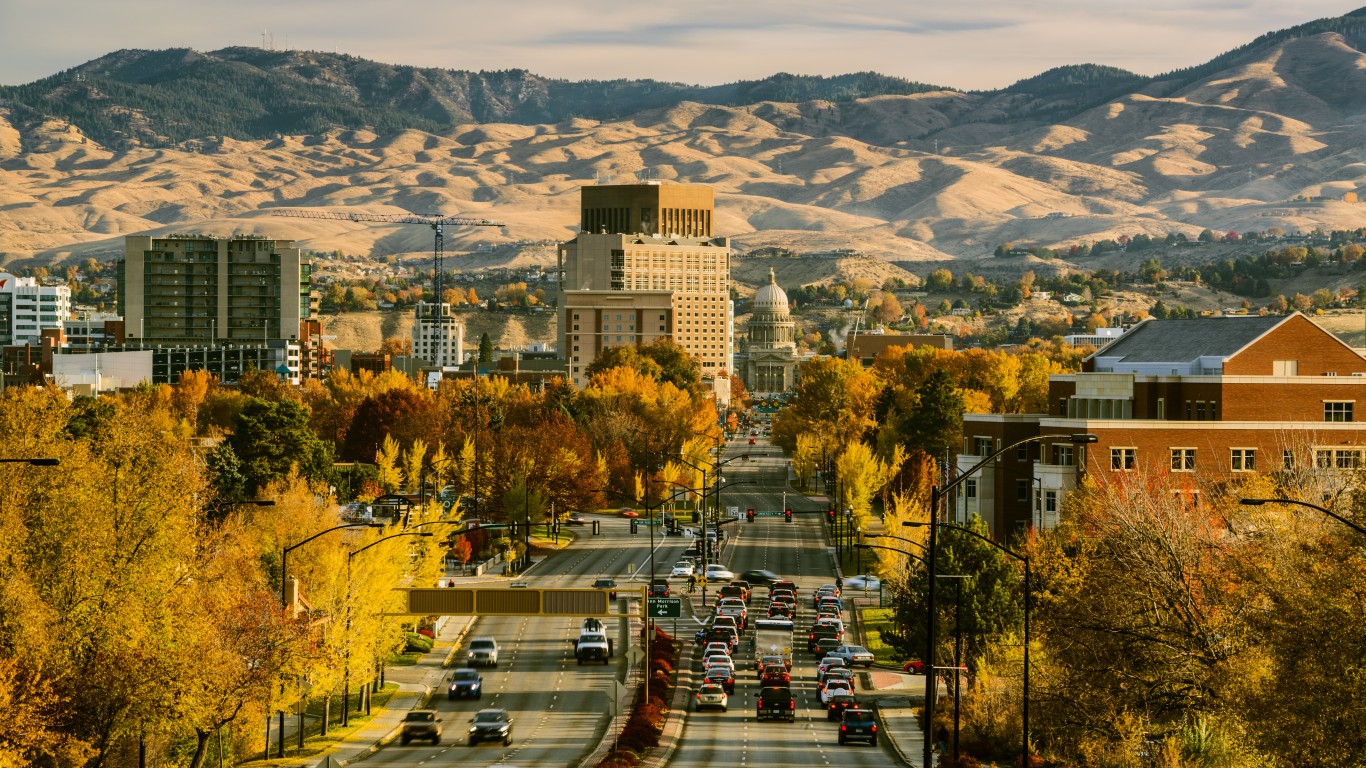
- Hate groups in 2023: 12.9 per million people (25 total)
- Most common group(s): Asatru Folk Assembly, Moms for Liberty, Patriot Front, Proud Boys, Three Percenters (1 chapter each)
- Most common ideologies: Anti-government (9 groups), White Nationalist (4 groups)
- Statewide racial and ethnic makeup: 79.0% White; 0.6% Black, 1.3% Asian; 13.5% Hispanic or Latino
- State nationality demographics: 94.0% native; 2.8% naturalized U.S. citizen; 3.2% foreign-born non-U.S. citizen
2. South Dakota
- Hate groups in 2023: 13.2 per million people (12 total)
- Most common group(s): Moms for Liberty (4 chapters)
- Most common ideologies: Anti-government (5 groups), Sovereign Citizens Movement, White Nationalist (2 groups each)
- Statewide racial and ethnic makeup: 79.9% White; 2.0% Black, 1.4% Asian; 4.7% Hispanic or Latino
- State nationality demographics: 96.5% native; 1.9% naturalized U.S. citizen; 1.6% foreign-born non-U.S. citizen
1. Montana
- Hate groups in 2023: 15.1 per million people (17 total)
- Most common group(s): Moms for Liberty, National Socialist Movement (1 chapter each)
- Most common ideologies: Anti-government (7 groups), Conspiracy Propagandists (3 groups)
- Statewide racial and ethnic makeup: 83.5% White; 0.3% Black, 0.7% Asian; 4.4% Hispanic or Latino
- State nationality demographics: 97.7% native; 1.2% naturalized U.S. citizen; 1.1% foreign-born non-U.S. citizen
Take This Retirement Quiz To Get Matched With An Advisor Now (Sponsored)
Are you ready for retirement? Planning for retirement can be overwhelming, that’s why it could be a good idea to speak to a fiduciary financial advisor about your goals today.
Start by taking this retirement quiz right here from SmartAsset that will match you with up to 3 financial advisors that serve your area and beyond in 5 minutes. Smart Asset is now matching over 50,000 people a month.
Click here now to get started.
The post Hate Groups Are Most Common in These States appeared first on 24/7 Wall St..