No economy has generated as much wealth for as many people as that of the United States. According to the 2023 Global Wealth Report from the Swiss investment bank UBS, most adults worldwide have less than $10,000 in total wealth. Meanwhile, the typical American adult is worth nearly $108,000. The same report found that the U.S. is home to 38% of the world’s millionaires, many times more than any other country — and incomes in the U.S. are currently rising at a historic pace.
The latest data from the U.S. Census Bureau’s American Community Survey shows that the typical American household earned nearly $75,000 in 2022, up from about $69,700 in 2021. The 7.2% increase was the largest recorded year-over-year since at least the mid-1990s.
In Ohio, a state home to 24 Fortune 500 companies, the typical household earns $66,990 annually. And in some parts of the state, household incomes exceed that amount by tens of thousands of dollars.
Using five-year estimates from the U.S. Census Bureau’s 2022 American Community Survey, 24/7 Wall St. identified the 22 richest counties in Ohio. Counties in the state are ranked on median household income. Supplemental data on population, unemployment, and median home values are also five-year estimates from the 2022 ACS.
Among the counties on this list, median household incomes are as high as $57,500 above what the typical Ohio household earns. In many of these counties, high incomes are underpinned by a strong job market. According to the ACS, the five-year average jobless rate in all but four of Ohio’s richest counties is below the 5.0% statewide average.
Home values are often a reflection of what residents can afford, and high incomes in these counties are often evidenced by the local real estate markets. In most counties on this list, the typical home is worth more than the $183,300 median home value across the state.
These are the richest counties in Ohio.
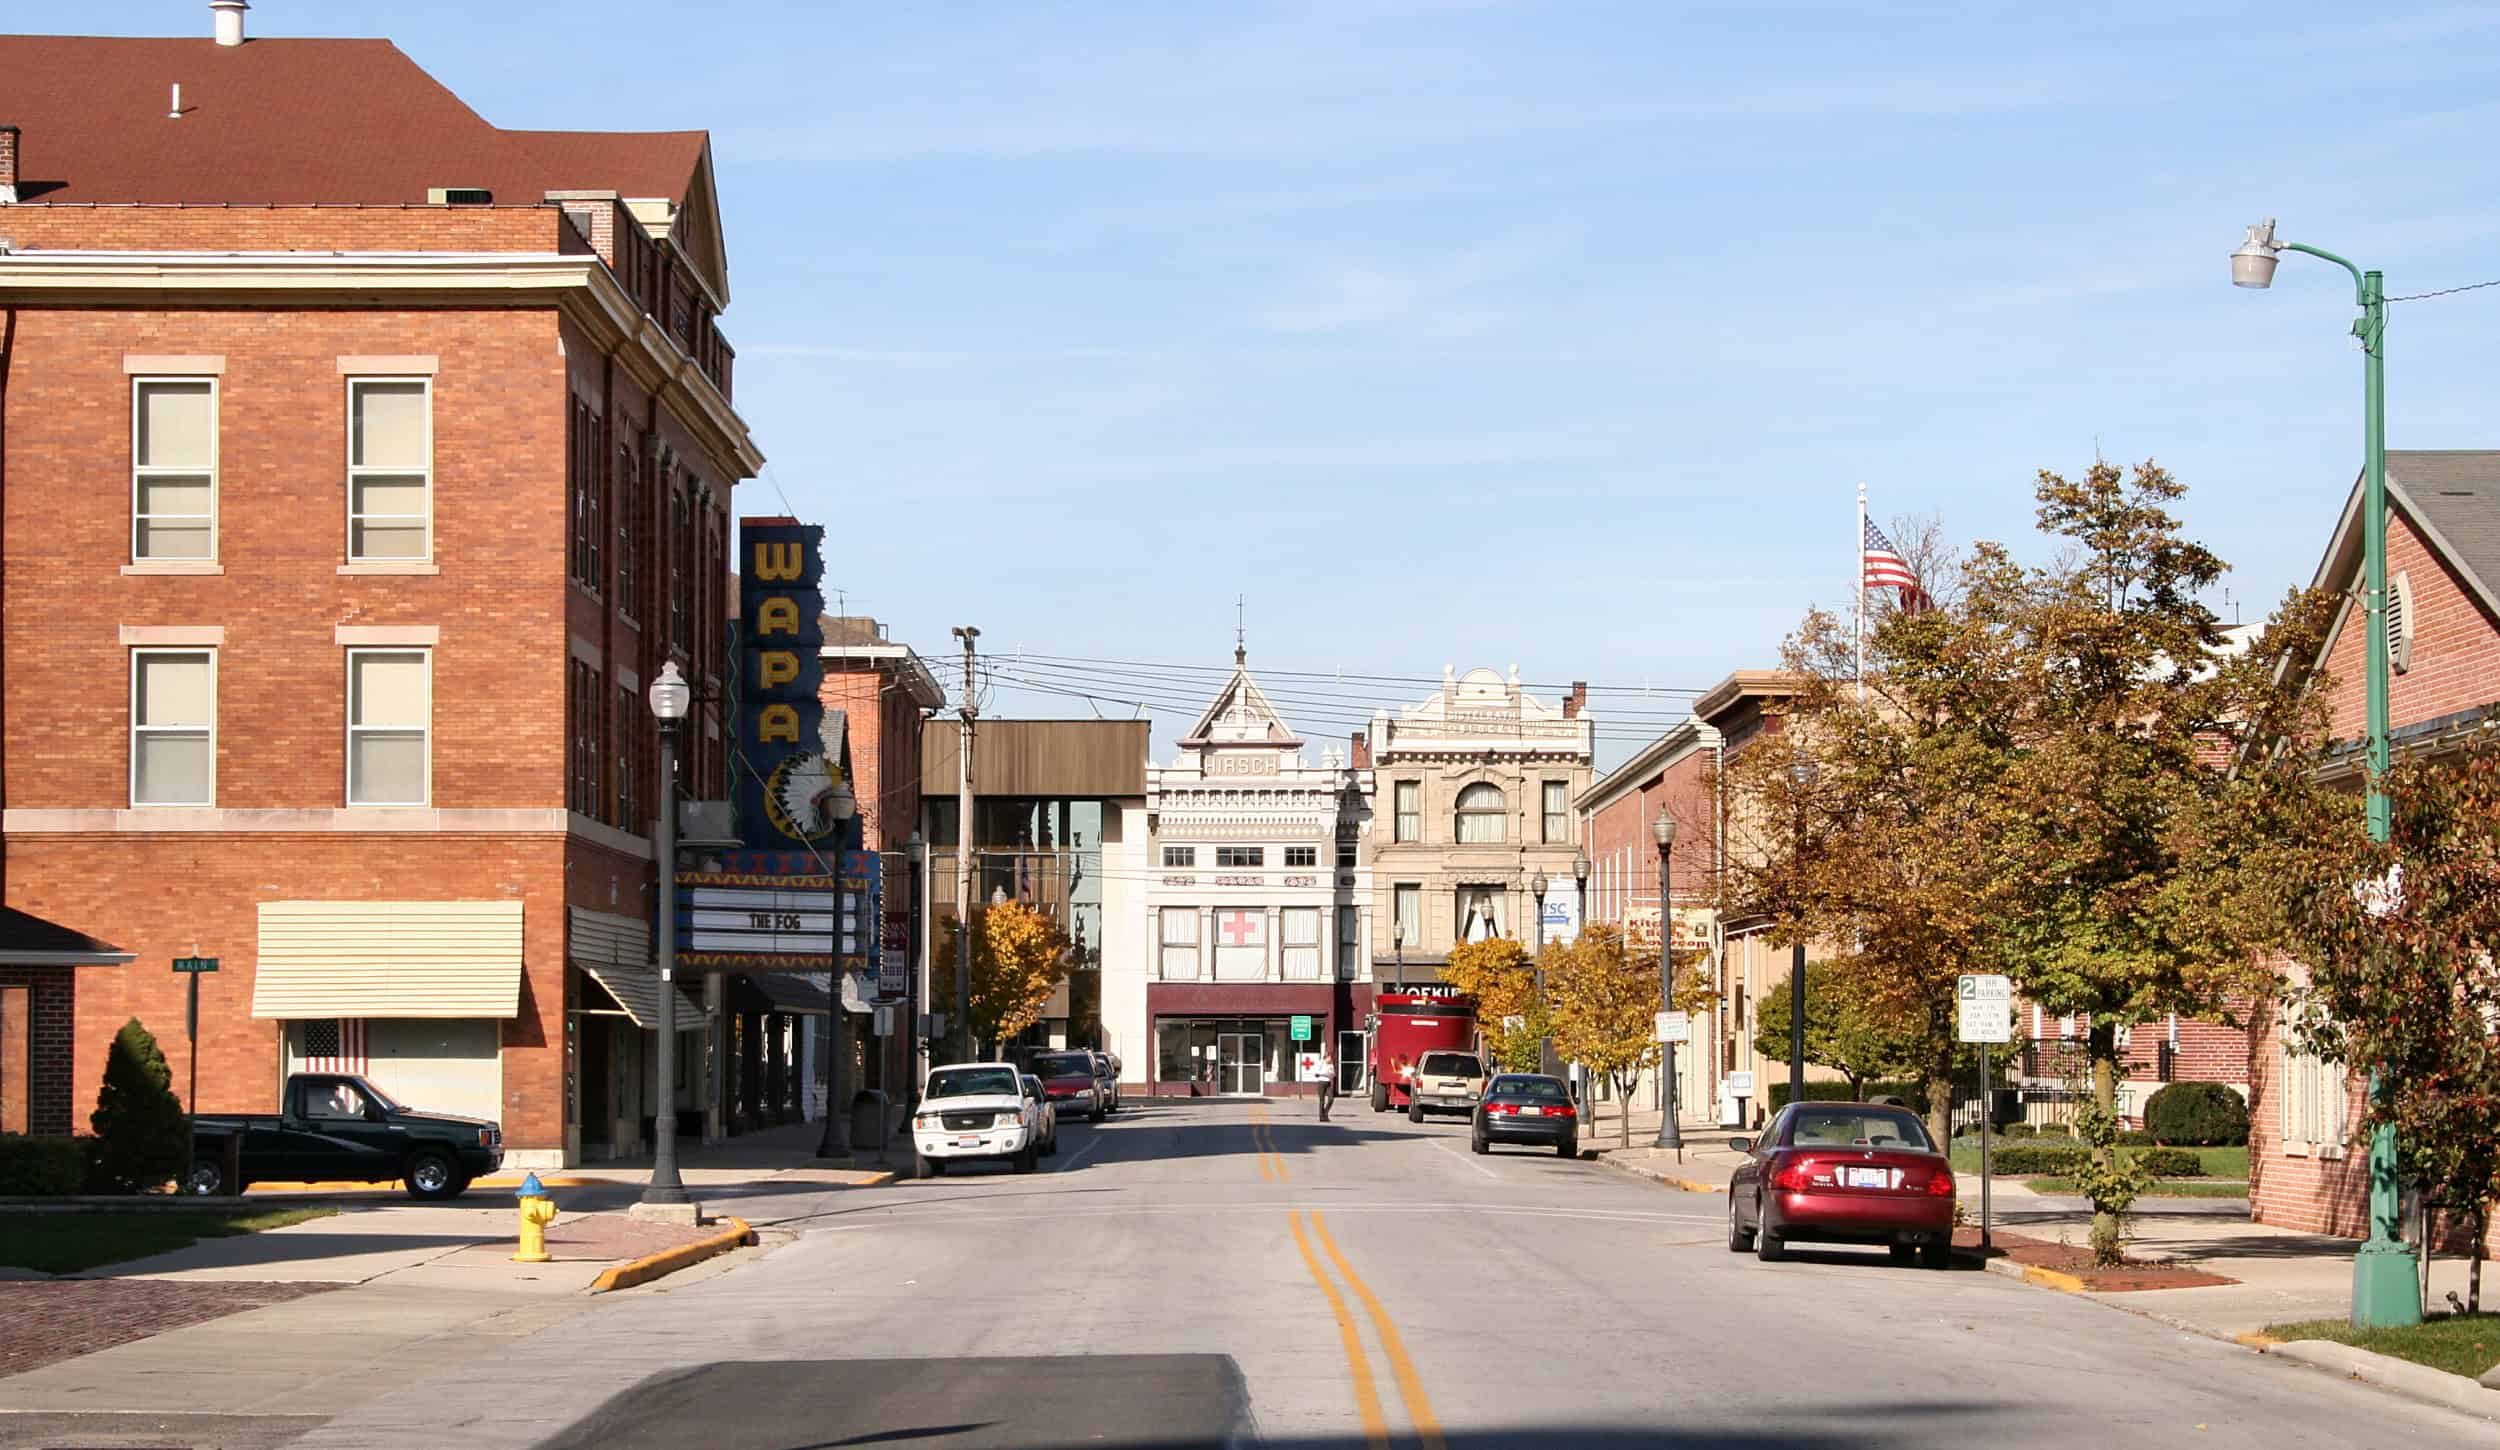
36. Hancock County

- Median household income: $67,006
- Median home value: $179,600
- 5-yr. avg. unemployment rate: 3.7%
- Population: 75,072
35. Lorain County

- Median household income: $67,272
- Median home value: $191,900
- 5-yr. avg. unemployment rate: 4.4%
- Population: 313,101
34. Pickaway County

- Median household income: $67,600
- Median home value: $219,900
- 5-yr. avg. unemployment rate: 4.1%
- Population: 58,809
33. Hamilton County

- Median household income: $68,249
- Median home value: $205,000
- 5-yr. avg. unemployment rate: 5.0%
- Population: 827,671
32. Summit County
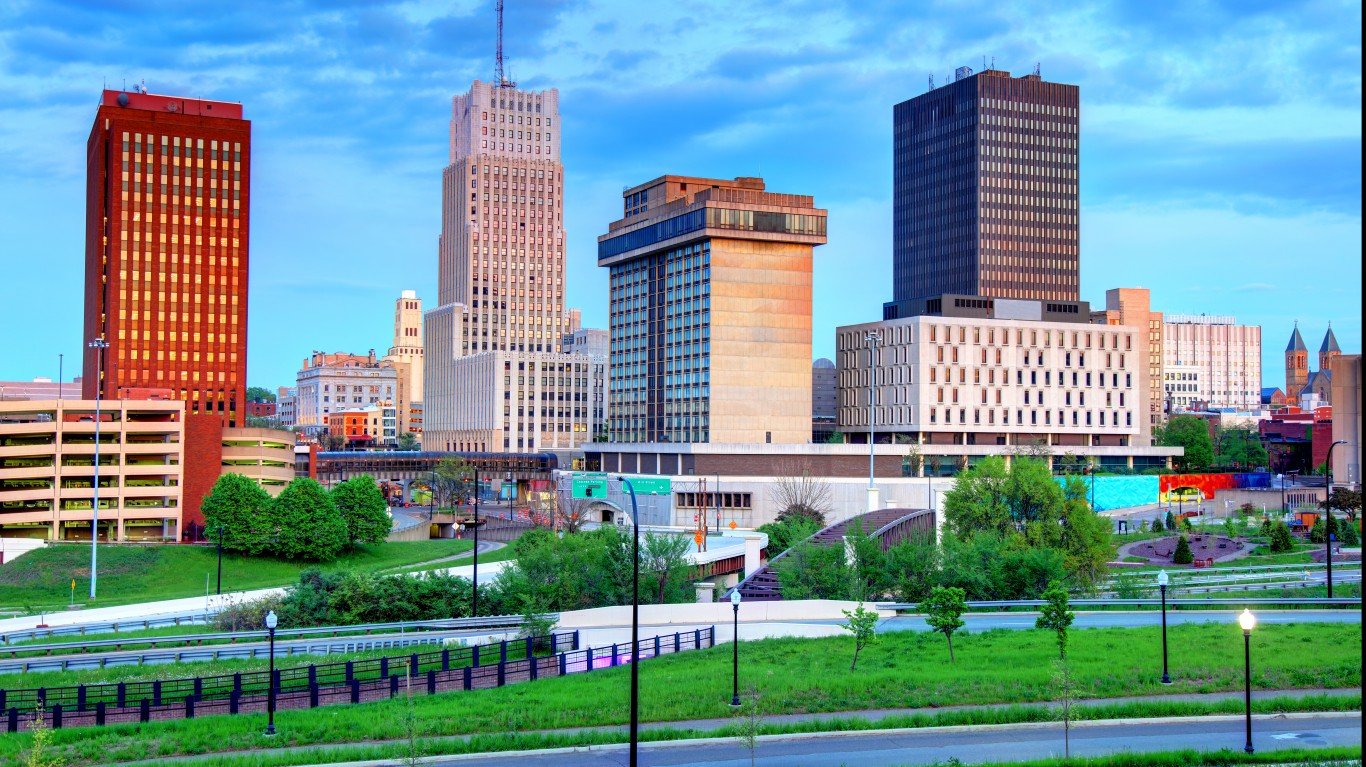
- Median household income: $68,360
- Median home value: $182,500
- 5-yr. avg. unemployment rate: 5.3%
- Population: 539,361
31. Wyandot County

- Median household income: $68,552
- Median home value: $154,200
- 5-yr. avg. unemployment rate: 2.8%
- Population: 21,818
30. Logan County

- Median household income: $69,125
- Median home value: $168,300
- 5-yr. avg. unemployment rate: 3.5%
- Population: 46,098
29. Defiance County

- Median household income: $69,302
- Median home value: $147,600
- 5-yr. avg. unemployment rate: 4.9%
- Population: 38,300
28. Ottawa County
- Median household income: $69,515
- Median home value: $179,100
- 5-yr. avg. unemployment rate: 3.4%
- Population: 40,367
27. Portage County

- Median household income: $69,796
- Median home value: $197,100
- 5-yr. avg. unemployment rate: 5.5%
- Population: 161,217
26. Wayne County

- Median household income: $70,320
- Median home value: $189,800
- 5-yr. avg. unemployment rate: 3.3%
- Population: 116,680
25. Morrow County

- Median household income: $70,412
- Median home value: $185,800
- 5-yr. avg. unemployment rate: 2.6%
- Population: 35,049
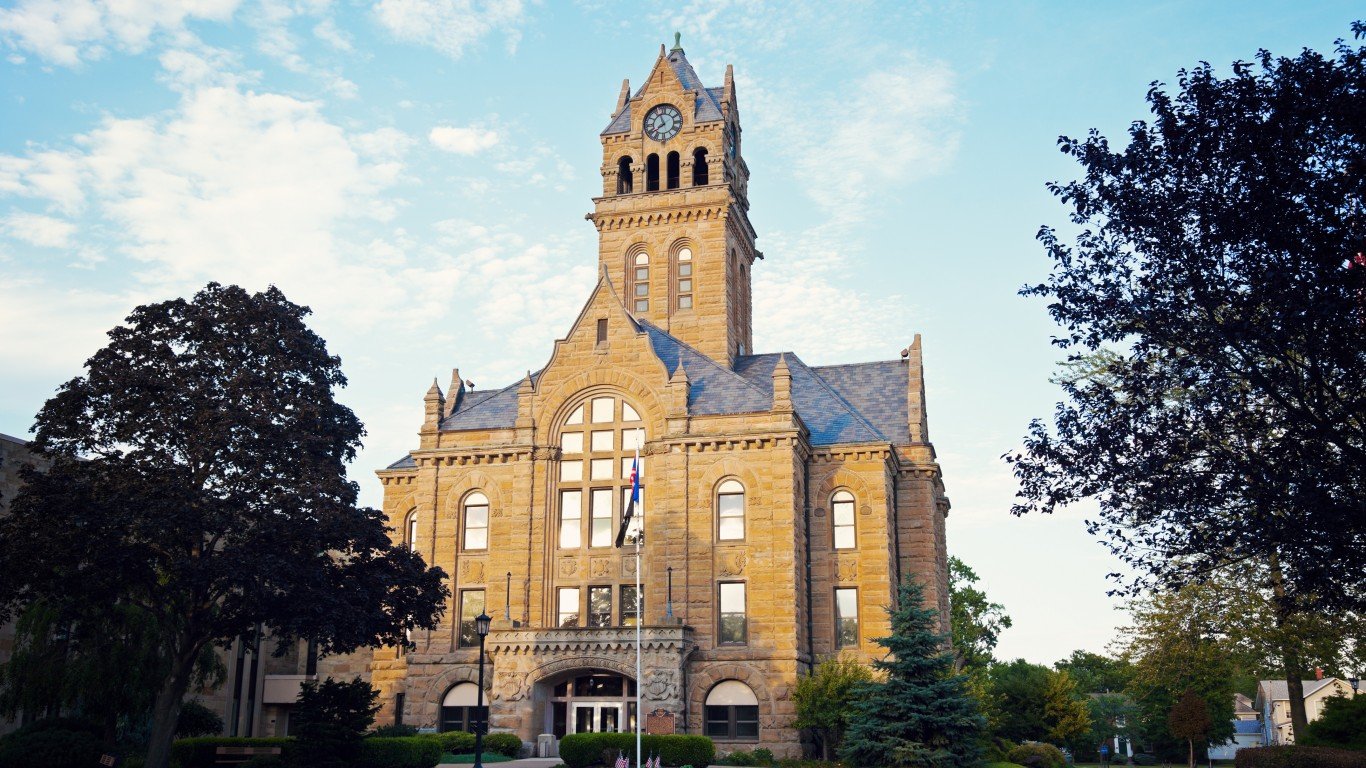
24. Champaign County
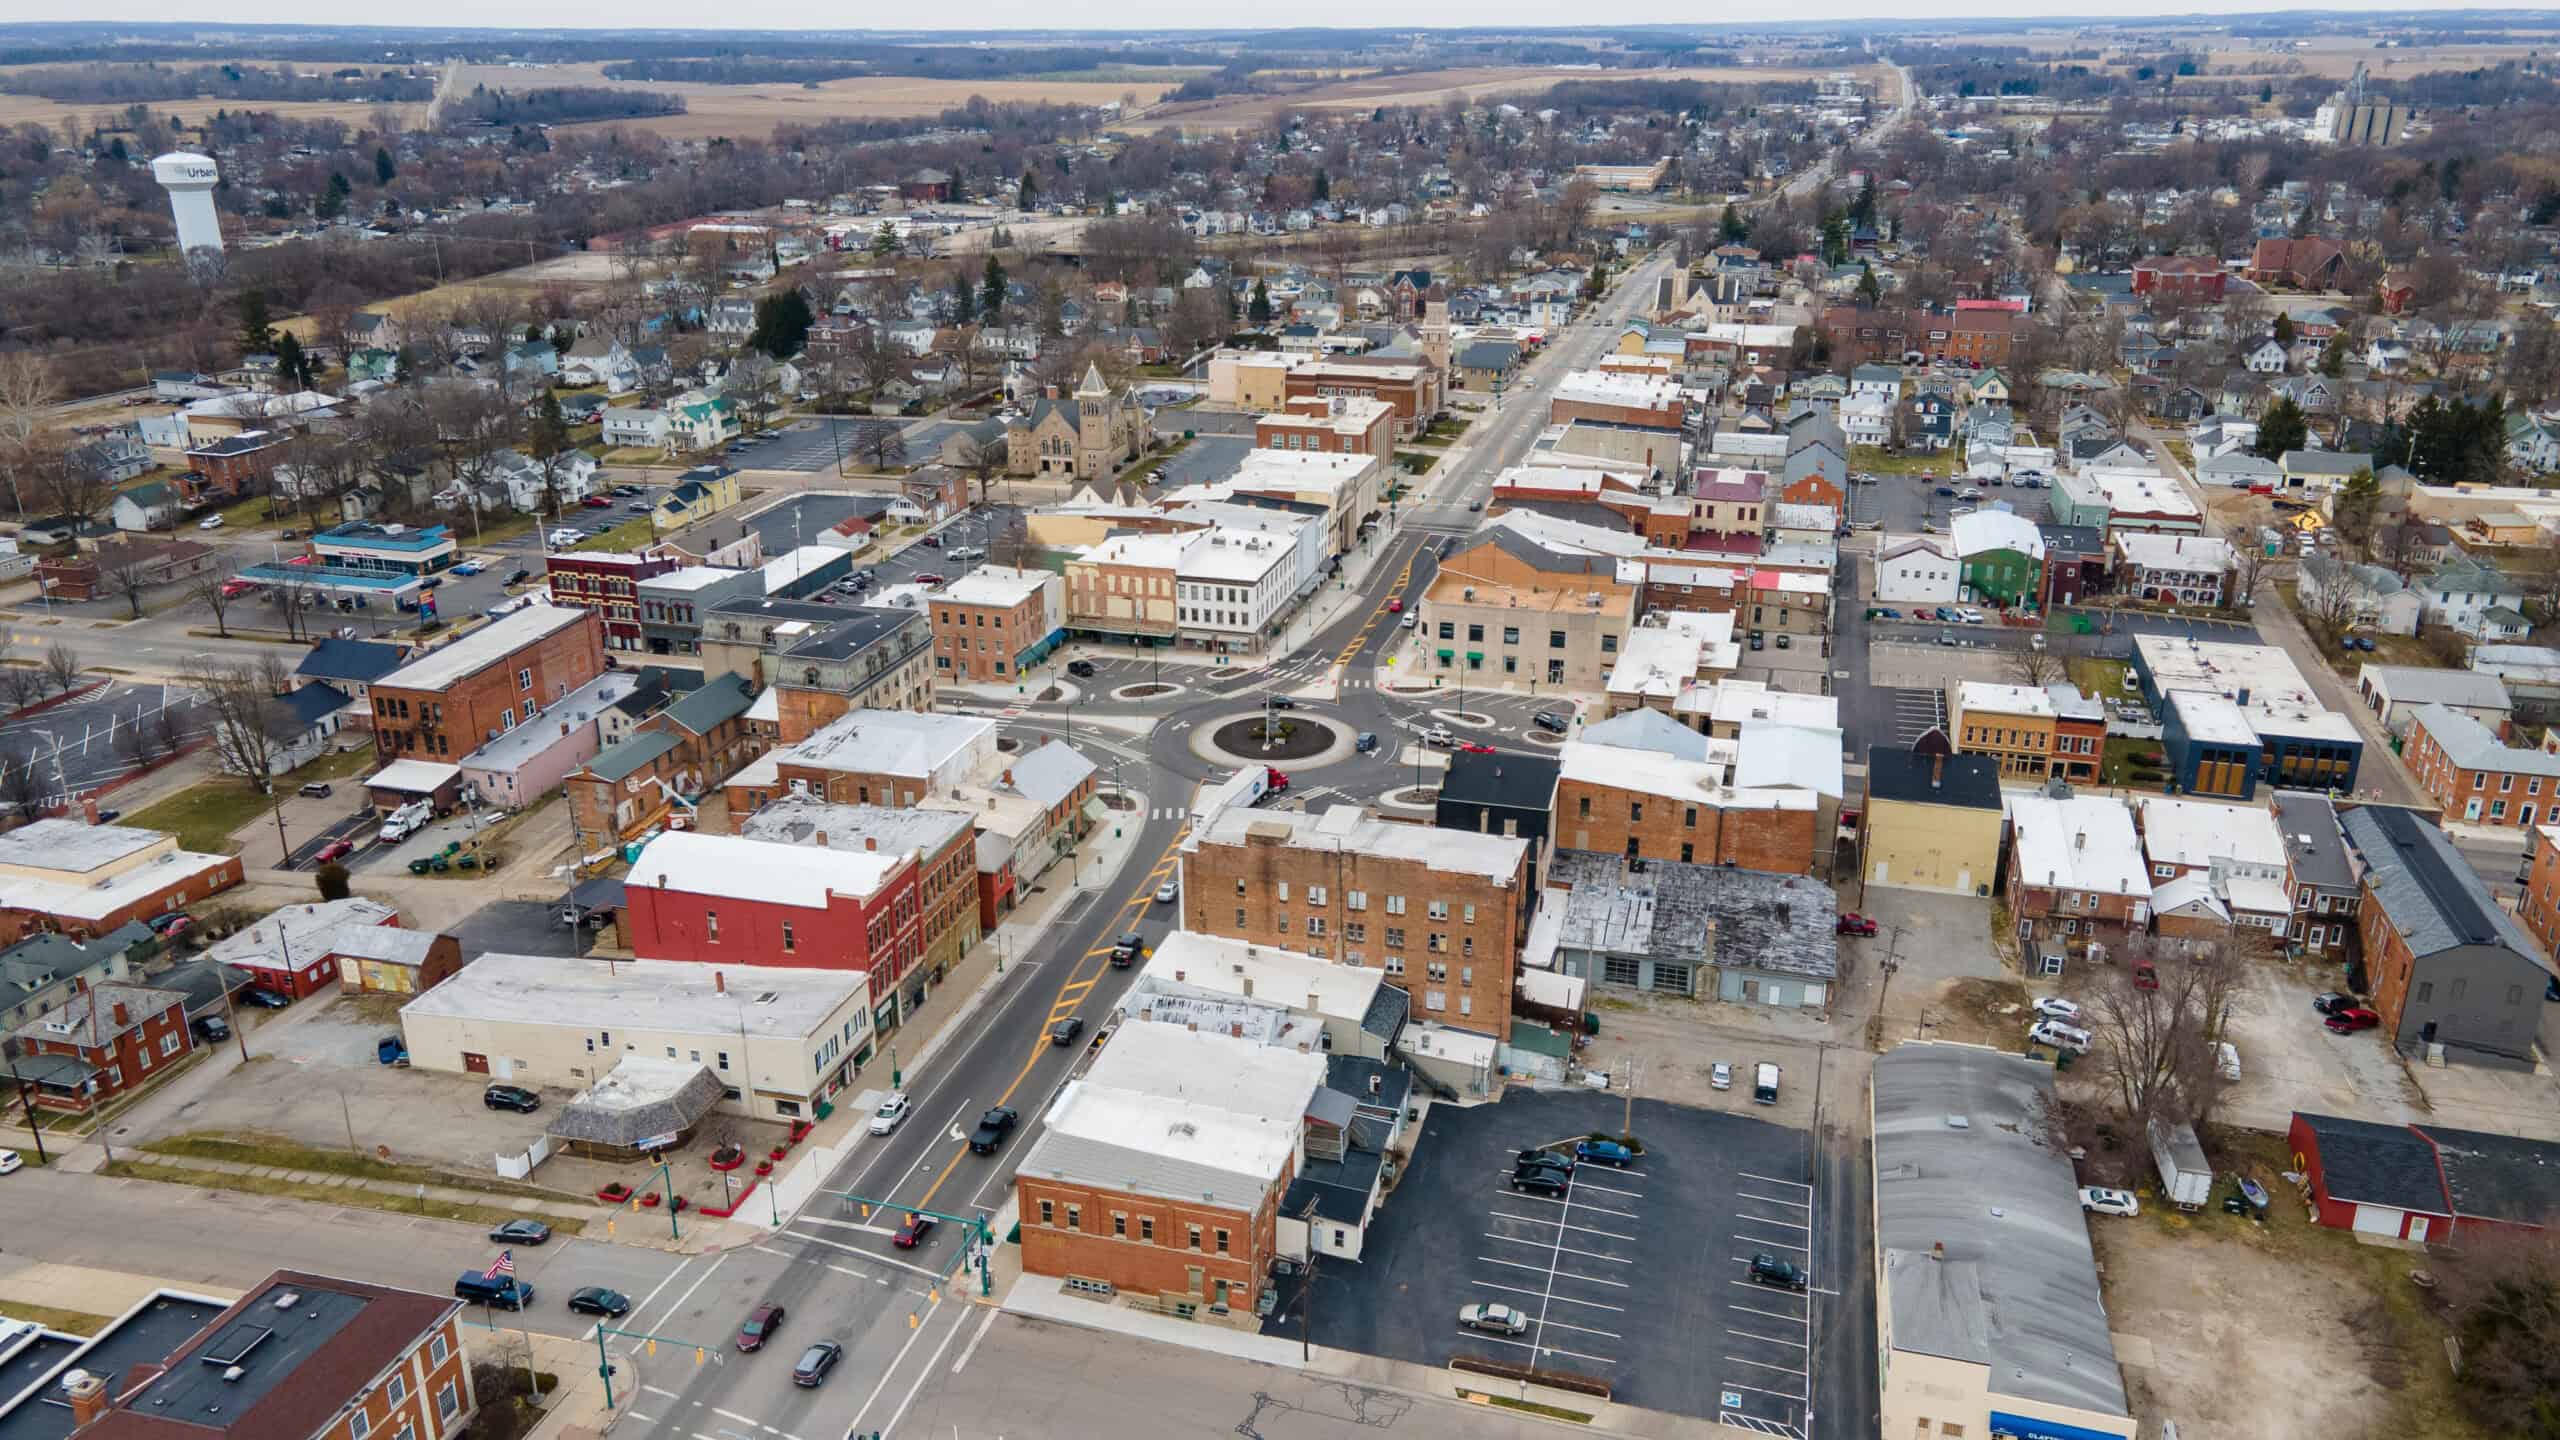
- Median household income: $70,486
- Median home value: $166,900
- 5-yr. avg. unemployment rate: 4.5%
- Population: 38,715
23. Wood County

- Median household income: $70,537
- Median home value: $203,300
- 5-yr. avg. unemployment rate: 4.9%
- Population: 131,564
22. Franklin County
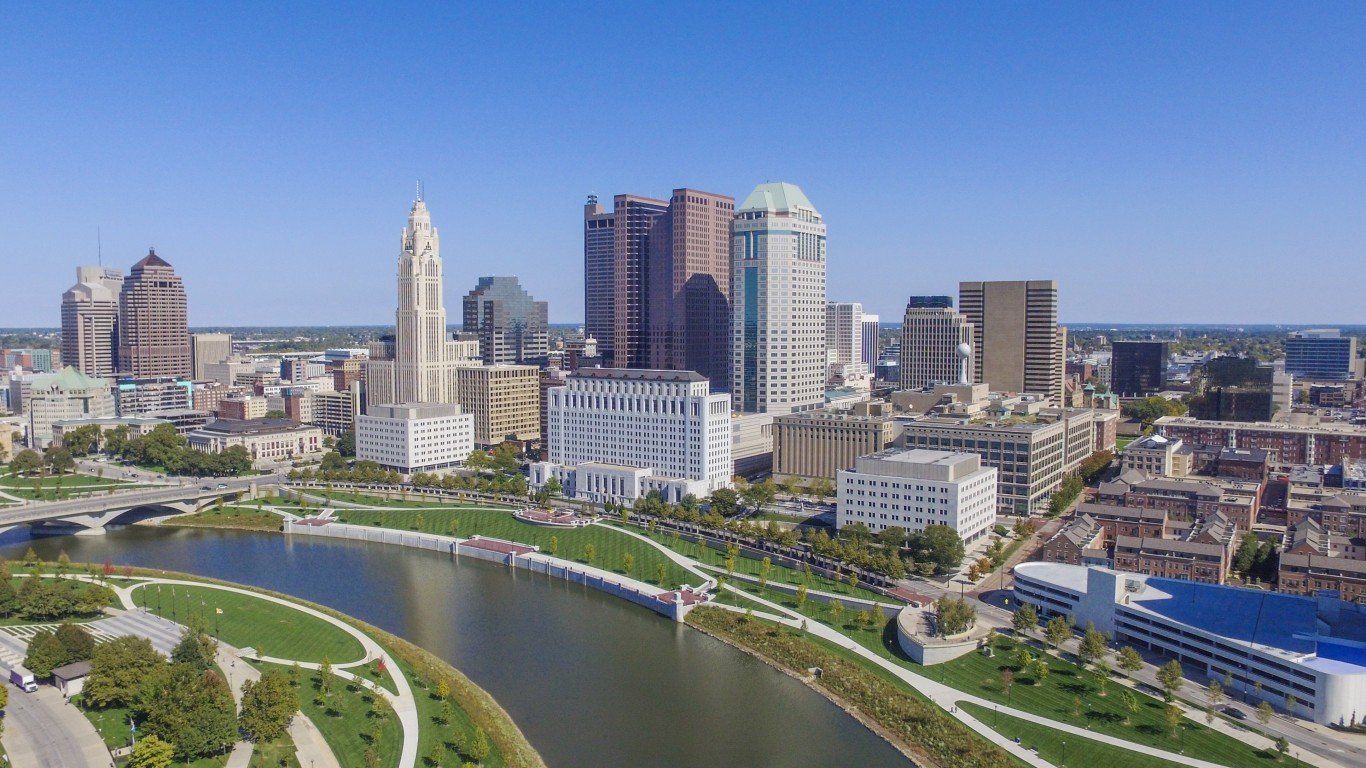
- Median household income: $71,070
- Median home value: $243,100
- 5-yr. avg. unemployment rate: 4.7%
- Population: 1,318,149
21. Knox County

- Median household income: $71,246
- Median home value: $197,400
- 5-yr. avg. unemployment rate: 3.3%
- Population: 62,657
20. Miami County

- Median household income: $71,440
- Median home value: $190,900
- 5-yr. avg. unemployment rate: 3.4%
- Population: 108,818
19. Fulton County
- Median household income: $71,453
- Median home value: $163,100
- 5-yr. avg. unemployment rate: 3.5%
- Population: 42,602
18. Henry County
- Median household income: $71,616
- Median home value: $157,500
- 5-yr. avg. unemployment rate: 4.5%
- Population: 27,601
17. Holmes County
- Median household income: $72,987
- Median home value: $245,800
- 5-yr. avg. unemployment rate: 2.0%
- Population: 44,273
16. Mercer County
- Median household income: $73,278
- Median home value: $192,800
- 5-yr. avg. unemployment rate: 2.0%
- Population: 42,321
15. Shelby County

- Median household income: $73,502
- Median home value: $174,200
- 5-yr. avg. unemployment rate: 4.9%
- Population: 48,145
14. Auglaize County
- Median household income: $75,231
- Median home value: $168,200
- 5-yr. avg. unemployment rate: 2.9%
- Population: 46,263
13. Lake County

- Median household income: $76,835
- Median home value: $189,600
- 5-yr. avg. unemployment rate: 4.4%
- Population: 232,236
11. Butler County

- Median household income: $77,062
- Median home value: $224,300
- 5-yr. avg. unemployment rate: 5.1%
- Population: 388,327
11. Madison County

- Median household income: $77,062
- Median home value: $201,200
- 5-yr. avg. unemployment rate: 3.4%
- Population: 43,961
10. Licking County

- Median household income: $78,505
- Median home value: $232,200
- 5-yr. avg. unemployment rate: 3.3%
- Population: 178,844
9. Putnam County
- Median household income: $79,453
- Median home value: $176,200
- 5-yr. avg. unemployment rate: 2.2%
- Population: 34,400
8. Clermont County

- Median household income: $79,573
- Median home value: $224,800
- 5-yr. avg. unemployment rate: 4.1%
- Population: 208,851
7. Greene County

- Median household income: $81,243
- Median home value: $222,300
- 5-yr. avg. unemployment rate: 4.5%
- Population: 167,567
6. Fairfield County

- Median household income: $82,969
- Median home value: $247,800
- 5-yr. avg. unemployment rate: 3.6%
- Population: 159,371
5. Medina County

- Median household income: $89,968
- Median home value: $249,700
- 5-yr. avg. unemployment rate: 3.0%
- Population: 182,347
4. Geauga County

- Median household income: $97,162
- Median home value: $288,000
- 5-yr. avg. unemployment rate: 3.1%
- Population: 95,455
3. Warren County

- Median household income: $103,128
- Median home value: $290,900
- 5-yr. avg. unemployment rate: 3.0%
- Population: 243,189
2. Union County

- Median household income: $104,496
- Median home value: $282,900
- 5-yr. avg. unemployment rate: 2.9%
- Population: 63,411
1. Delaware County
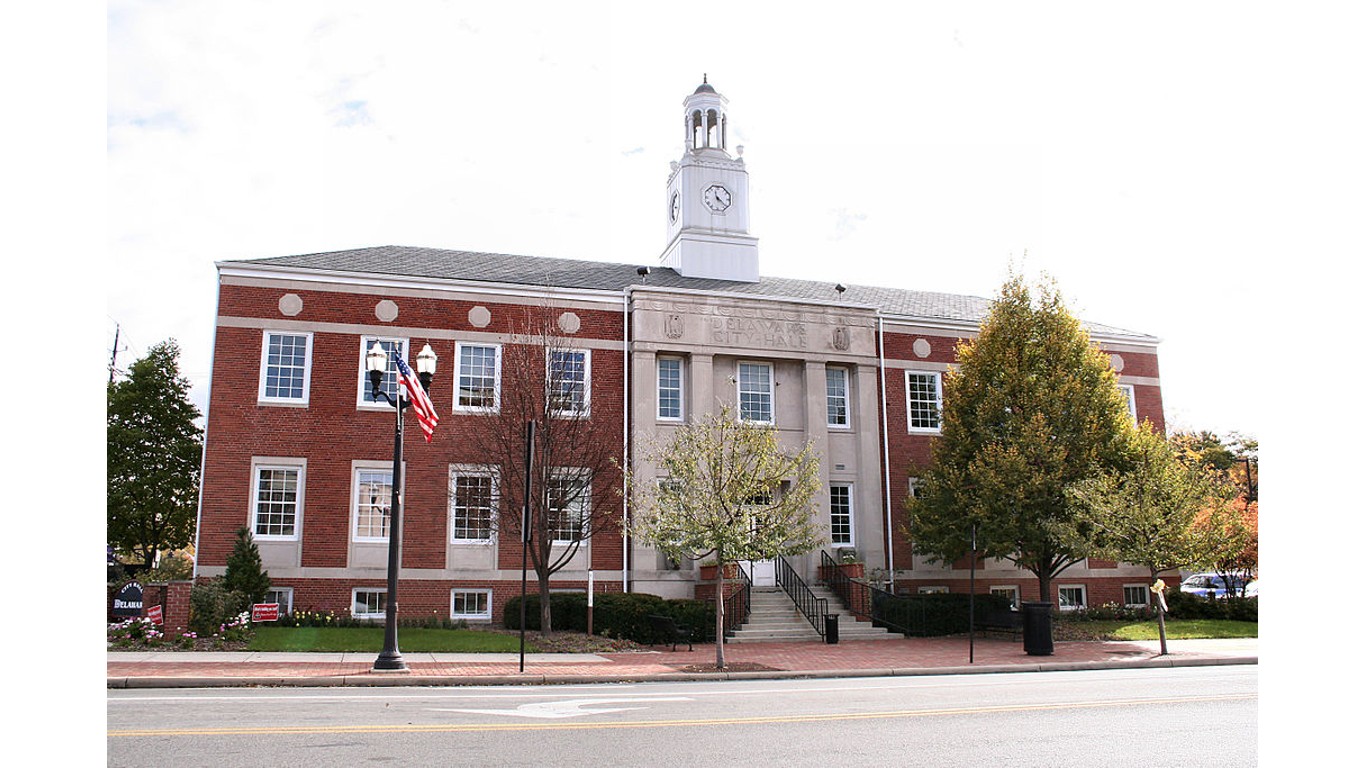
- Median household income: $123,995
- Median home value: $393,000
- 5-yr. avg. unemployment rate: 3.0%
- Population: 216,074
| Rank | County | Median household income ($) | Median home value ($) | Unemployment rate (%) |
|---|---|---|---|---|
| 1 | Delaware, Ohio | 123,995 | 393,000 | 3.0 |
| 2 | Union, Ohio | 104,496 | 282,900 | 2.9 |
| 3 | Warren, Ohio | 103,128 | 290,900 | 3.0 |
| 4 | Geauga, Ohio | 97,162 | 288,000 | 3.1 |
| 5 | Medina, Ohio | 89,968 | 249,700 | 3.0 |
| 6 | Fairfield, Ohio | 82,969 | 247,800 | 3.6 |
| 7 | Greene, Ohio | 81,243 | 222,300 | 4.5 |
| 8 | Clermont, Ohio | 79,573 | 224,800 | 4.1 |
| 9 | Putnam, Ohio | 79,453 | 176,200 | 2.2 |
| 10 | Licking, Ohio | 78,505 | 232,200 | 3.3 |
| 11 | Butler, Ohio | 77,062 | 224,300 | 5.1 |
| 11 | Madison, Ohio | 77,062 | 201,200 | 3.4 |
| 13 | Lake, Ohio | 76,835 | 189,600 | 4.4 |
| 14 | Auglaize, Ohio | 75,231 | 168,200 | 2.9 |
| 15 | Shelby, Ohio | 73,502 | 174,200 | 4.9 |
| 16 | Mercer, Ohio | 73,278 | 192,800 | 2.0 |
| 17 | Holmes, Ohio | 72,987 | 245,800 | 2.0 |
| 18 | Henry, Ohio | 71,616 | 157,500 | 4.5 |
| 19 | Fulton, Ohio | 71,453 | 163,100 | 3.5 |
| 20 | Miami, Ohio | 71,440 | 190,900 | 3.4 |
| 21 | Knox, Ohio | 71,246 | 197,400 | 3.3 |
| 22 | Franklin, Ohio | 71,070 | 243,100 | 4.7 |
| 23 | Wood, Ohio | 70,537 | 203,300 | 4.9 |
| 24 | Champaign, Ohio | 70,486 | 166,900 | 4.5 |
| 25 | Morrow, Ohio | 70,412 | 185,800 | 2.6 |
| 26 | Wayne, Ohio | 70,320 | 189,800 | 3.3 |
| 27 | Portage, Ohio | 69,796 | 197,100 | 5.5 |
| 28 | Ottawa, Ohio | 69,515 | 179,100 | 3.4 |
| 29 | Defiance, Ohio | 69,302 | 147,600 | 4.9 |
| 30 | Logan, Ohio | 69,125 | 168,300 | 3.5 |
| 31 | Wyandot, Ohio | 68,552 | 154,200 | 2.8 |
| 32 | Summit, Ohio | 68,360 | 182,500 | 5.3 |
| 33 | Hamilton, Ohio | 68,249 | 205,000 | 5.0 |
| 34 | Pickaway, Ohio | 67,600 | 219,900 | 4.1 |
| 35 | Lorain, Ohio | 67,272 | 191,900 | 4.4 |
| 36 | Hancock, Ohio | 67,006 | 179,600 | 3.7 |
Take This Retirement Quiz To Get Matched With A Financial Advisor (Sponsored)
Take the quiz below to get matched with a financial advisor today.
Each advisor has been vetted by SmartAsset and is held to a fiduciary standard to act in your best interests.
Here’s how it works:
1. Answer SmartAsset advisor match quiz
2. Review your pre-screened matches at your leisure. Check out the
advisors’ profiles.
3. Speak with advisors at no cost to you. Have an introductory call on the phone or introduction in person and choose whom to work with in the future
Take the retirement quiz right here.
The post These Are the Richest Counties in Ohio appeared first on 24/7 Wall St..