Galveston, Texas, has been celebrating Juneteenth far longer than America has as a whole. For these residents and their generations to follow, the Emancipation Proclamation arrived in June 1865, 2 full years after it was passed, and they have celebrated there ever since. Historically, it is noted that Galveston was the last location holding slaves to receive the notice, thereby becoming the final stronghold to be freed. This year will be the fourth year to celebrate the occasion as a federal holiday after it was first recognized in 2021.
Despite the jubilations that came with the Emancipation Proclamation, Black Americans have had a long road to walk to gain the freedoms they deserved. Following the release from slavery, they endured the post-Civil War Jim Crow laws, enforced segregation, limited opportunities, threats, and violence. The Civil Rights Act of 1964 and the Voting Rights Act of 1965 attempted to make right some of what was wrong, but the long-term behaviors, beliefs, and policies had already taken deep root in American culture and society. With an ever-evolving understanding of the past and its repercussions, it is difficult to determine if the subsequent disparities can be undone.
According to Howard University, racial disparity refers to “the imbalances and incongruities between the treatment of racial groups, including economic status, income, housing options, societal treatment, safety and myriad other aspects of life and society.” Black Americans participated in the Great Migration from 1910-1970 in an attempt to relocate and move past these disparities, believing that if they could leave the southern United States, they would receive equal treatment. They moved to places like New York, Chicago, Detroit, and Los Angeles to pursue their American Dreams. Some found their way to better lives, most had to fight to still get the treatment they felt they deserved, and many found other parts of the country not to be much different than the deepest parts of the South they left behind. The book “The Warmth of Other Suns,” by Isabel Wilkerson, details the accounts of several individuals who made these journeys into parts unknown and gives first-hand accounts of what this time in history felt like.
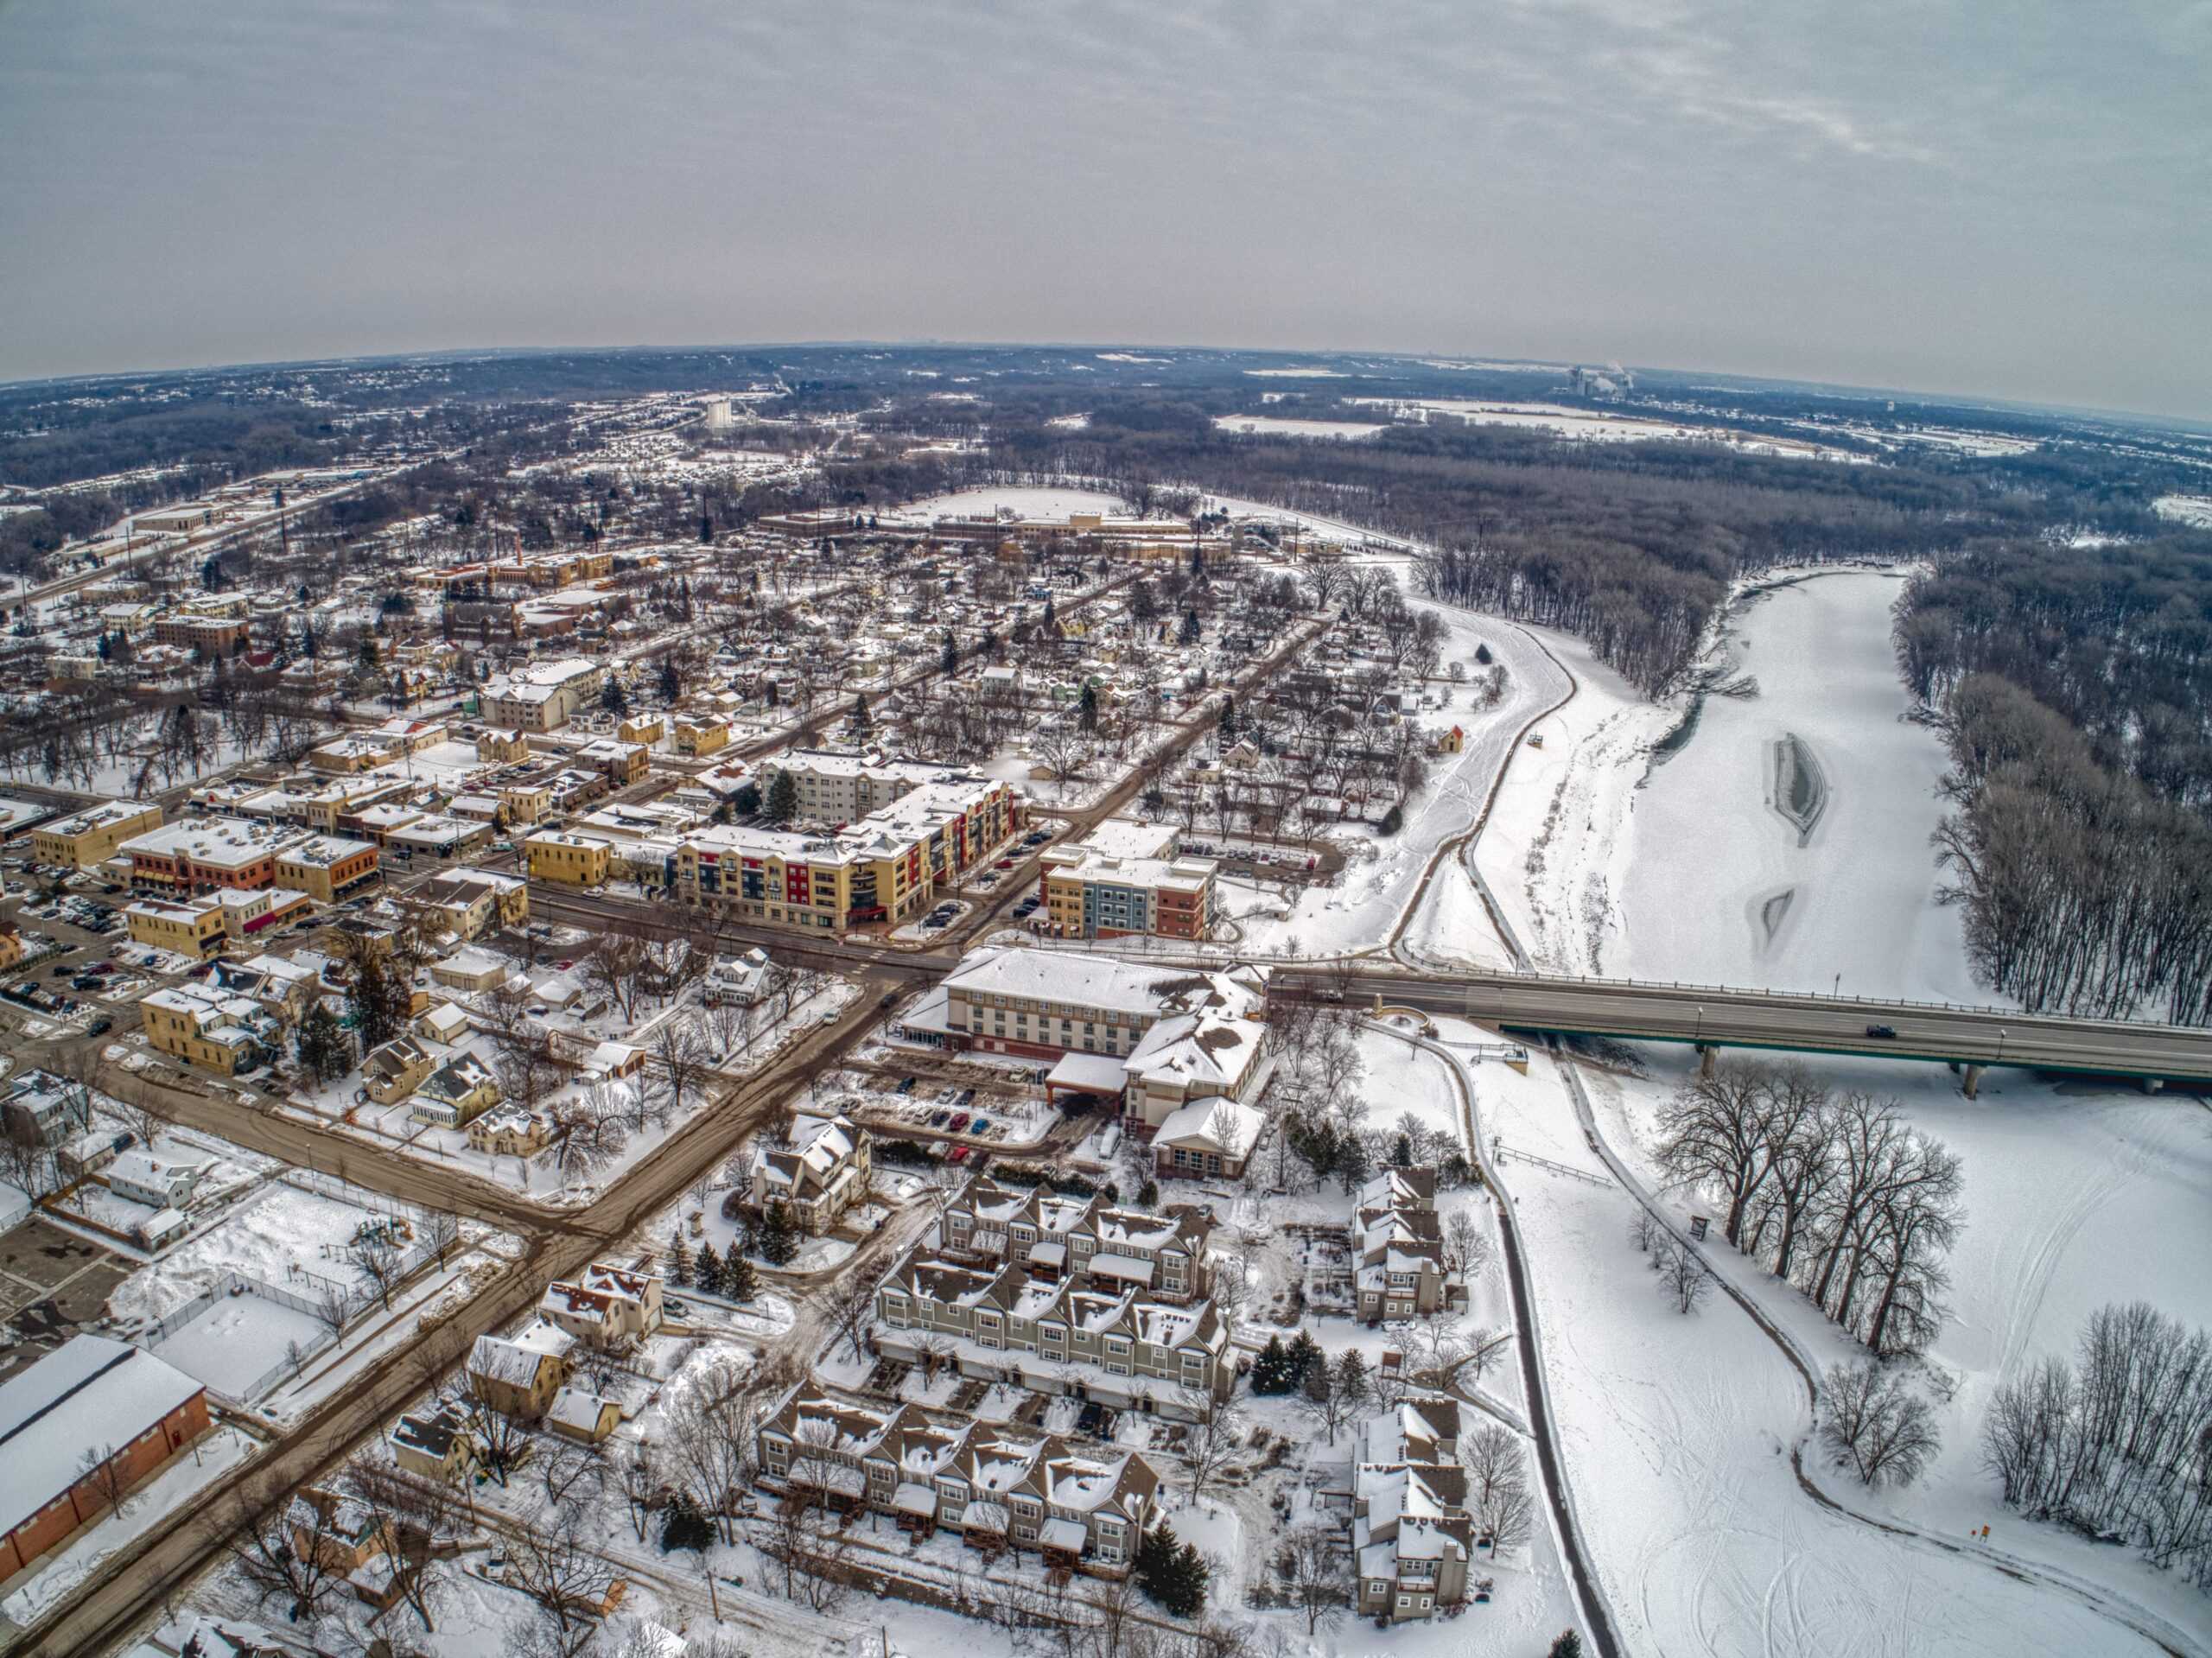
To understand better which states are still the worst for Black Americans today, 24/7 Wall St. created an index that assesses race-based gaps in eight measures: median household income, poverty rate, adult high school and bachelor’s degree attainment rates, homeownership rate, unemployment rate, incarceration rate by race, and age-adjusted mortality rate by race. These are based on five-year estimates from the U.S. Census Bureau’s 2022 American Community, the Bureau of Justice Statistics, and the Center for Disease Control. This index also ranks Black Americans’ conditions and the noticeable gap compared to White American residents. For each measure, we constructed an index from the gaps between Black and White Americans. The index was standardized using min-max normalization. Data on population by race came from the ACS.
Many of the lowest-ranking states found on this list are in the Midwest, an area of the country members of the Great Migration flocked to. However, redlining in notable places like Chicago and Detroit created segregated neighborhoods, encouraged “white flight,” and enforced racial disparity. Redlining is the act of designating neighborhoods as high risk because of race and thus denying residents home loans. To this day, the gap in homeownership rates in the worst states is significantly higher than the 28-point gap nationwide.
Why This Matters
 Despite significant strides and continued efforts to address the problems, racial inequalities and disparities in the United States today remain pervasive. Deeply rooted views and practices need to change for this to further improve. Increased awareness of the issues and knowledge of the data can serve individuals and decision-makers alike.
50. Hawaii

- Median household income: $80,207 (Black); $93,896 (white)
- Homeownership rate: 28.2% (Black); 57.7% (white)
- Unemployment rate: 12.2% (Black); 5.6% (white)
- Black population: 26,664 (1.8% of total)
49. New Mexico

- Median household income: $48,987 (Black); $63,910 (white)
- Homeownership rate: 37.8% (Black); 70.3% (white)
- Unemployment rate: 9.0% (Black); 6.0% (white)
- Black population: 37,996 (1.8% of total)
48. Texas

- Median household income: $55,459 (Black); $80,134 (white)
- Homeownership rate: 41.3% (Black); 67.7% (white)
- Unemployment rate: 8.4% (Black); 4.6% (white)
- Black population: 3,449,557 (11.8% of total)
47. Alaska
- Median household income: $71,857 (Black); $94,315 (white)
- Homeownership rate: 40.9% (Black); 70.7% (white)
- Unemployment rate: 4.6% (Black); 5.1% (white)
- Black population: 22,400 (3.0% of total)
46. Arizona

- Median household income: $58,184 (Black); $75,939 (white)
- Homeownership rate: 38.4% (Black); 70.3% (white)
- Unemployment rate: 8.3% (Black); 5.0% (white)
- Black population: 307,726 (4.3% of total)
45. West Virginia

- Median household income: $38,004 (Black); $55,826 (white)
- Homeownership rate: 44.5% (Black); 75.8% (white)
- Unemployment rate: 9.8% (Black); 6.2% (white)
- Black population: 60,237 (3.4% of total)
44. Kentucky

- Median household income: $44,196 (Black); $62,242 (white)
- Homeownership rate: 37.9% (Black); 72.1% (white)
- Unemployment rate: 8.6% (Black); 4.9% (white)
- Black population: 355,368 (7.9% of total)
43. Georgia

- Median household income: $55,010 (Black); $81,445 (white)
- Homeownership rate: 49.0% (Black); 74.7% (white)
- Unemployment rate: 8.2% (Black); 4.1% (white)
- Black population: 3,334,095 (31.1% of total)
42. Idaho

- Median household income: $54,727 (Black); $71,661 (white)
- Homeownership rate: 36.9% (Black); 73.7% (white)
- Unemployment rate: 6.7% (Black); 3.9% (white)
- Black population: 11,919 (0.6% of total)
41. Oregon

- Median household income: $56,124 (Black); $77,627 (white)
- Homeownership rate: 33.9% (Black); 65.8% (white)
- Unemployment rate: 6.7% (Black); 5.5% (white)
- Black population: 75,790 (1.8% of total)
40. Maryland
- Median household income: $79,161 (Black); $109,387 (white)
- Homeownership rate: 52.5% (Black); 76.9% (white)
- Unemployment rate: 7.8% (Black); 4.0% (white)
- Black population: 1,815,877 (29.5% of total)
39. Delaware

- Median household income: $58,385 (Black); $86,094 (white)
- Homeownership rate: 51.5% (Black); 80.1% (white)
- Unemployment rate: 8.0% (Black); 4.9% (white)
- Black population: 213,516 (21.5% of total)
38. Wyoming

- Median household income: $56,046 (Black); $73,542 (white)
- Homeownership rate: 38.2% (Black); 73.0% (white)
- Unemployment rate: 11.0% (Black); 3.8% (white)
- Black population: 4,488 (0.8% of total)
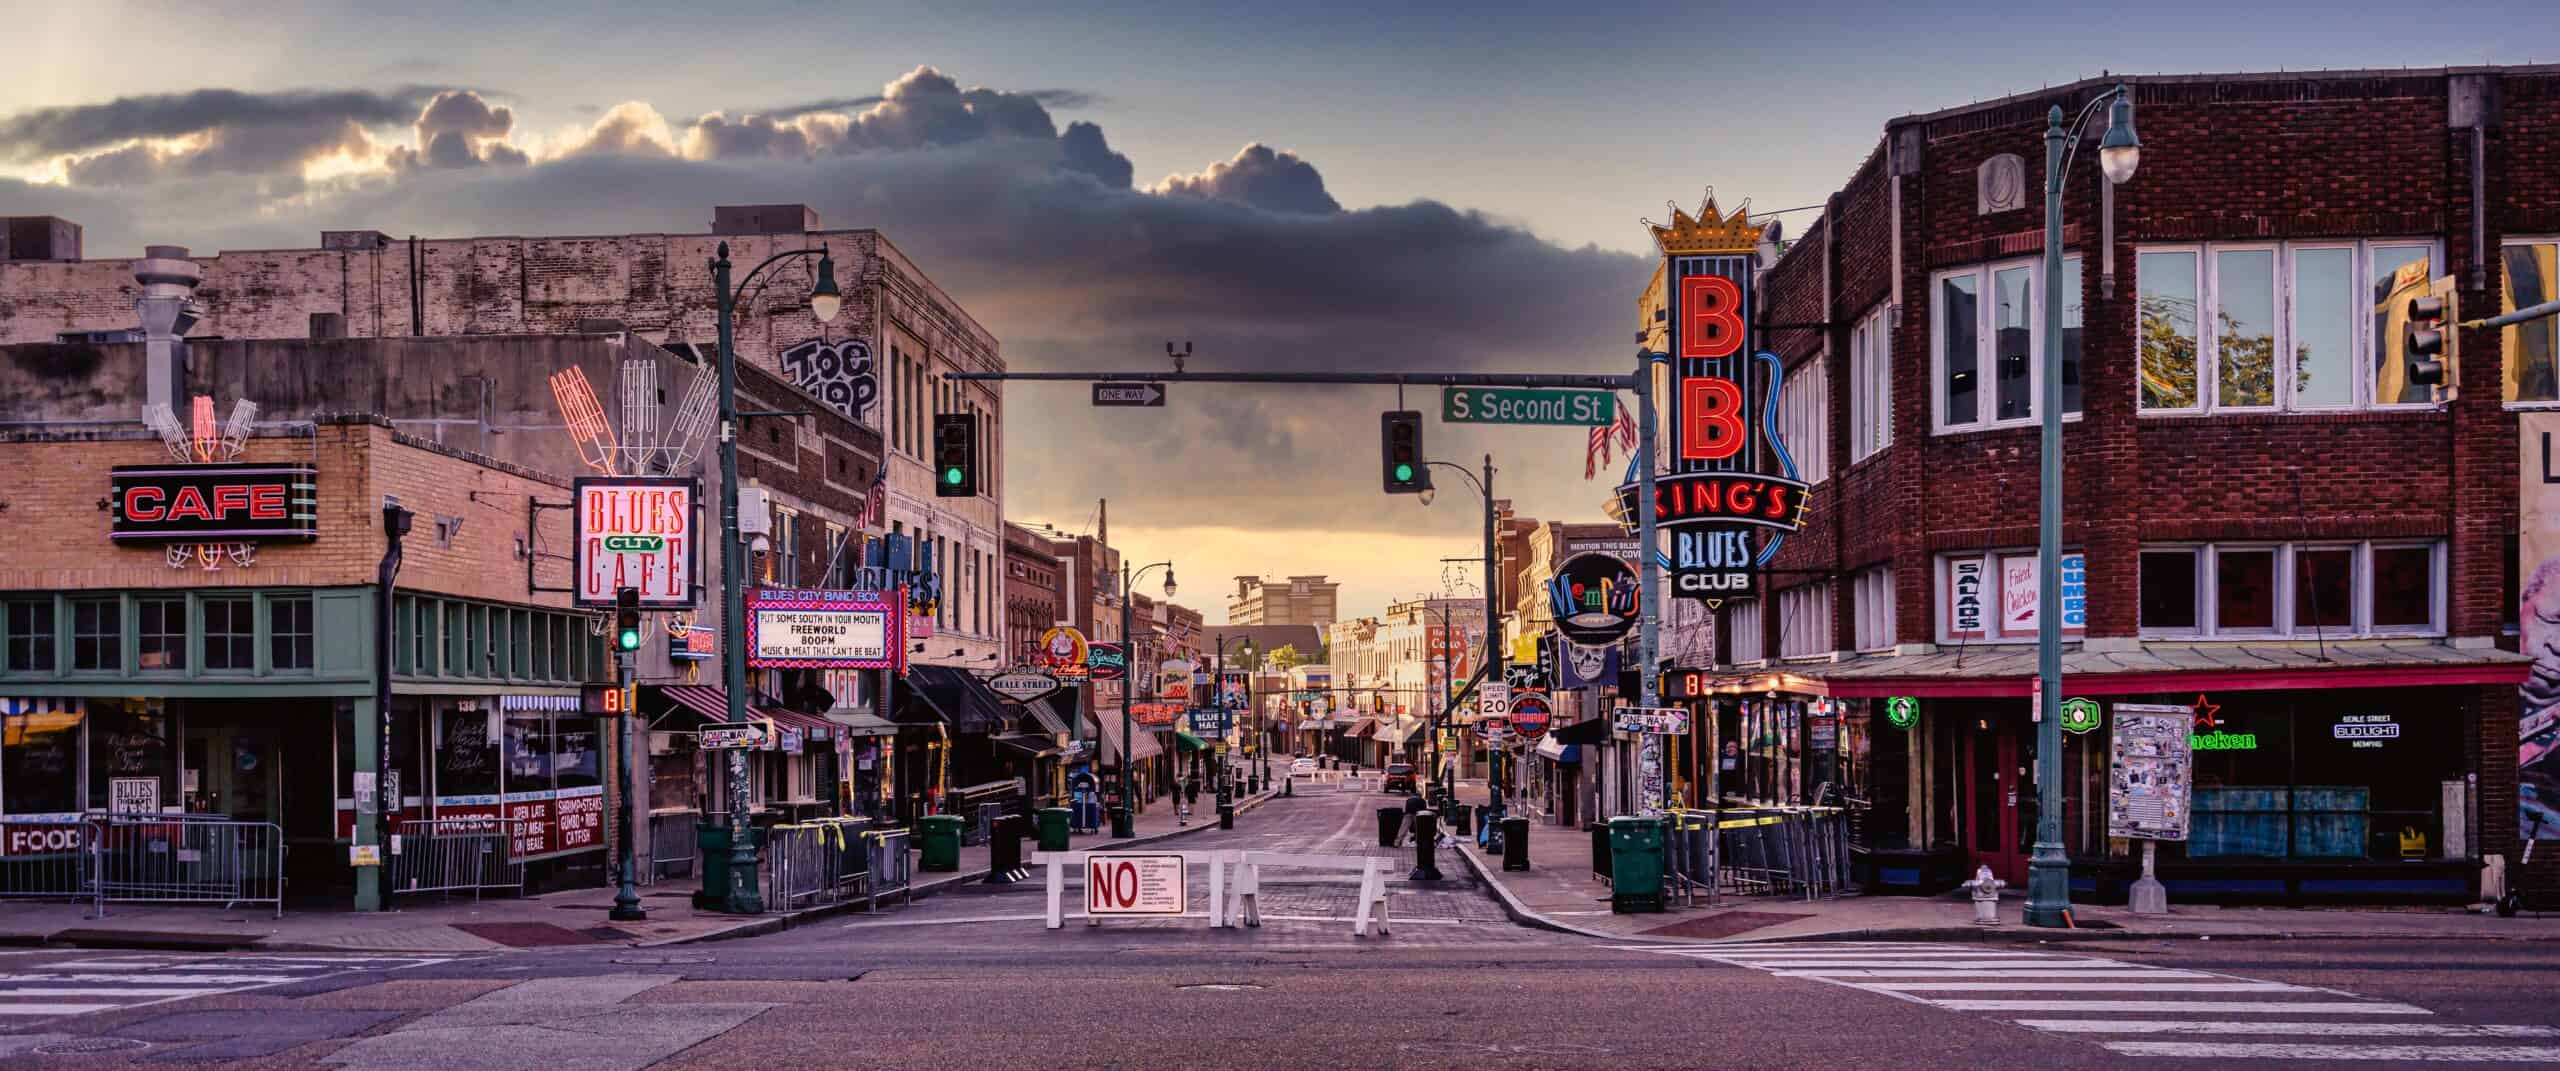
37. Tennessee
- Median household income: $46,708 (Black); $68,515 (white)
- Homeownership rate: 43.6% (Black); 73.1% (white)
- Unemployment rate: 9.4% (Black); 4.4% (white)
- Black population: 1,116,871 (16.1% of total)
36. Florida

- Median household income: $51,249 (Black); $72,212 (white)
- Homeownership rate: 47.6% (Black); 72.9% (white)
- Unemployment rate: 8.1% (Black); 4.6% (white)
- Black population: 3,232,871 (14.9% of total)
35. New Hampshire

- Median household income: $72,946 (Black); $91,394 (white)
- Homeownership rate: 36.2% (Black); 74.0% (white)
- Unemployment rate: 7.6% (Black); 3.7% (white)
- Black population: 18,477 (1.3% of total)
34. Washington

- Median household income: $65,817 (Black); $91,601 (white)
- Homeownership rate: 34.0% (Black); 67.6% (white)
- Unemployment rate: 8.1% (Black); 4.8% (white)
- Black population: 290,907 (3.8% of total)
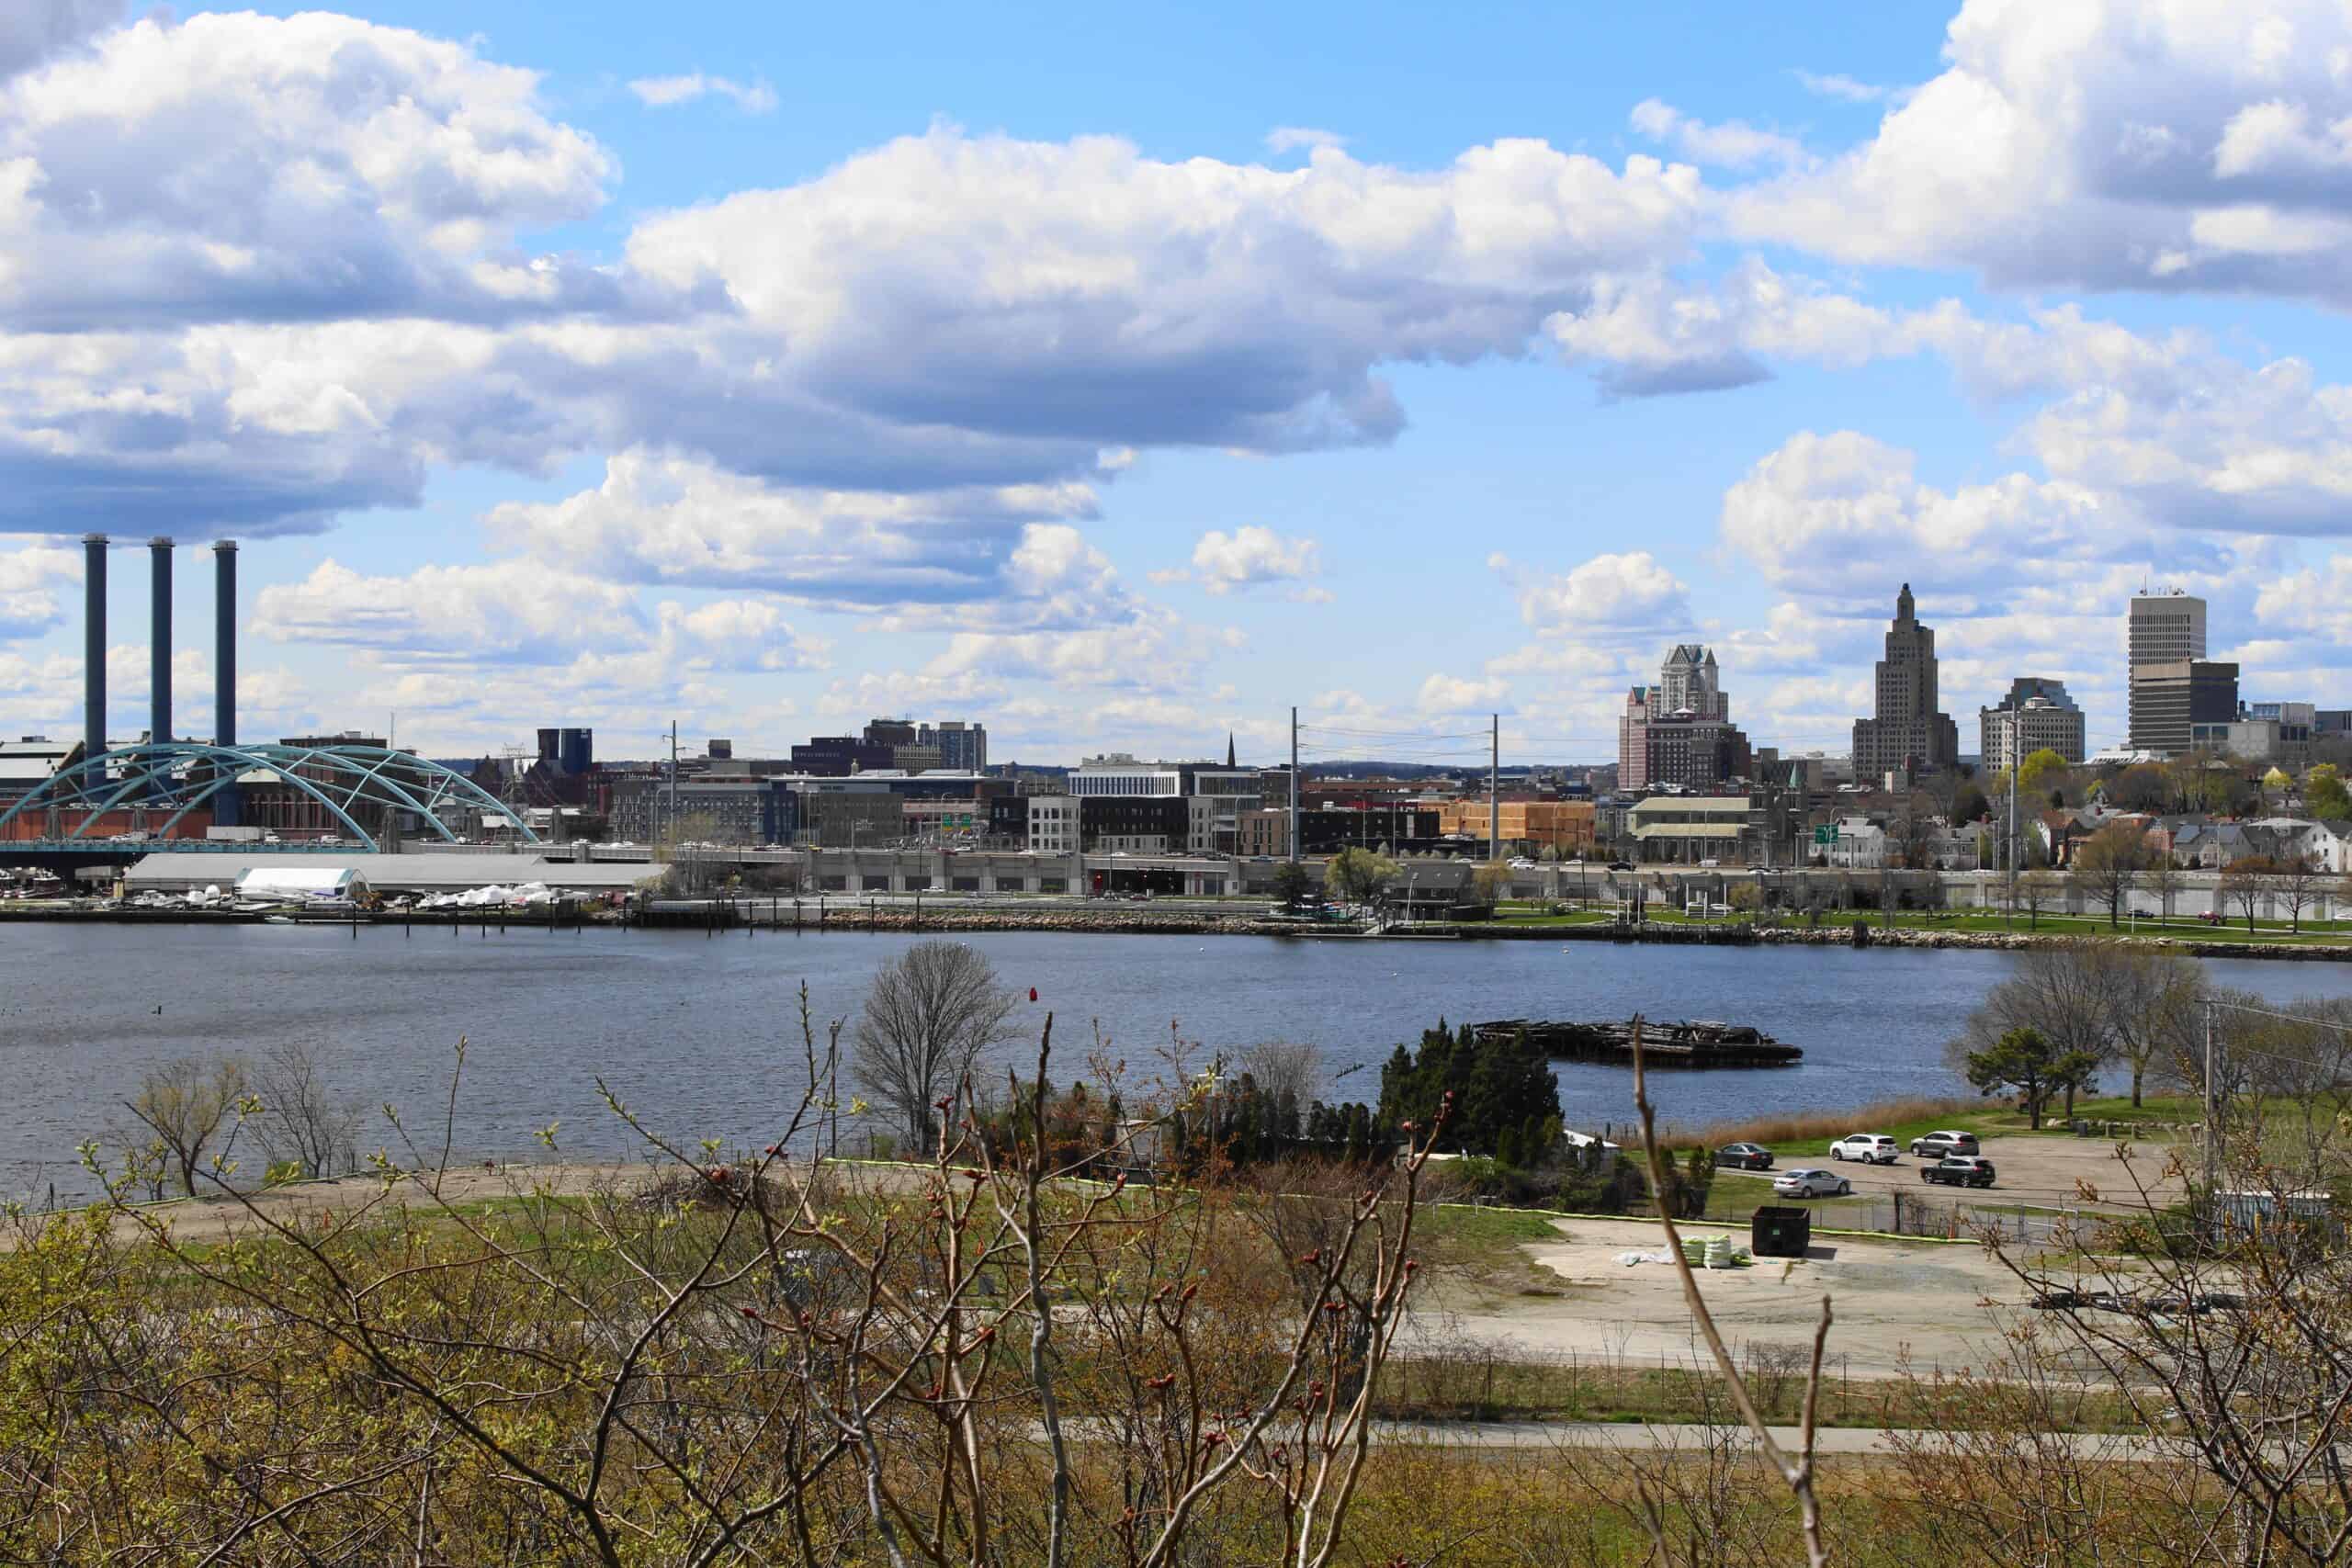
33. Rhode Island
- Median household income: $61,614 (Black); $86,467 (white)
- Homeownership rate: 35.1% (Black); 68.3% (white)
- Unemployment rate: 8.2% (Black); 5.3% (white)
- Black population: 58,304 (5.3% of total)
32. Oklahoma

- Median household income: $42,145 (Black); $65,469 (white)
- Homeownership rate: 39.8% (Black); 70.1% (white)
- Unemployment rate: 8.9% (Black); 4.4% (white)
- Black population: 277,702 (7.0% of total)
31. North Carolina

- Median household income: $47,088 (Black); $73,675 (white)
- Homeownership rate: 46.3% (Black); 73.7% (white)
- Unemployment rate: 8.3% (Black); 4.3% (white)
- Black population: 2,161,841 (20.6% of total)
30. Virginia

- Median household income: $60,201 (Black); $93,691 (white)
- Homeownership rate: 48.6% (Black); 73.1% (white)
- Unemployment rate: 7.2% (Black); 3.8% (white)
- Black population: 1,601,668 (18.6% of total)
29. South Dakota
- Median household income: $56,399 (Black); $72,498 (white)
- Homeownership rate: 25.6% (Black); 72.2% (white)
- Unemployment rate: 3.4% (Black); 2.3% (white)
- Black population: 19,172 (2.2% of total)
28. Alabama
- Median household income: $40,661 (Black); $69,042 (white)
- Homeownership rate: 51.3% (Black); 77.4% (white)
- Unemployment rate: 8.9% (Black); 4.1% (white)
- Black population: 1,318,388 (26.2% of total)
27. California
- Median household income: $64,513 (Black); $97,859 (white)
- Homeownership rate: 35.6% (Black); 60.7% (white)
- Unemployment rate: 10.5% (Black); 6.0% (white)
- Black population: 2,102,510 (5.3% of total)
26. Arkansas

- Median household income: $37,395 (Black); $60,756 (white)
- Homeownership rate: 44.2% (Black); 71.9% (white)
- Unemployment rate: 9.4% (Black); 4.5% (white)
- Black population: 454,728 (15.1% of total)
25. Nevada

- Median household income: $48,022 (Black); $77,786 (white)
- Homeownership rate: 31.6% (Black); 64.4% (white)
- Unemployment rate: 12.5% (Black); 6.2% (white)
- Black population: 278,689 (9.0% of total)
24. Vermont

- Median household income: $52,736 (Black); $74,499 (white)
- Homeownership rate: 27.7% (Black); 74.0% (white)
- Unemployment rate: 6.4% (Black); 3.8% (white)
- Black population: 7,548 (1.2% of total)
23. Maine
- Median household income: $53,407 (Black); $68,783 (white)
- Homeownership rate: 25.9% (Black); 74.4% (white)
- Unemployment rate: 5.6% (Black); 4.2% (white)
- Black population: 21,093 (1.5% of total)
22. Colorado

- Median household income: $61,343 (Black); $91,475 (white)
- Homeownership rate: 41.8% (Black); 69.1% (white)
- Unemployment rate: 7.8% (Black); 4.2% (white)
- Black population: 221,211 (3.8% of total)
21. Missouri

- Median household income: $44,293 (Black); $69,547 (white)
- Homeownership rate: 39.3% (Black); 72.4% (white)
- Unemployment rate: 8.2% (Black); 3.9% (white)
- Black population: 688,219 (11.2% of total)
20. Mississippi

- Median household income: $36,263 (Black); $65,518 (white)
- Homeownership rate: 54.4% (Black); 78.7% (white)
- Unemployment rate: 10.0% (Black); 4.9% (white)
- Black population: 1,098,675 (37.1% of total)
19. South Carolina

- Median household income: $42,672 (Black); $73,204 (white)
- Homeownership rate: 53.5% (Black); 78.4% (white)
- Unemployment rate: 7.9% (Black); 4.3% (white)
- Black population: 1,316,074 (25.6% of total)
18. Massachusetts
- Median household income: $67,044 (Black); $102,701 (white)
- Homeownership rate: 36.4% (Black); 68.5% (white)
- Unemployment rate: 8.4% (Black); 4.7% (white)
- Black population: 459,848 (6.6% of total)
17. Indiana
- Median household income: $42,067 (Black); $70,740 (white)
- Homeownership rate: 38.0% (Black); 74.9% (white)
- Unemployment rate: 9.9% (Black); 4.1% (white)
- Black population: 631,919 (9.3% of total)
16. Montana

- Median household income: $50,676 (Black); $68,005 (white)
- Homeownership rate: 27.4% (Black); 70.7% (white)
- Unemployment rate: 11.7% (Black); 3.3% (white)
- Black population: 5,248 (0.5% of total)
15. New York

- Median household income: $58,805 (Black); $90,866 (white)
- Homeownership rate: 32.7% (Black); 64.7% (white)
- Unemployment rate: 9.2% (Black); 5.0% (white)
- Black population: 2,767,223 (13.8% of total)
14. Louisiana

- Median household income: $37,015 (Black); $70,270 (white)
- Homeownership rate: 48.9% (Black); 76.9% (white)
- Unemployment rate: 10.4% (Black); 4.9% (white)
- Black population: 1,456,107 (31.4% of total)
13. North Dakota

- Median household income: $49,369 (Black); $77,950 (white)
- Homeownership rate: 11.7% (Black); 67.3% (white)
- Unemployment rate: 7.9% (Black); 2.6% (white)
- Black population: 24,882 (3.2% of total)
12. Utah

- Median household income: $57,433 (Black); $89,462 (white)
- Homeownership rate: 27.4% (Black); 73.2% (white)
- Unemployment rate: 5.8% (Black); 3.2% (white)
- Black population: 34,485 (1.1% of total)
11. Kansas
- Median household income: $46,145 (Black); $72,357 (white)
- Homeownership rate: 36.5% (Black); 70.2% (white)
- Unemployment rate: 9.1% (Black); 3.6% (white)
- Black population: 157,768 (5.4% of total)
10. Connecticut

- Median household income: $59,728 (Black); $98,855 (white)
- Homeownership rate: 40.7% (Black); 73.5% (white)
- Unemployment rate: 8.8% (Black); 5.2% (white)
- Black population: 355,970 (9.9% of total)
9. New Jersey

- Median household income: $65,351 (Black); $105,392 (white)
- Homeownership rate: 39.7% (Black); 73.3% (white)
- Unemployment rate: 9.2% (Black); 5.3% (white)
- Black population: 1,147,770 (12.4% of total)
8. Ohio

- Median household income: $40,499 (Black); $71,843 (white)
- Homeownership rate: 36.1% (Black); 72.7% (white)
- Unemployment rate: 10.6% (Black); 4.3% (white)
- Black population: 1,431,238 (12.2% of total)
7. Pennsylvania

- Median household income: $45,944 (Black); $77,962 (white)
- Homeownership rate: 43.4% (Black); 74.3% (white)
- Unemployment rate: 11.1% (Black); 4.6% (white)
- Black population: 1,347,784 (10.4% of total)
6. Michigan

- Median household income: $42,171 (Black); $73,039 (white)
- Homeownership rate: 43.3% (Black); 78.4% (white)
- Unemployment rate: 13.1% (Black); 5.0% (white)
- Black population: 1,346,918 (13.4% of total)
5. Nebraska
- Median household income: $45,287 (Black); $74,157 (white)
- Homeownership rate: 29.8% (Black); 70.0% (white)
- Unemployment rate: 8.3% (Black); 2.8% (white)
- Black population: 91,357 (4.7% of total)
4. Illinois
- Median household income: $46,717 (Black); $85,060 (white)
- Homeownership rate: 40.2% (Black); 73.7% (white)
- Unemployment rate: 13.7% (Black); 4.8% (white)
- Black population: 1,744,151 (13.7% of total)
3. Minnesota

- Median household income: $49,738 (Black); $87,692 (white)
- Homeownership rate: 28.4% (Black); 76.8% (white)
- Unemployment rate: 8.6% (Black); 3.4% (white)
- Black population: 377,173 (6.6% of total)
2. Iowa

- Median household income: $40,592 (Black); $72,363 (white)
- Homeownership rate: 27.2% (Black); 74.3% (white)
- Unemployment rate: 11.0% (Black); 3.4% (white)
- Black population: 117,940 (3.7% of total)
1. Wisconsin

- Median household income: $38,732 (Black); $75,803 (white)
- Homeownership rate: 26.5% (Black); 71.9% (white)
- Unemployment rate: 8.3% (Black); 3.0% (white)
- Black population: 356,150 (6.1% of total)
Smart Investors Are Quietly Loading Up on These “Dividend Legends”
If you want your portfolio to pay you cash like clockwork, it’s time to stop blindly following conventional wisdom like relying on Dividend Aristocrats. There’s a better option, and we want to show you. We’re offering a brand-new report on 2 stocks we believe offer the rare combination of a high dividend yield and significant stock appreciation upside. If you’re tired of feeling one step behind in this market, this free report is a must-read for you.
Click here to download your FREE copy of “2 Dividend Legends to Hold Forever” and start improving your portfolio today.
The post The Worst States for Black Americans: All States Ranked appeared first on 24/7 Wall St..